Bad Sobernheim Airbnb Market Analysis 2025: Short Term Rental Data & Vacation Rental Statistics in Rhineland-Palatinate, Germany
Is Airbnb profitable in Bad Sobernheim in 2025? Explore comprehensive Airbnb analytics for Bad Sobernheim, Rhineland-Palatinate, Germany to uncover income potential. This 2025 STR market report for Bad Sobernheim, based on AirROI data from June 2024 to May 2025, reveals key trends in the niche market of 21 active listings.
Whether you're considering an Airbnb investment in Bad Sobernheim, optimizing your existing vacation rental, or exploring rental arbitrage opportunities, understanding the Bad Sobernheim Airbnb data is crucial. Leveraging the low regulation environment is key to maximizing your short term rental income potential. Let's dive into the specifics.
Key Bad Sobernheim Airbnb Performance Metrics Overview
Monthly Airbnb Revenue Variations & Income Potential in Bad Sobernheim (2025)
Understanding the monthly revenue variations for Airbnb listings in Bad Sobernheim is key to maximizing your short term rental income potential. Seasonality significantly impacts earnings. Our analysis, based on data from the past 12 months, shows that the peak revenue month for STRs in Bad Sobernheim is typically August, while November often presents the lowest earnings, highlighting opportunities for strategic pricing adjustments during shoulder and low seasons. Explore the typical Airbnb income in Bad Sobernheim across different performance tiers:
- Best-in-class properties (Top 10%) achieve $1,361+ monthly, often utilizing dynamic pricing and superior guest experiences.
- Strong performing properties (Top 25%) earn $1,029 or more, indicating effective management and desirable locations/amenities.
- Typical properties (Median) generate around $635 per month, representing the average market performance.
- Entry-level properties (Bottom 25%) see earnings around $366, often with potential for optimization.
Average Monthly Airbnb Earnings Trend in Bad Sobernheim
Bad Sobernheim Airbnb Occupancy Rate Trends (2025)
Maximize your bookings by understanding the Bad Sobernheim STR occupancy trends. Seasonal demand shifts significantly influence how often properties are booked. Typically, Junesees the highest demand (peak season occupancy), while November experiences the lowest (low season). Effective strategies, like adjusting minimum stays or offering promotions, can boost occupancy during slower periods. Here's how different property tiers perform in Bad Sobernheim:
- Best-in-class properties (Top 10%) achieve 84%+ occupancy, indicating high desirability and potentially optimized availability.
- Strong performing properties (Top 25%) maintain 58% or higher occupancy, suggesting good market fit and guest satisfaction.
- Typical properties (Median) have an occupancy rate around 29%.
- Entry-level properties (Bottom 25%) average 12% occupancy, potentially facing higher vacancy.
Average Monthly Occupancy Rate Trend in Bad Sobernheim
Average Daily Rate (ADR) Airbnb Trends in Bad Sobernheim (2025)
Effective short term rental pricing strategy in Bad Sobernheim involves understanding monthly ADR fluctuations. The Average Daily Rate (ADR) for Airbnb in Bad Sobernheim typically peaks in May and dips lowest during December. Leveraging Airbnb dynamic pricing tools or strategies based on this seasonality can significantly boost revenue. Here's a look at the typical nightly rates achieved:
- Best-in-class properties (Top 10%) command rates of $179+ per night, often due to premium features or locations.
- Strong performing properties (Top 25%) achieve nightly rates of $145 or more.
- Typical properties (Median) charge around $94 per night.
- Entry-level properties (Bottom 25%) earn around $49 per night.
Average Daily Rate (ADR) Trend by Month in Bad Sobernheim
Get Live Bad Sobernheim Market Intelligence 👇

Explore Real-time Analytics
Airbnb Seasonality Analysis & Trends in Bad Sobernheim (2025)
Peak Season (August, September, July)
- Revenue averages $955 per month
- Occupancy rates average 42.9%
- Daily rates average $98
Shoulder Season
- Revenue averages $734 per month
- Occupancy maintains around 37.7%
- Daily rates hold near $103
Low Season (February, November, December)
- Revenue drops to average $558 per month
- Occupancy decreases to average 30.6%
- Daily rates adjust to average $100
Seasonality Insights for Bad Sobernheim
- The Airbnb seasonality in Bad Sobernheim shows highly seasonal trends requiring careful strategy. While the sections above show seasonal averages, it's also insightful to look at the extremes:
- During the high season, the absolute peak month showcases Bad Sobernheim's highest earning potential, with monthly revenues capable of climbing to $1,018, occupancy reaching a high of 50.4%, and ADRs peaking at $108.
- Conversely, the slowest single month of the year, typically falling within the low season, marks the market's lowest point. In this month, revenue might dip to $471, occupancy could drop to 28.1%, and ADRs may adjust down to $97.
- Understanding both the seasonal averages and these monthly peaks and troughs in revenue, occupancy, and ADR is crucial for maximizing your Airbnb profit potential in Bad Sobernheim.
Seasonal Strategies for Maximizing Profit
- Peak Season: Maximize revenue through premium pricing and potentially longer minimum stays. Ensure high availability.
- Low Season: Offer competitive pricing, special promotions (e.g., extended stay discounts), and flexible cancellation policies. Target off-season travelers like remote workers or budget-conscious guests.
- Shoulder Seasons: Implement dynamic pricing that balances peak and low rates. Target weekend travelers or specific events. Offer slightly more flexible terms than peak season.
- Regularly analyze your own performance against these Bad Sobernheim seasonality benchmarks and adjust your pricing and availability strategy accordingly.
Best Areas for Airbnb Investment in Bad Sobernheim (2025)
Exploring the top neighborhoods for short-term rentals in Bad Sobernheim? This section highlights key areas, outlining why they are attractive for hosts and guests, along with notable local attractions. Consider these locations based on your target guest profile and investment strategy.
| Neighborhood / Area | Why Host Here? (Target Guests & Appeal) | Key Attractions & Landmarks |
|---|---|---|
| Historical District | Bad Sobernheim's charming historical center is perfect for guests interested in local history and heritage. It offers a picturesque setting with many traditional German houses and a relaxed atmosphere. | Bad Sobernheim Local History Museum, Old Town, Evangelische Kirche, Wiesenthal Park, Rheinland-Pfalz State Garden Show |
| Nahe River Area | The scenic river area is ideal for nature lovers and outdoor enthusiasts. The Nahe River offers activities like hiking, cycling, and wine tasting, making it attractive to visitors looking for a rural retreat. | Nahe River hiking trails, Wine tasting tours, Picnic spots by the river, Cycling routes along the Nahe, Local vineyards |
| Spa District | Known for its wellness offerings, this area attracts visitors seeking health and relaxation. The local spas and thermal baths make it a popular destination for those looking to unwind. | Thermal baths, Wellness spas, Relaxation centers, Yoga studios, Health-focused restaurants |
| Wine Region | Situated in a renowned wine region, it draws tourists for its vineyards and wine festivals. Guests can immerse themselves in the local wine culture and enjoy picturesque countryside views. | Local vineyards, Wine festivals, Wine tasting events, Scenic drives through vineyards, Biking tours |
| Cultural Festivals | Home to various cultural festivals throughout the year, this area sees increased tourism during festival times, making it a vibrant spot for Airbnb hosting. | Local festivals, Cultural events, Flea markets, Art exhibitions, Music concerts |
| Nature Trails | Surrounded by nature, this area is excellent for hikers and nature lovers, drawing visitors looking for outdoor adventures and tranquil settings. | Hiking trails, Nature reserves, Birdwatching spots, Scenic viewpoints, Camping areas |
| Family Friendly Attractions | This area offers activities and attractions suitable for families, making it appealing for parents traveling with children. | Playgrounds, Family-friendly parks, Educational farms, Local aquariums, Kids' activity centers |
| Culinary Spots | Features various local restaurants and eateries that showcase the regional cuisine, attracting food lovers and culinary tourists. | Local cafes, Traditional German restaurants, Bakeries, Food markets, Cooking schools |
Understanding Airbnb License Requirements & STR Laws in Bad Sobernheim (2025)
While Bad Sobernheim, Rhineland-Palatinate, Germany currently shows low STR regulations, specific Airbnb license requirements might still exist or change. Always verify the latest short term rental regulations and Airbnb license requirements directly with local government authorities for Bad Sobernheim to ensure full compliance before hosting.
(Source: AirROI data, 2025, based on 5% licensed listings)
Top Performing Airbnb Properties in Bad Sobernheim (2025)
Benchmark your potential! Explore examples of top-performing Airbnb properties in Bad Sobernheimbased on Trailing Twelve Month (TTM) revenue. Analyze their characteristics, revenue, occupancy rate, and ADR to understand what drives success in this market.

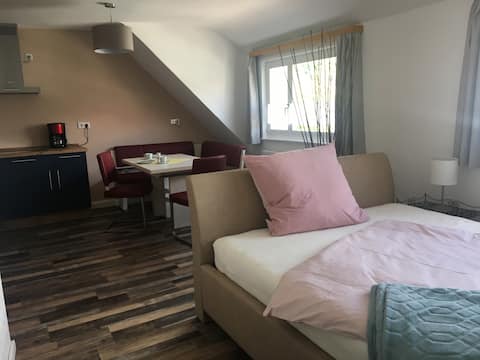
Vacation home at Birkenhain
Entire Place • 1 bedroom
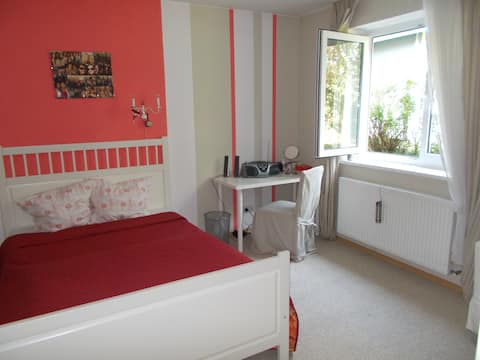
your holiday home Scheliga "Mini" , Bad Sobernheim
Entire Place • 1 bedroom
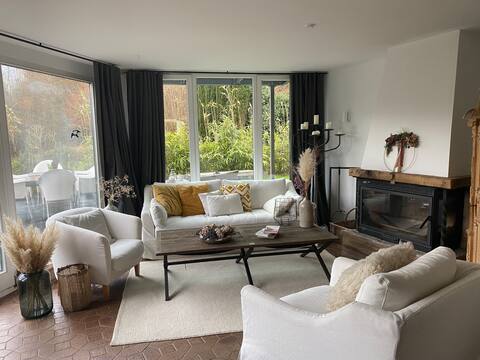
Friendly, cozy apartment, 68 sqm
Entire Place • 1 bedroom

Large apartment Scheib, Bad Sobernheim
Entire Place • 1 bedroom
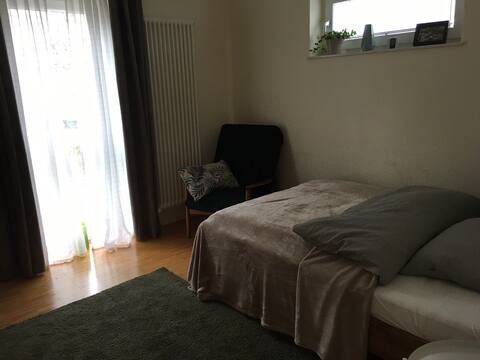
Private room, private shower
Private Room • N/A
The forest house
Entire Place • 2 bedrooms
Note: Performance varies based on location, size, amenities, seasonality, and management quality. Data reflects the past 12 months.
Top Performing Airbnb Hosts in Bad Sobernheim (2025)
Learn from the best! This table showcases top-performing Airbnb hosts in Bad Sobernheim based on the number of properties managed and estimated total revenue over the past year. Analyze their scale and performance metrics.
| Host Name | Properties | Grossing Revenue | Stay Reviews | Avg Rating |
|---|---|---|---|---|
| Tullius | 6 | $24,448 | 1 | N/A/5.0 |
| Bernhard Und Indira | 2 | $16,249 | 16 | 4.93/5.0 |
| Armin | 2 | $14,722 | 104 | 4.87/5.0 |
| Jonas Und Sarah | 1 | $14,372 | 81 | 4.94/5.0 |
| Dorothee | 1 | $11,920 | 208 | 4.79/5.0 |
| Ralf | 2 | $10,845 | 20 | 4.88/5.0 |
| Elke | 2 | $10,311 | 7 | 4.86/5.0 |
| Renate | 1 | $8,822 | 113 | 4.96/5.0 |
| Ephraim | 1 | $8,094 | 8 | 4.88/5.0 |
| Maria | 1 | $6,828 | 95 | 4.84/5.0 |
Analyzing the strategies of top hosts, such as their property selection, pricing, and guest communication, can offer valuable lessons for optimizing your own Airbnb operations in Bad Sobernheim.
Dive Deeper: Advanced Bad Sobernheim STR Market Data (2025)
Ready to unlock more insights? AirROI provides access to advanced metrics and comprehensive Airbnb data for Bad Sobernheim. Explore detailed analytics beyond this report to refine your investment strategy, optimize pricing, and maximize your vacation rental profits.
Explore Advanced MetricsBad Sobernheim Short-Term Rental Market Composition (2025): Property & Room Types
Room Type Distribution
Property Type Distribution
Market Composition Insights for Bad Sobernheim
- The Bad Sobernheim Airbnb market composition is heavily skewed towards Entire Home/Apt listings, which make up 76.2% of the 21 active rentals. This indicates strong guest preference for privacy and space.
- Looking at the property type distribution in Bad Sobernheim, Apartment/Condo properties are the most common (66.7%), reflecting the local real estate landscape.
- Houses represent a significant 19% portion, catering likely to families or larger groups.
- The presence of 14.3% Hotel/Boutique listings indicates integration with traditional hospitality.
Bad Sobernheim Airbnb Room Capacity Analysis (2025): Bedroom Distribution
Distribution of Listings by Number of Bedrooms
Room Capacity Insights for Bad Sobernheim
- The dominant room capacity in Bad Sobernheim is 1 bedroom listings, making up 71.4% of the market. This suggests a strong demand for properties suitable for couples or solo travelers.
- Together, 1 bedroom and 2 bedrooms properties represent 85.7% of the active Airbnb listings in Bad Sobernheim, indicating a high concentration in these sizes.
- With over half the market (71.4%) consisting of studios or 1-bedroom units, Bad Sobernheim is particularly well-suited for individuals or couples.
- Listings with 3+ bedrooms (9.5%) represent a smaller niche, potentially indicating an underserved market for larger group accommodations in Bad Sobernheim.
Bad Sobernheim Vacation Rental Guest Capacity Trends (2025)
Distribution of Listings by Guest Capacity
Guest Capacity Insights for Bad Sobernheim
- The most common guest capacity trend in Bad Sobernheim vacation rentals is listings accommodating 2 guests (38.1%). This suggests the primary traveler segment is likely couples or solo travelers.
- Properties designed for 2 guests and 3 guests dominate the Bad Sobernheim STR market, accounting for 61.9% of listings.
- Listings for large groups (6+ guests) are relatively rare (4.8%), potentially indicating an opportunity for hosts targeting this segment in Bad Sobernheim.
- On average, properties in Bad Sobernheim are equipped to host 3.1 guests.
Bad Sobernheim Airbnb Booking Patterns (2025): Available vs. Booked Days
Available Days Distribution
Booked Days Distribution
Booking Pattern Insights for Bad Sobernheim
- The most common availability pattern in Bad Sobernheim falls within the 271-366 days range, representing 61.9% of listings. This suggests many properties have significant open periods on their calendars.
- Approximately 80.9% of listings show high availability (181+ days open annually), indicating potential for increased bookings or specific owner usage patterns.
- For booked days, the 1-30 days range is most frequent in Bad Sobernheim (33.3%), reflecting common guest stay durations or potential owner blocking patterns.
- A notable 19.1% of properties secure long booking periods (181+ days booked per year), highlighting successful long-term rental strategies or significant owner usage.
Bad Sobernheim Airbnb Minimum Stay Requirements Analysis
Distribution of Listings by Minimum Night Requirement
1 Night
9 listings
45% of total
2 Nights
7 listings
35% of total
3 Nights
1 listings
5% of total
30+ Nights
3 listings
15% of total
Key Insights
- The most prevalent minimum stay requirement in Bad Sobernheim is 1 Night, adopted by 45% of listings. This highlights the market's preference for shorter, flexible bookings.
- A strong majority (80.0%) of the Bad Sobernheim Airbnb data shows acceptance of very short stays (1-2 nights), indicating a dynamic, high-turnover market.
- A significant segment (15%) caters to monthly stays (30+ nights) in Bad Sobernheim, pointing to opportunities in the extended-stay market.
Recommendations
- Align with the market by considering a 1 Night minimum stay, as 45% of Bad Sobernheim hosts use this setting.
- Explore offering discounts for stays of 30+ nights to attract the 15% of the market seeking extended stays.
- Adjust minimum nights based on seasonality – potentially shorter during low season and longer during peak demand periods in Bad Sobernheim.
Bad Sobernheim Airbnb Cancellation Policy Trends Analysis (2025)
Flexible
8 listings
50% of total
Moderate
4 listings
25% of total
Firm
2 listings
12.5% of total
Strict
2 listings
12.5% of total
Cancellation Policy Insights for Bad Sobernheim
- The prevailing Airbnb cancellation policy trend in Bad Sobernheim is Flexible, used by 50% of listings.
- The market strongly favors guest-friendly terms, with 75.0% of listings offering Flexible or Moderate policies. This suggests guests in Bad Sobernheim may expect booking flexibility.
Recommendations for Hosts
- Consider adopting a Flexible policy to align with the 50% market standard in Bad Sobernheim.
- Using a Strict policy might deter some guests, as only 12.5% of listings use it. Evaluate if potential revenue protection outweighs possible lower booking rates.
- Regularly review your cancellation policy against competitors and market demand shifts in Bad Sobernheim.
Bad Sobernheim STR Booking Lead Time Analysis (2025)
Average Booking Lead Time by Month
Booking Lead Time Insights for Bad Sobernheim
- The overall average booking lead time for vacation rentals in Bad Sobernheim is 47 days.
- Guests book furthest in advance for stays during April (average 68 days), likely coinciding with peak travel demand or local events.
- The shortest booking windows occur for stays in March (average 32 days), indicating more last-minute travel plans during this time.
- Seasonally, Spring (55 days avg.) sees the longest lead times, while Winter (39 days avg.) has the shortest, reflecting typical travel planning cycles.
Recommendations for Hosts
- Use the overall average lead time (47 days) as a baseline for your pricing and availability strategy in Bad Sobernheim.
- For April stays, consider implementing length-of-stay discounts or slightly higher rates for bookings made less than 68 days out to capitalize on advance planning.
- Target marketing efforts for the Spring season well in advance (at least 55 days) to capture early planners.
- Monitor your own booking lead times against these Bad Sobernheim averages to identify opportunities for dynamic pricing adjustments.
Popular & Essential Airbnb Amenities in Bad Sobernheim (2025)
Amenity Prevalence
Amenity Insights for Bad Sobernheim
- Essential amenities in Bad Sobernheim that guests expect include: Wifi, Smoke alarm, Heating. Lacking these (any) could significantly impact bookings.
- Popular amenities like Hair dryer, Kitchen, Free parking on premises are common but not universal. Offering these can provide a competitive edge.
Recommendations for Hosts
- Ensure your listing includes all essential amenities for Bad Sobernheim: Wifi, Smoke alarm, Heating.
- Consider adding popular differentiators like Hair dryer or Kitchen to increase appeal.
- Highlight unique or less common amenities you offer (e.g., hot tub, dedicated workspace, EV charger) in your listing description and photos.
- Regularly check competitor amenities in Bad Sobernheim to stay competitive.
Bad Sobernheim Airbnb Guest Demographics & Profile Analysis (2025)
Guest Profile Summary for Bad Sobernheim
- The typical guest profile for Airbnb in Bad Sobernheim consists of primarily domestic travelers (88%), often arriving from nearby Bonn, typically belonging to the Post-2000s (Gen Z/Alpha) group (50%), primarily speaking German or English.
- Domestic travelers account for 87.6% of guests.
- Key international markets include Germany (87.6%) and Netherlands (4.5%).
- Top languages spoken are German (39.7%) followed by English (35.1%).
- A significant demographic segment is the Post-2000s (Gen Z/Alpha) group, representing 50% of guests.
Recommendations for Hosts
- Target domestic marketing efforts towards travelers from Bonn and Düsseldorf.
- Tailor amenities and listing descriptions to appeal to the dominant Post-2000s (Gen Z/Alpha) demographic (e.g., highlight fast WiFi, smart home features, local guides).
- Highlight unique local experiences or amenities relevant to the primary guest profile.
- Consider seasonal promotions aligned with peak travel times for key origin markets.
Nearby Short-Term Rental Market Comparison
How does the Bad Sobernheim Airbnb market stack up against its neighbors? Compare key performance metrics like average monthly revenue, ADR, and occupancy rates in surrounding areas to understand the broader regional STR landscape.
| Market | Active Properties | Monthly Revenue | Daily Rate | Avg. Occupancy |
|---|---|---|---|---|
| Ittenheim | 21 | $3,491 | $235.70 | 42% |
| Kruft | 13 | $3,340 | $229.39 | 41% |
| Belmont | 12 | $3,303 | $282.76 | 39% |
| Furdenheim | 19 | $3,205 | $318.23 | 47% |
| Le Valtin | 17 | $3,002 | $321.67 | 39% |
| Hurtigheim | 10 | $2,867 | $202.90 | 43% |
| Ondenval | 11 | $2,787 | $235.48 | 42% |
| Unkel | 18 | $2,750 | $232.55 | 41% |
| Bütgenbach | 30 | $2,747 | $327.96 | 36% |
| Griesheim-près-Molsheim | 21 | $2,742 | $250.06 | 40% |