Meckenheim Airbnb Market Analysis 2025: Short Term Rental Data & Vacation Rental Statistics in North Rhine-Westphalia, Germany
Is Airbnb profitable in Meckenheim in 2025? Explore comprehensive Airbnb analytics for Meckenheim, North Rhine-Westphalia, Germany to uncover income potential. This 2025 STR market report for Meckenheim, based on AirROI data from April 2024 to March 2025, reveals key trends in the niche market of 18 active listings.
Whether you're considering an Airbnb investment in Meckenheim, optimizing your existing vacation rental, or exploring rental arbitrage opportunities, understanding the Meckenheim Airbnb data is crucial. Leveraging the low regulation environment is key to maximizing your short term rental income potential. Let's dive into the specifics.
Key Meckenheim Airbnb Performance Metrics Overview
Monthly Airbnb Revenue Variations & Income Potential in Meckenheim (2025)
Understanding the monthly revenue variations for Airbnb listings in Meckenheim is key to maximizing your short term rental income potential. Seasonality significantly impacts earnings. Our analysis, based on data from the past 12 months, shows that the peak revenue month for STRs in Meckenheim is typically April, while February often presents the lowest earnings, highlighting opportunities for strategic pricing adjustments during shoulder and low seasons. Explore the typical Airbnb income in Meckenheim across different performance tiers:
- Best-in-class properties (Top 10%) achieve $3,311+ monthly, often utilizing dynamic pricing and superior guest experiences.
- Strong performing properties (Top 25%) earn $2,001 or more, indicating effective management and desirable locations/amenities.
- Typical properties (Median) generate around $1,129 per month, representing the average market performance.
- Entry-level properties (Bottom 25%) see earnings around $668, often with potential for optimization.
Average Monthly Airbnb Earnings Trend in Meckenheim
Meckenheim Airbnb Occupancy Rate Trends (2025)
Maximize your bookings by understanding the Meckenheim STR occupancy trends. Seasonal demand shifts significantly influence how often properties are booked. Typically, Septembersees the highest demand (peak season occupancy), while March experiences the lowest (low season). Effective strategies, like adjusting minimum stays or offering promotions, can boost occupancy during slower periods. Here's how different property tiers perform in Meckenheim:
- Best-in-class properties (Top 10%) achieve 83%+ occupancy, indicating high desirability and potentially optimized availability.
- Strong performing properties (Top 25%) maintain 71% or higher occupancy, suggesting good market fit and guest satisfaction.
- Typical properties (Median) have an occupancy rate around 50%.
- Entry-level properties (Bottom 25%) average 29% occupancy, potentially facing higher vacancy.
Average Monthly Occupancy Rate Trend in Meckenheim
Average Daily Rate (ADR) Airbnb Trends in Meckenheim (2025)
Effective short term rental pricing strategy in Meckenheim involves understanding monthly ADR fluctuations. The Average Daily Rate (ADR) for Airbnb in Meckenheim typically peaks in March and dips lowest during September. Leveraging Airbnb dynamic pricing tools or strategies based on this seasonality can significantly boost revenue. Here's a look at the typical nightly rates achieved:
- Best-in-class properties (Top 10%) command rates of $153+ per night, often due to premium features or locations.
- Strong performing properties (Top 25%) achieve nightly rates of $96 or more.
- Typical properties (Median) charge around $51 per night.
- Entry-level properties (Bottom 25%) earn around $43 per night.
Average Daily Rate (ADR) Trend by Month in Meckenheim
Get Live Meckenheim Market Intelligence 👇

Explore Real-time Analytics
Airbnb Seasonality Analysis & Trends in Meckenheim (2025)
Peak Season (April, September, August)
- Revenue averages $2,542 per month
- Occupancy rates average 63.7%
- Daily rates average $86
Shoulder Season
- Revenue averages $1,621 per month
- Occupancy maintains around 49.2%
- Daily rates hold near $103
Low Season (February, November, December)
- Revenue drops to average $1,240 per month
- Occupancy decreases to average 46.3%
- Daily rates adjust to average $112
Seasonality Insights for Meckenheim
- The Airbnb seasonality in Meckenheim shows highly seasonal trends requiring careful strategy. While the sections above show seasonal averages, it's also insightful to look at the extremes:
- During the high season, the absolute peak month showcases Meckenheim's highest earning potential, with monthly revenues capable of climbing to $2,846, occupancy reaching a high of 67.3%, and ADRs peaking at $142.
- Conversely, the slowest single month of the year, typically falling within the low season, marks the market's lowest point. In this month, revenue might dip to $1,185, occupancy could drop to 34.0%, and ADRs may adjust down to $85.
- Understanding both the seasonal averages and these monthly peaks and troughs in revenue, occupancy, and ADR is crucial for maximizing your Airbnb profit potential in Meckenheim.
Seasonal Strategies for Maximizing Profit
- Peak Season: Maximize revenue through premium pricing and potentially longer minimum stays. Ensure high availability.
- Low Season: Offer competitive pricing, special promotions (e.g., extended stay discounts), and flexible cancellation policies. Target off-season travelers like remote workers or budget-conscious guests.
- Shoulder Seasons: Implement dynamic pricing that balances peak and low rates. Target weekend travelers or specific events. Offer slightly more flexible terms than peak season.
- Regularly analyze your own performance against these Meckenheim seasonality benchmarks and adjust your pricing and availability strategy accordingly.
Best Areas for Airbnb Investment in Meckenheim (2025)
Exploring the top neighborhoods for short-term rentals in Meckenheim? This section highlights key areas, outlining why they are attractive for hosts and guests, along with notable local attractions. Consider these locations based on your target guest profile and investment strategy.
| Neighborhood / Area | Why Host Here? (Target Guests & Appeal) | Key Attractions & Landmarks |
|---|---|---|
| Mittelstadt | Central area of Meckenheim with a mix of residential and commercial properties. Great for hosting travelers looking for easy access to local shops and dining options. | Stadtpark Meckenheim, Meckenheim Market Square, Meckenheim Town Hall, St. John Baptist Church |
| Bonn City Center | Close proximity to Bonn, known for its historical significance and cultural sites. Attracts visitors for business and leisure. | Beethoven House, Bonner Münster, Rheinische Landesmuseum Bonn, Poppelsdorf Palace, Botanical Gardens |
| Rheinbach | Nearby town with charm and historical sites. Offers a quieter experience while still being accessible to Meckenheim's amenities. | Rheinbach Town Center, Basilica of St. Martin, Rheinbach's famous chocolate museum |
| Bad Godesberg | Bonn's upscale district, popular for its spa facilities and scenic views of the Rhine. Appeals to tourists seeking relaxation. | Godesburg Castle, Kammerspiele Bad Godesberg, Bad Godesberg Promenade |
| Wachtberg | Surrounding nature and hiking opportunities, perfect for travelers looking to explore the great outdoors while staying close to the city. | Wachtberg Forest, Hiking trails, Scenic viewpoints |
| Sankt Augustin | A commuter town with easy access to Bonn and Cologne. Great for business travelers and families. | Schloss Birlinghoven, Sankt Augustin Town Center, Parks and Recreation Areas |
| Plittersdorf | A quiet residential area known for its green spaces and local community. Offers a relaxed stay for couples and families. | Plittersdorf Park, Local cafes, Community festivals |
| Meckenheim West | A suburban region with family-friendly amenities and parks. Ideal for those wanting a peaceful environment close to the city. | Local Playgrounds, Family-friendly restaurants, Community Events |
Understanding Airbnb License Requirements & STR Laws in Meckenheim (2025)
While Meckenheim, North Rhine-Westphalia, Germany currently shows low STR regulations, specific Airbnb license requirements might still exist or change. Always verify the latest short term rental regulations and Airbnb license requirements directly with local government authorities for Meckenheim to ensure full compliance before hosting.
(Source: AirROI data, 2025, finding no licensed listings among those analyzed)
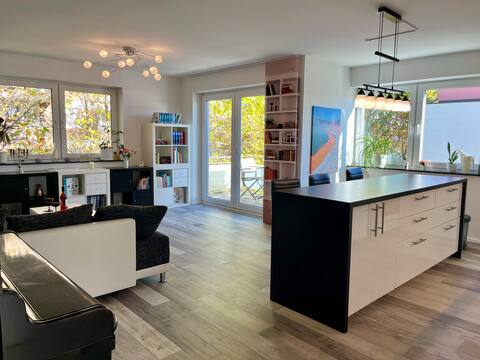
Top Performing Airbnb Properties in Meckenheim (2025)
Benchmark your potential! Explore examples of top-performing Airbnb properties in Meckenheimbased on Trailing Twelve Month (TTM) revenue. Analyze their characteristics, revenue, occupancy rate, and ADR to understand what drives success in this market.

Großzügige & geschmackvolle Unterkunft am Waldrand
Entire Place • 4 bedrooms

Haus Respirada Wellnessarea, Whirlpool, Gym, Sauna
Entire Place • 1 bedroom

Penthouse Apartment/ Studio
Entire Place • 1 bedroom
87qm - moderner Neubau mit Charme in Meckenheim
Entire Place • 2 bedrooms
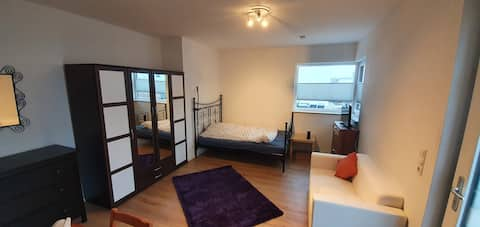
cosy, quiet apartment nearby Bf Meckenheim
Entire Place • N/A
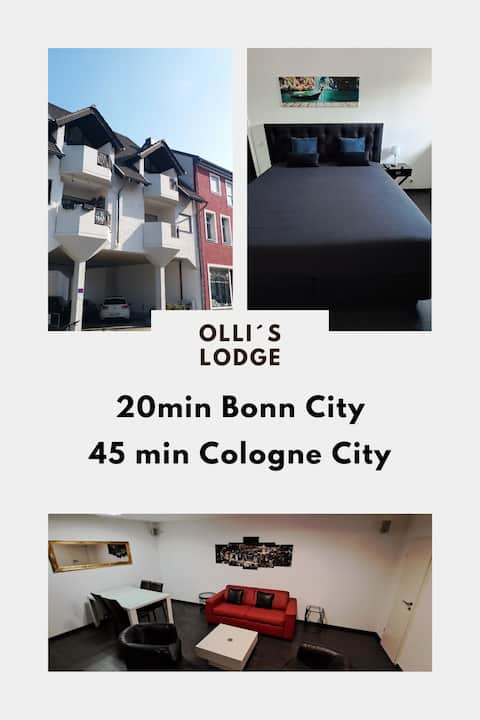
Ollis Lodge - 2 Room 70 sq Flat, 20 min to Bonn
Entire Place • N/A
Note: Performance varies based on location, size, amenities, seasonality, and management quality. Data reflects the past 12 months.
Top Performing Airbnb Hosts in Meckenheim (2025)
Learn from the best! This table showcases top-performing Airbnb hosts in Meckenheim based on the number of properties managed and estimated total revenue over the past year. Analyze their scale and performance metrics.
| Host Name | Properties | Grossing Revenue | Stay Reviews | Avg Rating |
|---|---|---|---|---|
| Tanja | 2 | $89,309 | 6 | 2.40/5.0 |
| Thimo | 1 | $38,152 | 233 | 4.85/5.0 |
| Andreas | 1 | $28,052 | 53 | 5.00/5.0 |
| Host #11046309 | 1 | $17,084 | 120 | 4.98/5.0 |
| Nabil | 1 | $16,475 | 110 | 4.97/5.0 |
| Oliver | 1 | $14,363 | 52 | 4.87/5.0 |
| Osman | 2 | $10,818 | 34 | 4.71/5.0 |
| Waltraud | 1 | $8,741 | 81 | 4.90/5.0 |
| Thomas | 1 | $6,197 | 69 | 4.83/5.0 |
| Martin | 2 | $6,082 | 21 | 4.82/5.0 |
Analyzing the strategies of top hosts, such as their property selection, pricing, and guest communication, can offer valuable lessons for optimizing your own Airbnb operations in Meckenheim.
Dive Deeper: Advanced Meckenheim STR Market Data (2025)
Ready to unlock more insights? AirROI provides access to advanced metrics and comprehensive Airbnb data for Meckenheim. Explore detailed analytics beyond this report to refine your investment strategy, optimize pricing, and maximize your vacation rental profits.
Explore Advanced MetricsMeckenheim Short-Term Rental Market Composition (2025): Property & Room Types
Room Type Distribution
Property Type Distribution
Market Composition Insights for Meckenheim
- The Meckenheim Airbnb market composition is heavily skewed towards Entire Home/Apt listings, which make up 83.3% of the 18 active rentals. This indicates strong guest preference for privacy and space.
- Looking at the property type distribution in Meckenheim, Apartment/Condo properties are the most common (83.3%), reflecting the local real estate landscape.
- Houses represent a significant 16.7% portion, catering likely to families or larger groups.
Meckenheim Airbnb Room Capacity Analysis (2025): Bedroom Distribution
Distribution of Listings by Number of Bedrooms
Room Capacity Insights for Meckenheim
- The dominant room capacity in Meckenheim is 1 bedroom listings, making up 55.6% of the market. This suggests a strong demand for properties suitable for couples or solo travelers.
- Together, 1 bedroom and 2 bedrooms properties represent 66.7% of the active Airbnb listings in Meckenheim, indicating a high concentration in these sizes.
- With over half the market (55.6%) consisting of studios or 1-bedroom units, Meckenheim is particularly well-suited for individuals or couples.
- Listings with 3+ bedrooms (5.6%) represent a smaller niche, potentially indicating an underserved market for larger group accommodations in Meckenheim.
Meckenheim Vacation Rental Guest Capacity Trends (2025)
Distribution of Listings by Guest Capacity
Guest Capacity Insights for Meckenheim
- The most common guest capacity trend in Meckenheim vacation rentals is listings accommodating 2 guests (38.9%). This suggests the primary traveler segment is likely couples or solo travelers.
- Properties designed for 2 guests and 4 guests dominate the Meckenheim STR market, accounting for 55.6% of listings.
- A significant 44.5% of listings cater specifically to 1-2 guests, highlighting strong demand from couples and solo travelers in Meckenheim.
- On average, properties in Meckenheim are equipped to host 2.6 guests.
Meckenheim Airbnb Booking Patterns (2025): Available vs. Booked Days
Available Days Distribution
Booked Days Distribution
Booking Pattern Insights for Meckenheim
- The most common availability pattern in Meckenheim falls within the 181-270 days range, representing 38.9% of listings. This suggests many properties have significant open periods on their calendars.
- Approximately 72.2% of listings show high availability (181+ days open annually), indicating potential for increased bookings or specific owner usage patterns.
- For booked days, the 91-180 days range is most frequent in Meckenheim (38.9%), reflecting common guest stay durations or potential owner blocking patterns.
- A notable 27.8% of properties secure long booking periods (181+ days booked per year), highlighting successful long-term rental strategies or significant owner usage.
Meckenheim Airbnb Minimum Stay Requirements Analysis
Distribution of Listings by Minimum Night Requirement
2 Nights
8 listings
50% of total
4-6 Nights
7 listings
43.8% of total
30+ Nights
1 listings
6.3% of total
Key Insights
- The most prevalent minimum stay requirement in Meckenheim is 2 Nights, adopted by 50% of listings. This highlights the market's preference for shorter, flexible bookings.
Recommendations
- Align with the market by considering a 2 Nights minimum stay, as 50% of Meckenheim hosts use this setting.
- A 2-night minimum appears standard (50%). Consider this for weekends or peak periods.
- Explore offering discounts for stays of 30+ nights to attract the 6.3% of the market seeking extended stays.
- Adjust minimum nights based on seasonality – potentially shorter during low season and longer during peak demand periods in Meckenheim.
Meckenheim Airbnb Cancellation Policy Trends Analysis (2025)
Flexible
5 listings
33.3% of total
Moderate
3 listings
20% of total
Firm
3 listings
20% of total
Strict
4 listings
26.7% of total
Cancellation Policy Insights for Meckenheim
- The prevailing Airbnb cancellation policy trend in Meckenheim is Flexible, used by 33.3% of listings.
- There's a relatively balanced mix between guest-friendly (53.3%) and stricter (46.7%) policies, offering choices for different guest needs.
Recommendations for Hosts
- Consider adopting a Flexible policy to align with the 33.3% market standard in Meckenheim.
- Regularly review your cancellation policy against competitors and market demand shifts in Meckenheim.
Meckenheim STR Booking Lead Time Analysis (2025)
Average Booking Lead Time by Month
Booking Lead Time Insights for Meckenheim
- The overall average booking lead time for vacation rentals in Meckenheim is 45 days.
- Guests book furthest in advance for stays during May (average 70 days), likely coinciding with peak travel demand or local events.
- The shortest booking windows occur for stays in January (average 39 days), indicating more last-minute travel plans during this time.
- Seasonally, Spring (57 days avg.) sees the longest lead times, while Winter (44 days avg.) has the shortest, reflecting typical travel planning cycles.
Recommendations for Hosts
- Use the overall average lead time (45 days) as a baseline for your pricing and availability strategy in Meckenheim.
- For May stays, consider implementing length-of-stay discounts or slightly higher rates for bookings made less than 70 days out to capitalize on advance planning.
- Target marketing efforts for the Spring season well in advance (at least 57 days) to capture early planners.
- Monitor your own booking lead times against these Meckenheim averages to identify opportunities for dynamic pricing adjustments.
Popular & Essential Airbnb Amenities in Meckenheim (2025)
Amenity Prevalence
Amenity Insights for Meckenheim
- Essential amenities in Meckenheim that guests expect include: Kitchen, Wifi. Lacking these (any) could significantly impact bookings.
- Popular amenities like Refrigerator, Dishes and silverware, Smoke alarm are common but not universal. Offering these can provide a competitive edge.
Recommendations for Hosts
- Ensure your listing includes all essential amenities for Meckenheim: Kitchen, Wifi.
- Consider adding popular differentiators like Refrigerator or Dishes and silverware to increase appeal.
- Highlight unique or less common amenities you offer (e.g., hot tub, dedicated workspace, EV charger) in your listing description and photos.
- Regularly check competitor amenities in Meckenheim to stay competitive.
Meckenheim Airbnb Guest Demographics & Profile Analysis (2025)
Guest Profile Summary for Meckenheim
- The typical guest profile for Airbnb in Meckenheim consists of primarily domestic travelers (76%), often arriving from nearby Cologne, typically belonging to the Post-2000s (Gen Z/Alpha) group (50%), primarily speaking English or German.
- Domestic travelers account for 76.1% of guests.
- Key international markets include Germany (76.1%) and Belgium (3.5%).
- Top languages spoken are English (39.5%) followed by German (34.9%).
- A significant demographic segment is the Post-2000s (Gen Z/Alpha) group, representing 50% of guests.
Recommendations for Hosts
- Target domestic marketing efforts towards travelers from Cologne and Berlin.
- Tailor amenities and listing descriptions to appeal to the dominant Post-2000s (Gen Z/Alpha) demographic (e.g., highlight fast WiFi, smart home features, local guides).
- Highlight unique local experiences or amenities relevant to the primary guest profile.
- Consider seasonal promotions aligned with peak travel times for key origin markets.
Nearby Short-Term Rental Market Comparison
How does the Meckenheim Airbnb market stack up against its neighbors? Compare key performance metrics like average monthly revenue, ADR, and occupancy rates in surrounding areas to understand the broader regional STR landscape.
| Market | Active Properties | Monthly Revenue | Daily Rate | Avg. Occupancy |
|---|---|---|---|---|
| Baarlo | 18 | $5,602 | $313.73 | 60% |
| Ondenval | 10 | $3,432 | $235.00 | 45% |
| Unkel | 17 | $3,064 | $231.22 | 42% |
| Büllingen | 27 | $3,028 | $267.82 | 39% |
| Kruft | 13 | $2,952 | $212.15 | 41% |
| Bütgenbach | 32 | $2,848 | $319.27 | 37% |
| Raeren | 15 | $2,747 | $179.33 | 47% |
| Malmedy | 181 | $2,708 | $282.85 | 37% |
| Runkel | 13 | $2,597 | $191.73 | 49% |
| Ralingen | 14 | $2,546 | $163.51 | 50% |