Kalkar Airbnb Market Analysis 2025: Short Term Rental Data & Vacation Rental Statistics in North Rhine-Westphalia, Germany
Is Airbnb profitable in Kalkar in 2025? Explore comprehensive Airbnb analytics for Kalkar, North Rhine-Westphalia, Germany to uncover income potential. This 2025 STR market report for Kalkar, based on AirROI data from June 2024 to May 2025, reveals key trends in the niche market of 19 active listings.
Whether you're considering an Airbnb investment in Kalkar, optimizing your existing vacation rental, or exploring rental arbitrage opportunities, understanding the Kalkar Airbnb data is crucial. Leveraging the low regulation environment is key to maximizing your short term rental income potential. Let's dive into the specifics.
Key Kalkar Airbnb Performance Metrics Overview
Monthly Airbnb Revenue Variations & Income Potential in Kalkar (2025)
Understanding the monthly revenue variations for Airbnb listings in Kalkar is key to maximizing your short term rental income potential. Seasonality significantly impacts earnings. Our analysis, based on data from the past 12 months, shows that the peak revenue month for STRs in Kalkar is typically July, while February often presents the lowest earnings, highlighting opportunities for strategic pricing adjustments during shoulder and low seasons. Explore the typical Airbnb income in Kalkar across different performance tiers:
- Best-in-class properties (Top 10%) achieve $2,134+ monthly, often utilizing dynamic pricing and superior guest experiences.
- Strong performing properties (Top 25%) earn $1,212 or more, indicating effective management and desirable locations/amenities.
- Typical properties (Median) generate around $822 per month, representing the average market performance.
- Entry-level properties (Bottom 25%) see earnings around $460, often with potential for optimization.
Average Monthly Airbnb Earnings Trend in Kalkar
Kalkar Airbnb Occupancy Rate Trends (2025)
Maximize your bookings by understanding the Kalkar STR occupancy trends. Seasonal demand shifts significantly influence how often properties are booked. Typically, Junesees the highest demand (peak season occupancy), while November experiences the lowest (low season). Effective strategies, like adjusting minimum stays or offering promotions, can boost occupancy during slower periods. Here's how different property tiers perform in Kalkar:
- Best-in-class properties (Top 10%) achieve 73%+ occupancy, indicating high desirability and potentially optimized availability.
- Strong performing properties (Top 25%) maintain 62% or higher occupancy, suggesting good market fit and guest satisfaction.
- Typical properties (Median) have an occupancy rate around 44%.
- Entry-level properties (Bottom 25%) average 22% occupancy, potentially facing higher vacancy.
Average Monthly Occupancy Rate Trend in Kalkar
Average Daily Rate (ADR) Airbnb Trends in Kalkar (2025)
Effective short term rental pricing strategy in Kalkar involves understanding monthly ADR fluctuations. The Average Daily Rate (ADR) for Airbnb in Kalkar typically peaks in May and dips lowest during November. Leveraging Airbnb dynamic pricing tools or strategies based on this seasonality can significantly boost revenue. Here's a look at the typical nightly rates achieved:
- Best-in-class properties (Top 10%) command rates of $200+ per night, often due to premium features or locations.
- Strong performing properties (Top 25%) achieve nightly rates of $111 or more.
- Typical properties (Median) charge around $77 per night.
- Entry-level properties (Bottom 25%) earn around $57 per night.
Average Daily Rate (ADR) Trend by Month in Kalkar
Get Live Kalkar Market Intelligence 👇

Explore Real-time Analytics
Airbnb Seasonality Analysis & Trends in Kalkar (2025)
Peak Season (July, June, August)
- Revenue averages $1,534 per month
- Occupancy rates average 64.0%
- Daily rates average $94
Shoulder Season
- Revenue averages $918 per month
- Occupancy maintains around 37.4%
- Daily rates hold near $109
Low Season (February, November, December)
- Revenue drops to average $637 per month
- Occupancy decreases to average 35.1%
- Daily rates adjust to average $100
Seasonality Insights for Kalkar
- The Airbnb seasonality in Kalkar shows highly seasonal trends requiring careful strategy. While the sections above show seasonal averages, it's also insightful to look at the extremes:
- During the high season, the absolute peak month showcases Kalkar's highest earning potential, with monthly revenues capable of climbing to $1,663, occupancy reaching a high of 69.1%, and ADRs peaking at $121.
- Conversely, the slowest single month of the year, typically falling within the low season, marks the market's lowest point. In this month, revenue might dip to $602, occupancy could drop to 30.8%, and ADRs may adjust down to $93.
- Understanding both the seasonal averages and these monthly peaks and troughs in revenue, occupancy, and ADR is crucial for maximizing your Airbnb profit potential in Kalkar.
Seasonal Strategies for Maximizing Profit
- Peak Season: Maximize revenue through premium pricing and potentially longer minimum stays. Ensure high availability.
- Low Season: Offer competitive pricing, special promotions (e.g., extended stay discounts), and flexible cancellation policies. Target off-season travelers like remote workers or budget-conscious guests.
- Shoulder Seasons: Implement dynamic pricing that balances peak and low rates. Target weekend travelers or specific events. Offer slightly more flexible terms than peak season.
- Regularly analyze your own performance against these Kalkar seasonality benchmarks and adjust your pricing and availability strategy accordingly.
Best Areas for Airbnb Investment in Kalkar (2025)
Exploring the top neighborhoods for short-term rentals in Kalkar? This section highlights key areas, outlining why they are attractive for hosts and guests, along with notable local attractions. Consider these locations based on your target guest profile and investment strategy.
| Neighborhood / Area | Why Host Here? (Target Guests & Appeal) | Key Attractions & Landmarks |
|---|---|---|
| Historic City Center | Kalkar's charming historic center features well-preserved medieval architecture, cobblestone streets, and quaint shops. It's a popular spot for visitors interested in history and culture. | St. Nicolai Church, Kalkar City Hall, The Kamper Tower, Museum der Niederrheinischen Kultur, Schloss Kalkar |
| Kalkar Am Niederrhein Airport | Proximity to the Niederrhein Airport makes this area ideal for hosting guests who are traveling for business or leisure across the region. Casual accommodations cater to visiting tourists. | Niederrhein Airport, Windsurfing on the Rhine, Local dining options |
| Rheinwiesen | The Rhine meadows offer beautiful landscapes and recreational opportunities. This area is perfect for hosting nature lovers and outdoor enthusiasts looking to explore the scenic surroundings of Kalkar. | Rhine River Trails, Picnic Areas, Nature Watching, Fishing Spots |
| Kalkar on the Rhine | The charming riverside area attracts tourists looking for picturesque views and leisurely walks along the Rhine. Ideal for those who enjoy riverside attractions and relaxation. | Rheinpark Kalkar, Kayaking on the Rhine, Local cafés and restaurants |
| Kalkar-Fürth | This serene residential area offers a peaceful environment and attracts visitors looking for tranquility while still being close to attractions in Kalkar. | Local parks, Traditional German architecture, Scenic cycling routes |
| Griethausen | Known for its picturesque village atmosphere, Griethausen provides a more rural retreat, appealing to guests looking to experience the local lifestyle and culture of the region. | Historic windmill, County fairs, Local festivals |
| Kalkar's Festivals | During summer, Kalkar hosts various festivals that attract visitors from afar. Hosting guests during these events can be a lucrative opportunity. | Kalkar Christmas Market, Kalkar Carnival, Summer Fairs, Local Music Festivals |
| Nearby Recreational Areas | The close proximity to amusement parks and recreational areas makes Kalkar a good spot for families and groups looking for fun activities during their stays. | Kernie's Familienpark, Amici Spielplatz, Local Adventure Parks |
Understanding Airbnb License Requirements & STR Laws in Kalkar (2025)
While Kalkar, North Rhine-Westphalia, Germany currently shows low STR regulations, specific Airbnb license requirements might still exist or change. Always verify the latest short term rental regulations and Airbnb license requirements directly with local government authorities for Kalkar to ensure full compliance before hosting.
(Source: AirROI data, 2025, based on 5% licensed listings)
Top Performing Airbnb Properties in Kalkar (2025)
Benchmark your potential! Explore examples of top-performing Airbnb properties in Kalkarbased on Trailing Twelve Month (TTM) revenue. Analyze their characteristics, revenue, occupancy rate, and ADR to understand what drives success in this market.

Holiday home Casa Markus - "Niederrhein pur"
Entire Place • 3 bedrooms
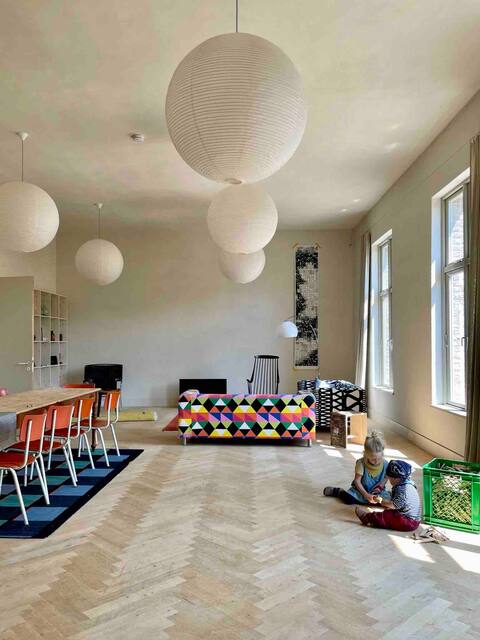
Kückstege1 Vintage Design in Historic School
Entire Place • 1 bedroom
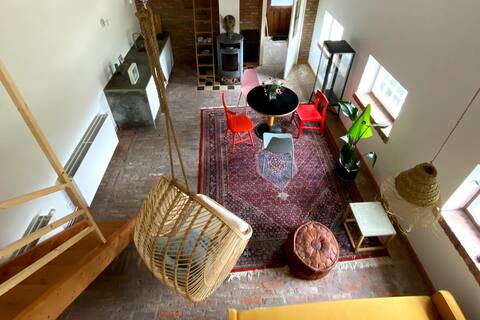
Cottage with Rhine view
Entire Place • 3 bedrooms
Wissel Tobacco Barn
Entire Place • 1 bedroom

Bed & Breakfast Schlosshotel Haus Grieth am Rhein
Private Room • 6 bedrooms

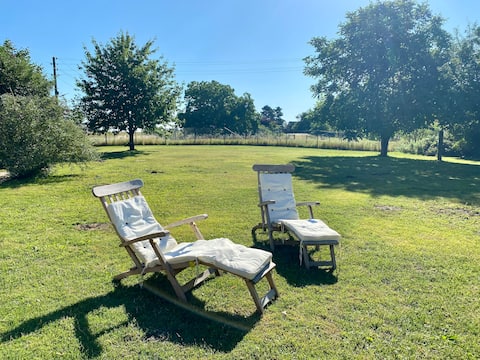
Wisseler oasis with sun deck
Entire Place • 2 bedrooms
Note: Performance varies based on location, size, amenities, seasonality, and management quality. Data reflects the past 12 months.
Top Performing Airbnb Hosts in Kalkar (2025)
Learn from the best! This table showcases top-performing Airbnb hosts in Kalkar based on the number of properties managed and estimated total revenue over the past year. Analyze their scale and performance metrics.
| Host Name | Properties | Grossing Revenue | Stay Reviews | Avg Rating |
|---|---|---|---|---|
| Paul & Simone | 4 | $23,354 | 258 | 4.78/5.0 |
| Manuela | 1 | $17,852 | 23 | 5.00/5.0 |
| Peter Bernhard | 1 | $16,628 | 46 | 4.98/5.0 |
| Silke | 1 | $16,445 | 16 | 4.88/5.0 |
| Mechthild | 2 | $15,845 | 154 | 4.89/5.0 |
| Carsten | 2 | $13,595 | 41 | 4.72/5.0 |
| Lena | 1 | $12,166 | 29 | 4.93/5.0 |
| Katja | 1 | $11,422 | 130 | 4.95/5.0 |
| Volkmar | 1 | $10,640 | 7 | 4.86/5.0 |
| Maria | 1 | $8,908 | 50 | 4.82/5.0 |
Analyzing the strategies of top hosts, such as their property selection, pricing, and guest communication, can offer valuable lessons for optimizing your own Airbnb operations in Kalkar.
Dive Deeper: Advanced Kalkar STR Market Data (2025)
Ready to unlock more insights? AirROI provides access to advanced metrics and comprehensive Airbnb data for Kalkar. Explore detailed analytics beyond this report to refine your investment strategy, optimize pricing, and maximize your vacation rental profits.
Explore Advanced MetricsKalkar Short-Term Rental Market Composition (2025): Property & Room Types
Room Type Distribution
Property Type Distribution
Market Composition Insights for Kalkar
- The Kalkar Airbnb market composition is heavily skewed towards Entire Home/Apt listings, which make up 68.4% of the 19 active rentals. This indicates strong guest preference for privacy and space.
- However, a notable 31.6% share for Private Rooms suggests opportunities for budget-conscious travelers or hosts renting out spare rooms.
- Looking at the property type distribution in Kalkar, Apartment/Condo properties are the most common (42.1%), reflecting the local real estate landscape.
- Houses represent a significant 26.3% portion, catering likely to families or larger groups.
- The presence of 5.3% Hotel/Boutique listings indicates integration with traditional hospitality.
Kalkar Airbnb Room Capacity Analysis (2025): Bedroom Distribution
Distribution of Listings by Number of Bedrooms
Room Capacity Insights for Kalkar
- The dominant room capacity in Kalkar is 3 bedrooms listings, making up 31.6% of the market. This suggests a strong demand for properties suitable for families or small groups.
- Together, 3 bedrooms and 1 bedroom properties represent 57.9% of the active Airbnb listings in Kalkar, indicating a high concentration in these sizes.
- A significant 42.1% of listings offer 3+ bedrooms, catering to larger groups and families seeking more space in Kalkar.
Kalkar Vacation Rental Guest Capacity Trends (2025)
Distribution of Listings by Guest Capacity
Guest Capacity Insights for Kalkar
- The most common guest capacity trend in Kalkar vacation rentals is listings accommodating 6 guests (21.1%). This suggests the primary traveler segment is likely larger groups.
- Properties designed for 6 guests and 4 guests dominate the Kalkar STR market, accounting for 36.9% of listings.
- 26.4% of properties accommodate 6+ guests, serving the market segment for larger families or group travel in Kalkar.
- On average, properties in Kalkar are equipped to host 3.5 guests.
Kalkar Airbnb Booking Patterns (2025): Available vs. Booked Days
Available Days Distribution
Booked Days Distribution
Booking Pattern Insights for Kalkar
- The most common availability pattern in Kalkar falls within the 181-270 days range, representing 57.9% of listings. This suggests many properties have significant open periods on their calendars.
- Approximately 84.2% of listings show high availability (181+ days open annually), indicating potential for increased bookings or specific owner usage patterns.
- For booked days, the 91-180 days range is most frequent in Kalkar (52.6%), reflecting common guest stay durations or potential owner blocking patterns.
- A notable 21.1% of properties secure long booking periods (181+ days booked per year), highlighting successful long-term rental strategies or significant owner usage.
Kalkar Airbnb Minimum Stay Requirements Analysis
Distribution of Listings by Minimum Night Requirement
1 Night
2 listings
11.1% of total
2 Nights
7 listings
38.9% of total
3 Nights
1 listings
5.6% of total
4-6 Nights
3 listings
16.7% of total
7-29 Nights
1 listings
5.6% of total
30+ Nights
4 listings
22.2% of total
Key Insights
- The most prevalent minimum stay requirement in Kalkar is 2 Nights, adopted by 38.9% of listings. This highlights the market's preference for shorter, flexible bookings.
- A significant segment (22.2%) caters to monthly stays (30+ nights) in Kalkar, pointing to opportunities in the extended-stay market.
Recommendations
- Align with the market by considering a 2 Nights minimum stay, as 38.9% of Kalkar hosts use this setting.
- If feasible, allowing 1-night stays, especially midweek or during low season, could capture last-minute bookings, as only 11.1% currently do.
- A 2-night minimum appears standard (38.9%). Consider this for weekends or peak periods.
- Explore offering discounts for stays of 30+ nights to attract the 22.2% of the market seeking extended stays.
- Adjust minimum nights based on seasonality – potentially shorter during low season and longer during peak demand periods in Kalkar.
Kalkar Airbnb Cancellation Policy Trends Analysis (2025)
Flexible
4 listings
25% of total
Moderate
8 listings
50% of total
Firm
1 listings
6.3% of total
Strict
3 listings
18.8% of total
Cancellation Policy Insights for Kalkar
- The prevailing Airbnb cancellation policy trend in Kalkar is Moderate, used by 50% of listings.
- The market strongly favors guest-friendly terms, with 75.0% of listings offering Flexible or Moderate policies. This suggests guests in Kalkar may expect booking flexibility.
Recommendations for Hosts
- Consider adopting a Moderate policy to align with the 50% market standard in Kalkar.
- Regularly review your cancellation policy against competitors and market demand shifts in Kalkar.
Kalkar STR Booking Lead Time Analysis (2025)
Average Booking Lead Time by Month
Booking Lead Time Insights for Kalkar
- The overall average booking lead time for vacation rentals in Kalkar is 67 days.
- Guests book furthest in advance for stays during May (average 82 days), likely coinciding with peak travel demand or local events.
- The shortest booking windows occur for stays in February (average 34 days), indicating more last-minute travel plans during this time.
- Seasonally, Fall (68 days avg.) sees the longest lead times, while Winter (58 days avg.) has the shortest, reflecting typical travel planning cycles.
Recommendations for Hosts
- Use the overall average lead time (67 days) as a baseline for your pricing and availability strategy in Kalkar.
- For May stays, consider implementing length-of-stay discounts or slightly higher rates for bookings made less than 82 days out to capitalize on advance planning.
- Target marketing efforts for the Fall season well in advance (at least 68 days) to capture early planners.
- Monitor your own booking lead times against these Kalkar averages to identify opportunities for dynamic pricing adjustments.
Popular & Essential Airbnb Amenities in Kalkar (2025)
Amenity Prevalence
Amenity Insights for Kalkar
- Essential amenities in Kalkar that guests expect include: Dishes and silverware, Heating, Wifi. Lacking these (any) could significantly impact bookings.
- Popular amenities like Hangers, Essentials, TV are common but not universal. Offering these can provide a competitive edge.
Recommendations for Hosts
- Ensure your listing includes all essential amenities for Kalkar: Dishes and silverware, Heating, Wifi.
- Consider adding popular differentiators like Hangers or Essentials to increase appeal.
- Highlight unique or less common amenities you offer (e.g., hot tub, dedicated workspace, EV charger) in your listing description and photos.
- Regularly check competitor amenities in Kalkar to stay competitive.
Kalkar Airbnb Guest Demographics & Profile Analysis (2025)
Guest Profile Summary for Kalkar
- The typical guest profile for Airbnb in Kalkar consists of a mix of domestic (52%) and international guests, often arriving from nearby Amsterdam, typically belonging to the Post-2000s (Gen Z/Alpha) group (50%), primarily speaking English or German.
- Domestic travelers account for 51.7% of guests.
- Key international markets include Germany (51.7%) and Netherlands (33.6%).
- Top languages spoken are English (38.3%) followed by German (26.8%).
- A significant demographic segment is the Post-2000s (Gen Z/Alpha) group, representing 50% of guests.
Recommendations for Hosts
- Balance marketing efforts between domestic and international channels based on the guest mix.
- Tailor amenities and listing descriptions to appeal to the dominant Post-2000s (Gen Z/Alpha) demographic (e.g., highlight fast WiFi, smart home features, local guides).
- Highlight unique local experiences or amenities relevant to the primary guest profile.
- Consider seasonal promotions aligned with peak travel times for key origin markets.
Nearby Short-Term Rental Market Comparison
How does the Kalkar Airbnb market stack up against its neighbors? Compare key performance metrics like average monthly revenue, ADR, and occupancy rates in surrounding areas to understand the broader regional STR landscape.
| Market | Active Properties | Monthly Revenue | Daily Rate | Avg. Occupancy |
|---|---|---|---|---|
| Losser | 11 | $5,393 | $1197.39 | 28% |
| Baarlo | 22 | $4,784 | $301.68 | 54% |
| Rijs | 27 | $3,541 | $371.20 | 45% |
| Aubel | 33 | $3,374 | $255.73 | 43% |
| Bertogne | 28 | $3,364 | $311.80 | 40% |
| Kruft | 13 | $3,340 | $229.39 | 41% |
| Heers | 24 | $3,210 | $319.49 | 36% |
| Kortenhoef | 16 | $3,165 | $261.00 | 53% |
| Samrée | 17 | $3,151 | $375.75 | 29% |
| Wellin | 13 | $3,077 | $218.09 | 42% |