Havelsee Airbnb Market Analysis 2025: Short Term Rental Data & Vacation Rental Statistics in Brandenburg, Germany
Is Airbnb profitable in Havelsee in 2025? Explore comprehensive Airbnb analytics for Havelsee, Brandenburg, Germany to uncover income potential. This 2025 STR market report for Havelsee, based on AirROI data from April 2024 to March 2025, reveals key trends in the niche market of 17 active listings.
Whether you're considering an Airbnb investment in Havelsee, optimizing your existing vacation rental, or exploring rental arbitrage opportunities, understanding the Havelsee Airbnb data is crucial. Leveraging the low regulation environment is key to maximizing your short term rental income potential. Let's dive into the specifics.
Key Havelsee Airbnb Performance Metrics Overview
Monthly Airbnb Revenue Variations & Income Potential in Havelsee (2025)
Understanding the monthly revenue variations for Airbnb listings in Havelsee is key to maximizing your short term rental income potential. Seasonality significantly impacts earnings. Our analysis, based on data from the past 12 months, shows that the peak revenue month for STRs in Havelsee is typically August, while January often presents the lowest earnings, highlighting opportunities for strategic pricing adjustments during shoulder and low seasons. Explore the typical Airbnb income in Havelsee across different performance tiers:
- Best-in-class properties (Top 10%) achieve $2,862+ monthly, often utilizing dynamic pricing and superior guest experiences.
- Strong performing properties (Top 25%) earn $1,908 or more, indicating effective management and desirable locations/amenities.
- Typical properties (Median) generate around $1,081 per month, representing the average market performance.
- Entry-level properties (Bottom 25%) see earnings around $632, often with potential for optimization.
Average Monthly Airbnb Earnings Trend in Havelsee
Havelsee Airbnb Occupancy Rate Trends (2025)
Maximize your bookings by understanding the Havelsee STR occupancy trends. Seasonal demand shifts significantly influence how often properties are booked. Typically, Julysees the highest demand (peak season occupancy), while January experiences the lowest (low season). Effective strategies, like adjusting minimum stays or offering promotions, can boost occupancy during slower periods. Here's how different property tiers perform in Havelsee:
- Best-in-class properties (Top 10%) achieve 67%+ occupancy, indicating high desirability and potentially optimized availability.
- Strong performing properties (Top 25%) maintain 48% or higher occupancy, suggesting good market fit and guest satisfaction.
- Typical properties (Median) have an occupancy rate around 23%.
- Entry-level properties (Bottom 25%) average 13% occupancy, potentially facing higher vacancy.
Average Monthly Occupancy Rate Trend in Havelsee
Average Daily Rate (ADR) Airbnb Trends in Havelsee (2025)
Effective short term rental pricing strategy in Havelsee involves understanding monthly ADR fluctuations. The Average Daily Rate (ADR) for Airbnb in Havelsee typically peaks in July and dips lowest during March. Leveraging Airbnb dynamic pricing tools or strategies based on this seasonality can significantly boost revenue. Here's a look at the typical nightly rates achieved:
- Best-in-class properties (Top 10%) command rates of $437+ per night, often due to premium features or locations.
- Strong performing properties (Top 25%) achieve nightly rates of $193 or more.
- Typical properties (Median) charge around $140 per night.
- Entry-level properties (Bottom 25%) earn around $89 per night.
Average Daily Rate (ADR) Trend by Month in Havelsee
Get Live Havelsee Market Intelligence 👇

Explore Real-time Analytics
Airbnb Seasonality Analysis & Trends in Havelsee (2025)
Peak Season (August, July, September)
- Revenue averages $2,356 per month
- Occupancy rates average 46.0%
- Daily rates average $219
Shoulder Season
- Revenue averages $1,452 per month
- Occupancy maintains around 33.5%
- Daily rates hold near $177
Low Season (January, April, December)
- Revenue drops to average $644 per month
- Occupancy decreases to average 17.9%
- Daily rates adjust to average $162
Seasonality Insights for Havelsee
- The Airbnb seasonality in Havelsee shows highly seasonal trends requiring careful strategy. While the sections above show seasonal averages, it's also insightful to look at the extremes:
- During the high season, the absolute peak month showcases Havelsee's highest earning potential, with monthly revenues capable of climbing to $2,580, occupancy reaching a high of 51.1%, and ADRs peaking at $222.
- Conversely, the slowest single month of the year, typically falling within the low season, marks the market's lowest point. In this month, revenue might dip to $440, occupancy could drop to 12.9%, and ADRs may adjust down to $132.
- Understanding both the seasonal averages and these monthly peaks and troughs in revenue, occupancy, and ADR is crucial for maximizing your Airbnb profit potential in Havelsee.
Seasonal Strategies for Maximizing Profit
- Peak Season: Maximize revenue through premium pricing and potentially longer minimum stays. Ensure high availability.
- Low Season: Offer competitive pricing, special promotions (e.g., extended stay discounts), and flexible cancellation policies. Target off-season travelers like remote workers or budget-conscious guests.
- Shoulder Seasons: Implement dynamic pricing that balances peak and low rates. Target weekend travelers or specific events. Offer slightly more flexible terms than peak season.
- Regularly analyze your own performance against these Havelsee seasonality benchmarks and adjust your pricing and availability strategy accordingly.
Best Areas for Airbnb Investment in Havelsee (2025)
Exploring the top neighborhoods for short-term rentals in Havelsee? This section highlights key areas, outlining why they are attractive for hosts and guests, along with notable local attractions. Consider these locations based on your target guest profile and investment strategy.
| Neighborhood / Area | Why Host Here? (Target Guests & Appeal) | Key Attractions & Landmarks |
|---|---|---|
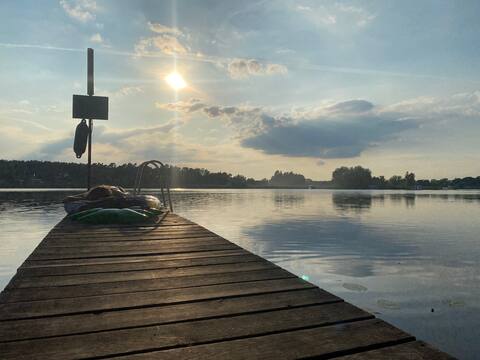
| Havelsee Lake | A scenic destination known for its beautiful lake views, making it ideal for nature lovers and those looking for peaceful retreats. Attracts guests seeking relaxation and outdoor activities such as hiking and boating. | Havelsee Lake, Walking and cycling paths, Fishing spots, Picnic areas |
| Dreetz | A charming village near Havelsee with historical buildings and rich local culture. It offers a quintessential German countryside experience, perfect for families and peaceful getaways. | Dreetz Church, Local museums, Historical architecture, Quiet village life |
| Kräfnitz | A small locality surrounded by nature, providing guests with a tranquil escape from city life. Ideal for those looking for nature walks, cycling, and birdwatching. | Nature reserves, Hiking trails, Birdwatching opportunities |
| Bantikow | Close to Havelsee and offering a small-town feel with access to larger cities, perfect for families visiting the surrounding area. Provides cultural and historical experiences. | Local parks, Cultural events, Access to nearby towns |
| Leninplatz (Neuruppin) | A bustling area that serves as a gateway for visitors to the historical sites of Neuruppin. Ideal for guests interested in history and local culture. | Neuruppin Museum, Historic old town, Café culture |
| Fehrbellin | A historical town with many walking paths, lakes, and opportunities for outdoor activities. A peaceful location that attracts nature enthusiasts. | Historic landmarks, Lake walking paths, Nature parks |
| Rheinsberg | Known for the beautiful Rheinsberg Palace and its picturesque surroundings. This area draws guests interested in history and idyllic settings. | Rheinsberg Palace, Parks and gardens, Cultural events |
| Menzel Grabow | A peaceful area perfect for those looking to escape the noise of the city. It offers rustic charm, suitable for families and outdoor enthusiasts. | Country walks, Local farms, Rustic landscapes |
Understanding Airbnb License Requirements & STR Laws in Havelsee (2025)
While Havelsee, Brandenburg, Germany currently shows low STR regulations, specific Airbnb license requirements might still exist or change. Always verify the latest short term rental regulations and Airbnb license requirements directly with local government authorities for Havelsee to ensure full compliance before hosting.
(Source: AirROI data, 2025, finding no licensed listings among those analyzed)
Top Performing Airbnb Properties in Havelsee (2025)
Benchmark your potential! Explore examples of top-performing Airbnb properties in Havelseebased on Trailing Twelve Month (TTM) revenue. Analyze their characteristics, revenue, occupancy rate, and ADR to understand what drives success in this market.
Cozy Miniature FARM HOUSE amidst the lakes
Entire Place • 2 bedrooms
Gorgeous ship in Havelsee OT Kützkow with kitchen
Entire Place • 1 bedroom
Holiday home "Fährblick"
Entire Place • 1 bedroom

Beautiful bungalow right on the water with your own jetty
Entire Place • 1 bedroom
Holiday complex Pritzerbe - Kormoran **** Behindger.
Entire Place • 2 bedrooms
2 bedroom beach front ship in Havelsee OT Kützkow
Entire Place • 2 bedrooms
Note: Performance varies based on location, size, amenities, seasonality, and management quality. Data reflects the past 12 months.
Top Performing Airbnb Hosts in Havelsee (2025)
Learn from the best! This table showcases top-performing Airbnb hosts in Havelsee based on the number of properties managed and estimated total revenue over the past year. Analyze their scale and performance metrics.
| Host Name | Properties | Grossing Revenue | Stay Reviews | Avg Rating |
|---|---|---|---|---|
| X | 1 | $21,828 | 135 | 4.68/5.0 |
| Ferienanlage | 3 | $21,571 | 19 | 4.95/5.0 |
| Host #141538745 | 1 | $19,295 | 1 | 0.00/5.0 |
| Florian | 1 | $19,228 | 137 | 4.91/5.0 |
| Sebastian | 1 | $11,192 | 14 | 4.86/5.0 |
| Frank | 2 | $10,944 | 42 | 4.79/5.0 |
| Host #143470076 | 1 | $10,866 | 0 | 0.00/5.0 |
| Tim | 1 | $5,201 | 24 | 4.92/5.0 |
| Peter | 1 | $4,246 | 5 | 5.00/5.0 |
| Host #500636 | 1 | $4,194 | 0 | 0.00/5.0 |
Analyzing the strategies of top hosts, such as their property selection, pricing, and guest communication, can offer valuable lessons for optimizing your own Airbnb operations in Havelsee.
Dive Deeper: Advanced Havelsee STR Market Data (2025)
Ready to unlock more insights? AirROI provides access to advanced metrics and comprehensive Airbnb data for Havelsee. Explore detailed analytics beyond this report to refine your investment strategy, optimize pricing, and maximize your vacation rental profits.
Explore Advanced MetricsHavelsee Short-Term Rental Market Composition (2025): Property & Room Types
Room Type Distribution
Property Type Distribution
Market Composition Insights for Havelsee
- The Havelsee Airbnb market composition is heavily skewed towards Entire Home/Apt listings, which make up 100% of the 17 active rentals. This indicates strong guest preference for privacy and space.
- Looking at the property type distribution in Havelsee, Outdoor/Unique properties are the most common (47.1%), reflecting the local real estate landscape.
- The presence of 11.8% Hotel/Boutique listings indicates integration with traditional hospitality.
Havelsee Airbnb Room Capacity Analysis (2025): Bedroom Distribution
Distribution of Listings by Number of Bedrooms
Room Capacity Insights for Havelsee
- The dominant room capacity in Havelsee is 1 bedroom listings, making up 70.6% of the market. This suggests a strong demand for properties suitable for couples or solo travelers.
- Together, 1 bedroom and 2 bedrooms properties represent 100.0% of the active Airbnb listings in Havelsee, indicating a high concentration in these sizes.
- With over half the market (70.6%) consisting of studios or 1-bedroom units, Havelsee is particularly well-suited for individuals or couples.
Havelsee Vacation Rental Guest Capacity Trends (2025)
Distribution of Listings by Guest Capacity
Guest Capacity Insights for Havelsee
- The most common guest capacity trend in Havelsee vacation rentals is listings accommodating 2 guests (47.1%). This suggests the primary traveler segment is likely couples or solo travelers.
- Properties designed for 2 guests and 4 guests dominate the Havelsee STR market, accounting for 76.5% of listings.
- A significant 47.1% of listings cater specifically to 1-2 guests, highlighting strong demand from couples and solo travelers in Havelsee.
- 11.8% of properties accommodate 6+ guests, serving the market segment for larger families or group travel in Havelsee.
- On average, properties in Havelsee are equipped to host 3.4 guests.
Havelsee Airbnb Booking Patterns (2025): Available vs. Booked Days
Available Days Distribution
Booked Days Distribution
Booking Pattern Insights for Havelsee
- The most common availability pattern in Havelsee falls within the 271-366 days range, representing 70.6% of listings. This suggests many properties have significant open periods on their calendars.
- Approximately 94.1% of listings show high availability (181+ days open annually), indicating potential for increased bookings or specific owner usage patterns.
- For booked days, the 1-30 days range is most frequent in Havelsee (35.3%), reflecting common guest stay durations or potential owner blocking patterns.
- A notable 5.9% of properties secure long booking periods (181+ days booked per year), highlighting successful long-term rental strategies or significant owner usage.
Havelsee Airbnb Minimum Stay Requirements Analysis
Distribution of Listings by Minimum Night Requirement
1 Night
8 listings
50% of total
2 Nights
5 listings
31.3% of total
3 Nights
1 listings
6.3% of total
4-6 Nights
2 listings
12.5% of total
Key Insights
- The most prevalent minimum stay requirement in Havelsee is 1 Night, adopted by 50% of listings. This highlights the market's preference for shorter, flexible bookings.
- A strong majority (81.3%) of the Havelsee Airbnb data shows acceptance of very short stays (1-2 nights), indicating a dynamic, high-turnover market.
Recommendations
- Align with the market by considering a 1 Night minimum stay, as 50% of Havelsee hosts use this setting.
- Adjust minimum nights based on seasonality – potentially shorter during low season and longer during peak demand periods in Havelsee.
Havelsee Airbnb Cancellation Policy Trends Analysis (2025)
Flexible
2 listings
18.2% of total
Moderate
3 listings
27.3% of total
Firm
2 listings
18.2% of total
Strict
4 listings
36.4% of total
Cancellation Policy Insights for Havelsee
- The prevailing Airbnb cancellation policy trend in Havelsee is Strict, used by 36.4% of listings.
- A majority (54.6%) of hosts in Havelsee utilize Firm or Strict policies, indicating a market where hosts prioritize booking security.
Recommendations for Hosts
- Consider adopting a Strict policy to align with the 36.4% market standard in Havelsee.
- With 36.4% using Strict terms, this is a viable option in Havelsee, particularly for high-value properties or during peak demand periods.
- Regularly review your cancellation policy against competitors and market demand shifts in Havelsee.
Havelsee STR Booking Lead Time Analysis (2025)
Average Booking Lead Time by Month
Booking Lead Time Insights for Havelsee
- The overall average booking lead time for vacation rentals in Havelsee is 83 days.
- Guests book furthest in advance for stays during May (average 136 days), likely coinciding with peak travel demand or local events.
- The shortest booking windows occur for stays in February (average 20 days), indicating more last-minute travel plans during this time.
- Seasonally, Summer (109 days avg.) sees the longest lead times, while Winter (37 days avg.) has the shortest, reflecting typical travel planning cycles.
Recommendations for Hosts
- Use the overall average lead time (83 days) as a baseline for your pricing and availability strategy in Havelsee.
- For May stays, consider implementing length-of-stay discounts or slightly higher rates for bookings made less than 136 days out to capitalize on advance planning.
- Target marketing efforts for the Summer season well in advance (at least 109 days) to capture early planners.
- Monitor your own booking lead times against these Havelsee averages to identify opportunities for dynamic pricing adjustments.
Popular & Essential Airbnb Amenities in Havelsee (2025)
Amenity Prevalence
Amenity Insights for Havelsee
- Popular amenities like Dishes and silverware, Refrigerator, Smoke alarm are common but not universal. Offering these can provide a competitive edge.
- Warning: Wifi is not universally provided but is considered essential globally. Ensure reliable Wifi is offered.
Recommendations for Hosts
- Consider adding popular differentiators like Dishes and silverware or Refrigerator to increase appeal.
- Highlight unique or less common amenities you offer (e.g., hot tub, dedicated workspace, EV charger) in your listing description and photos.
- Regularly check competitor amenities in Havelsee to stay competitive.
Havelsee Airbnb Guest Demographics & Profile Analysis (2025)
Guest Profile Summary for Havelsee
- The typical guest profile for Airbnb in Havelsee consists of primarily domestic travelers (89%), often arriving from nearby Berlin, typically belonging to the Post-2000s (Gen Z/Alpha) group (50%), primarily speaking German or English.
- Domestic travelers account for 88.5% of guests.
- Key international markets include Germany (88.5%) and United Kingdom (1.9%).
- Top languages spoken are German (41.2%) followed by English (35.3%).
- A significant demographic segment is the Post-2000s (Gen Z/Alpha) group, representing 50% of guests.
Recommendations for Hosts
- Target domestic marketing efforts towards travelers from Berlin and Hamburg.
- Tailor amenities and listing descriptions to appeal to the dominant Post-2000s (Gen Z/Alpha) demographic (e.g., highlight fast WiFi, smart home features, local guides).
- Highlight unique local experiences or amenities relevant to the primary guest profile.
- Consider seasonal promotions aligned with peak travel times for key origin markets.
Nearby Short-Term Rental Market Comparison
How does the Havelsee Airbnb market stack up against its neighbors? Compare key performance metrics like average monthly revenue, ADR, and occupancy rates in surrounding areas to understand the broader regional STR landscape.
| Market | Active Properties | Monthly Revenue | Daily Rate | Avg. Occupancy |
|---|---|---|---|---|
| Gallin-Kuppentin | 12 | $3,284 | $379.74 | 33% |
| Rüdersdorf bei Berlin | 10 | $2,385 | $174.64 | 53% |
| Neuenhagen bei Berlin | 12 | $2,364 | $167.43 | 58% |
| Damshagen | 12 | $2,333 | $393.51 | 35% |
| Berlin | 6,086 | $2,181 | $161.30 | 52% |
| Fürsterwerder | 10 | $2,058 | $280.41 | 35% |
| Heiligengrabe | 14 | $2,019 | $201.01 | 41% |
| Gerswalde | 28 | $1,995 | $164.93 | 43% |
| Biesenthal | 12 | $1,950 | $192.91 | 46% |
| Wusterhausen/Dosse | 11 | $1,894 | $163.30 | 40% |