Talheim Airbnb Market Analysis 2025: Short Term Rental Data & Vacation Rental Statistics in Baden-Württemberg, Germany
Is Airbnb profitable in Talheim in 2025? Explore comprehensive Airbnb analytics for Talheim, Baden-Württemberg, Germany to uncover income potential. This 2025 STR market report for Talheim, based on AirROI data from June 2024 to May 2025, reveals key trends in the niche market of 19 active listings.
Whether you're considering an Airbnb investment in Talheim, optimizing your existing vacation rental, or exploring rental arbitrage opportunities, understanding the Talheim Airbnb data is crucial. Leveraging the low regulation environment is key to maximizing your short term rental income potential. Let's dive into the specifics.
Key Talheim Airbnb Performance Metrics Overview
Monthly Airbnb Revenue Variations & Income Potential in Talheim (2025)
Understanding the monthly revenue variations for Airbnb listings in Talheim is key to maximizing your short term rental income potential. Seasonality significantly impacts earnings. Our analysis, based on data from the past 12 months, shows that the peak revenue month for STRs in Talheim is typically January, while June often presents the lowest earnings, highlighting opportunities for strategic pricing adjustments during shoulder and low seasons. Explore the typical Airbnb income in Talheim across different performance tiers:
- Best-in-class properties (Top 10%) achieve $3,048+ monthly, often utilizing dynamic pricing and superior guest experiences.
- Strong performing properties (Top 25%) earn $1,248 or more, indicating effective management and desirable locations/amenities.
- Typical properties (Median) generate around $806 per month, representing the average market performance.
- Entry-level properties (Bottom 25%) see earnings around $467, often with potential for optimization.
Average Monthly Airbnb Earnings Trend in Talheim
Talheim Airbnb Occupancy Rate Trends (2025)
Maximize your bookings by understanding the Talheim STR occupancy trends. Seasonal demand shifts significantly influence how often properties are booked. Typically, Maysees the highest demand (peak season occupancy), while June experiences the lowest (low season). Effective strategies, like adjusting minimum stays or offering promotions, can boost occupancy during slower periods. Here's how different property tiers perform in Talheim:
- Best-in-class properties (Top 10%) achieve 77%+ occupancy, indicating high desirability and potentially optimized availability.
- Strong performing properties (Top 25%) maintain 56% or higher occupancy, suggesting good market fit and guest satisfaction.
- Typical properties (Median) have an occupancy rate around 37%.
- Entry-level properties (Bottom 25%) average 23% occupancy, potentially facing higher vacancy.
Average Monthly Occupancy Rate Trend in Talheim
Average Daily Rate (ADR) Airbnb Trends in Talheim (2025)
Effective short term rental pricing strategy in Talheim involves understanding monthly ADR fluctuations. The Average Daily Rate (ADR) for Airbnb in Talheim typically peaks in January and dips lowest during September. Leveraging Airbnb dynamic pricing tools or strategies based on this seasonality can significantly boost revenue. Here's a look at the typical nightly rates achieved:
- Best-in-class properties (Top 10%) command rates of $122+ per night, often due to premium features or locations.
- Strong performing properties (Top 25%) achieve nightly rates of $95 or more.
- Typical properties (Median) charge around $73 per night.
- Entry-level properties (Bottom 25%) earn around $53 per night.
Average Daily Rate (ADR) Trend by Month in Talheim
Get Live Talheim Market Intelligence 👇

Explore Real-time Analytics
Airbnb Seasonality Analysis & Trends in Talheim (2025)
Peak Season (January, February, May)
- Revenue averages $1,509 per month
- Occupancy rates average 47.3%
- Daily rates average $90
Shoulder Season
- Revenue averages $1,221 per month
- Occupancy maintains around 46.2%
- Daily rates hold near $81
Low Season (June, October, November)
- Revenue drops to average $614 per month
- Occupancy decreases to average 27.8%
- Daily rates adjust to average $81
Seasonality Insights for Talheim
- The Airbnb seasonality in Talheim shows highly seasonal trends requiring careful strategy. While the sections above show seasonal averages, it's also insightful to look at the extremes:
- During the high season, the absolute peak month showcases Talheim's highest earning potential, with monthly revenues capable of climbing to $1,593, occupancy reaching a high of 60.2%, and ADRs peaking at $92.
- Conversely, the slowest single month of the year, typically falling within the low season, marks the market's lowest point. In this month, revenue might dip to $353, occupancy could drop to 15.0%, and ADRs may adjust down to $76.
- Understanding both the seasonal averages and these monthly peaks and troughs in revenue, occupancy, and ADR is crucial for maximizing your Airbnb profit potential in Talheim.
Seasonal Strategies for Maximizing Profit
- Peak Season: Maximize revenue through premium pricing and potentially longer minimum stays. Ensure high availability.
- Low Season: Offer competitive pricing, special promotions (e.g., extended stay discounts), and flexible cancellation policies. Target off-season travelers like remote workers or budget-conscious guests.
- Shoulder Seasons: Implement dynamic pricing that balances peak and low rates. Target weekend travelers or specific events. Offer slightly more flexible terms than peak season.
- Regularly analyze your own performance against these Talheim seasonality benchmarks and adjust your pricing and availability strategy accordingly.
Best Areas for Airbnb Investment in Talheim (2025)
Exploring the top neighborhoods for short-term rentals in Talheim? This section highlights key areas, outlining why they are attractive for hosts and guests, along with notable local attractions. Consider these locations based on your target guest profile and investment strategy.
| Neighborhood / Area | Why Host Here? (Target Guests & Appeal) | Key Attractions & Landmarks |
|---|---|---|
| Talheim Village Center | Charming village atmosphere with local shops and restaurants, ideal for guests seeking a tranquil retreat while still being close to nearby larger towns. | St. Killian's Church, Local bakeries and cafes, Talheim vineyards, Scenic walking trails, Community events |
| Heidelberg Nearby | Historic city known for its romantic scenery, universities, and rich culture. A perfect destination for tourists and academics visiting the area. | Heidelberg Castle, Philosopher's Walk, Old Town (Altstadt), Heidelberg University, Neckar River cruises |
| Ludwigshafen | A growing urban area with significant business and cultural opportunities, great for professionals traveling for work-related purposes. | Ludwigshafen City Park, Chemical Industry Museum, Shopping Malls, Rhein River promenade, Cultural Festivals |
| Walldorf | Known for its significant business community, including SAP headquarters, it attracts corporate travelers and long-term guests. | SAP headquarters, Walldorf Village Museum, Local dining experiences, Parks and recreational areas |
| Mannheim | Major urban center with vibrant cultural scene and proximity to the Rhine River, appealing to a variety of tourists and business travelers alike. | Luisenpark, Mannheim Palace, Reiss-Engelhorn Museums, Water Tower, Cultural events and festivals |
| Bensheim | A quaint town nestled on the edge of the Odenwald, known for its beautiful landscapes and vineyards perfect for wine enthusiasts. | Bensheim Castle, Vineyard tours, Old Town Center, Hiking trails in Odenwald |
| Heppenheim | An enchanting medieval town known for its half-timbered houses and the Bergstraße wine region. Perfect for picturesque getaways. | Heppenheim Old Town, St. Peter's Church, Vineyards and wine festivals, Bergstraße hiking trails |
| Sinsheim | Home to unique attractions like the Sinsheim Auto & Technik Museum, it caters to a variety of interests, from technology to history. | Sinsheim Auto & Technik Museum, Welt der Technik, Sinsheim Medieval Market, Local dining and shops |
Understanding Airbnb License Requirements & STR Laws in Talheim (2025)
While Talheim, Baden-Württemberg, Germany currently shows low STR regulations, specific Airbnb license requirements might still exist or change. Always verify the latest short term rental regulations and Airbnb license requirements directly with local government authorities for Talheim to ensure full compliance before hosting.
(Source: AirROI data, 2025, finding no licensed listings among those analyzed)
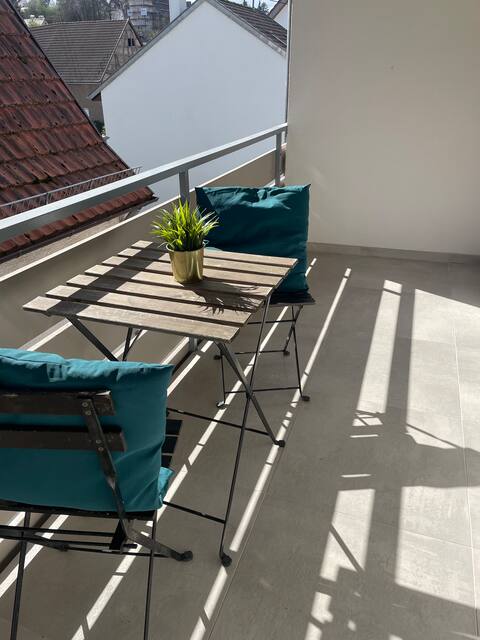
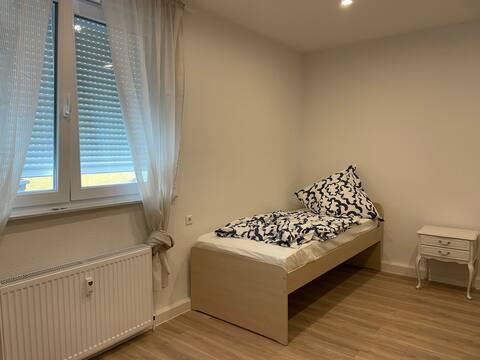
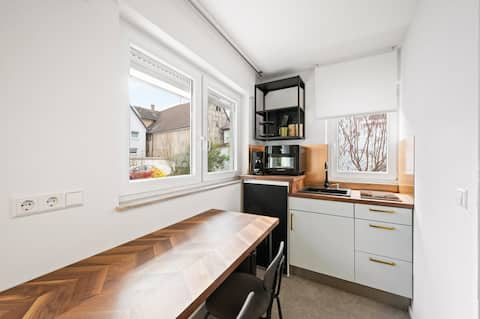
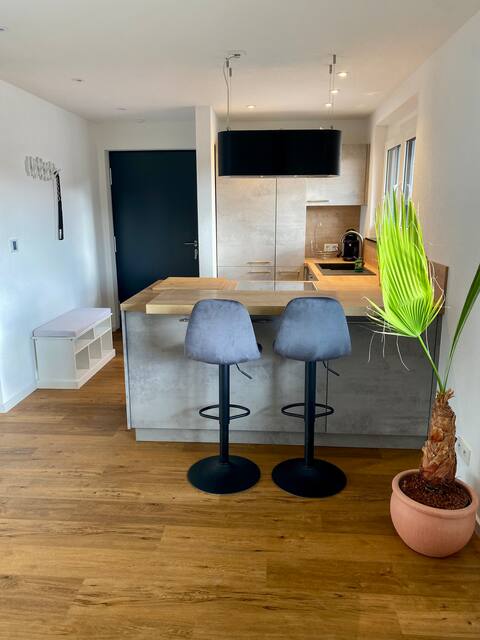
Top Performing Airbnb Properties in Talheim (2025)
Benchmark your potential! Explore examples of top-performing Airbnb properties in Talheimbased on Trailing Twelve Month (TTM) revenue. Analyze their characteristics, revenue, occupancy rate, and ADR to understand what drives success in this market.
Spacious 4-room apartment for up to 8 people
Entire Place • 4 bedrooms
Wunderschöne Erdgeschosswohnung
Entire Place • 1 bedroom
Beautiful 1 room apartment ground floor
Entire Place • 1 bedroom

Family rooms in Talheim
Entire Place • 1 bedroom
Lupfen inland apartment
Entire Place • 1 bedroom
Cozy apartment for up to 4 people
Entire Place • 1 bedroom
Note: Performance varies based on location, size, amenities, seasonality, and management quality. Data reflects the past 12 months.
Top Performing Airbnb Hosts in Talheim (2025)
Learn from the best! This table showcases top-performing Airbnb hosts in Talheim based on the number of properties managed and estimated total revenue over the past year. Analyze their scale and performance metrics.
| Host Name | Properties | Grossing Revenue | Stay Reviews | Avg Rating |
|---|---|---|---|---|
| Nadine & Zeki | 7 | $79,755 | 71 | 4.74/5.0 |
| Vass | 3 | $37,623 | 63 | 4.26/5.0 |
| Sabrina | 1 | $8,686 | 30 | 4.93/5.0 |
| Ute | 1 | $7,140 | 20 | 5.00/5.0 |
| Host #401981138 | 1 | $6,869 | 0 | N/A/5.0 |
| Sven | 2 | $4,403 | 3 | N/A/5.0 |
| Louisa | 1 | $4,227 | 12 | 4.67/5.0 |
| Friederike | 1 | $3,656 | 89 | 4.96/5.0 |
| Host #238028559 | 1 | $3,423 | 0 | N/A/5.0 |
| Remzi | 1 | $1,649 | 4 | 5.00/5.0 |
Analyzing the strategies of top hosts, such as their property selection, pricing, and guest communication, can offer valuable lessons for optimizing your own Airbnb operations in Talheim.
Dive Deeper: Advanced Talheim STR Market Data (2025)
Ready to unlock more insights? AirROI provides access to advanced metrics and comprehensive Airbnb data for Talheim. Explore detailed analytics beyond this report to refine your investment strategy, optimize pricing, and maximize your vacation rental profits.
Explore Advanced MetricsTalheim Short-Term Rental Market Composition (2025): Property & Room Types
Room Type Distribution
Property Type Distribution
Market Composition Insights for Talheim
- The Talheim Airbnb market composition is heavily skewed towards Entire Home/Apt listings, which make up 73.7% of the 19 active rentals. This indicates strong guest preference for privacy and space.
- Looking at the property type distribution in Talheim, Apartment/Condo properties are the most common (94.7%), reflecting the local real estate landscape.
Talheim Airbnb Room Capacity Analysis (2025): Bedroom Distribution
Distribution of Listings by Number of Bedrooms
Room Capacity Insights for Talheim
- The dominant room capacity in Talheim is 1 bedroom listings, making up 84.2% of the market. This suggests a strong demand for properties suitable for couples or solo travelers.
- Together, 1 bedroom and 3 bedrooms properties represent 89.5% of the active Airbnb listings in Talheim, indicating a high concentration in these sizes.
- With over half the market (84.2%) consisting of studios or 1-bedroom units, Talheim is particularly well-suited for individuals or couples.
Talheim Vacation Rental Guest Capacity Trends (2025)
Distribution of Listings by Guest Capacity
Guest Capacity Insights for Talheim
- The most common guest capacity trend in Talheim vacation rentals is listings accommodating 2 guests (47.4%). This suggests the primary traveler segment is likely couples or solo travelers.
- Properties designed for 2 guests and 1 guest dominate the Talheim STR market, accounting for 63.2% of listings.
- A significant 63.2% of listings cater specifically to 1-2 guests, highlighting strong demand from couples and solo travelers in Talheim.
- 10.6% of properties accommodate 6+ guests, serving the market segment for larger families or group travel in Talheim.
- On average, properties in Talheim are equipped to host 2.6 guests.
Talheim Airbnb Booking Patterns (2025): Available vs. Booked Days
Available Days Distribution
Booked Days Distribution
Booking Pattern Insights for Talheim
- The most common availability pattern in Talheim falls within the 271-366 days range, representing 63.2% of listings. This suggests many properties have significant open periods on their calendars.
- Approximately 84.3% of listings show high availability (181+ days open annually), indicating potential for increased bookings or specific owner usage patterns.
- For booked days, the 31-90 days range is most frequent in Talheim (47.4%), reflecting common guest stay durations or potential owner blocking patterns.
- A notable 21.1% of properties secure long booking periods (181+ days booked per year), highlighting successful long-term rental strategies or significant owner usage.
Talheim Airbnb Minimum Stay Requirements Analysis
Distribution of Listings by Minimum Night Requirement
1 Night
3 listings
21.4% of total
2 Nights
6 listings
42.9% of total
7-29 Nights
2 listings
14.3% of total
30+ Nights
3 listings
21.4% of total
Key Insights
- The most prevalent minimum stay requirement in Talheim is 2 Nights, adopted by 42.9% of listings. This highlights the market's preference for shorter, flexible bookings.
- A strong majority (64.3%) of the Talheim Airbnb data shows acceptance of very short stays (1-2 nights), indicating a dynamic, high-turnover market.
- A significant segment (21.4%) caters to monthly stays (30+ nights) in Talheim, pointing to opportunities in the extended-stay market.
Recommendations
- Align with the market by considering a 2 Nights minimum stay, as 42.9% of Talheim hosts use this setting.
- If feasible, allowing 1-night stays, especially midweek or during low season, could capture last-minute bookings, as only 21.4% currently do.
- Explore offering discounts for stays of 30+ nights to attract the 21.4% of the market seeking extended stays.
- Adjust minimum nights based on seasonality – potentially shorter during low season and longer during peak demand periods in Talheim.
Talheim Airbnb Cancellation Policy Trends Analysis (2025)
Flexible
6 listings
60% of total
Moderate
3 listings
30% of total
Firm
1 listings
10% of total
Cancellation Policy Insights for Talheim
- The prevailing Airbnb cancellation policy trend in Talheim is Flexible, used by 60% of listings.
- The market strongly favors guest-friendly terms, with 90.0% of listings offering Flexible or Moderate policies. This suggests guests in Talheim may expect booking flexibility.
Recommendations for Hosts
- Consider adopting a Flexible policy to align with the 60% market standard in Talheim.
- Given the high prevalence of Flexible policies (60%), offering this can enhance booking appeal, especially during shoulder seasons.
- Regularly review your cancellation policy against competitors and market demand shifts in Talheim.
Talheim STR Booking Lead Time Analysis (2025)
Average Booking Lead Time by Month
Booking Lead Time Insights for Talheim
- The overall average booking lead time for vacation rentals in Talheim is 24 days.
- Guests book furthest in advance for stays during June (average 68 days), likely coinciding with peak travel demand or local events.
- The shortest booking windows occur for stays in July (average 9 days), indicating more last-minute travel plans during this time.
- Seasonally, Winter (36 days avg.) sees the longest lead times, while Fall (20 days avg.) has the shortest, reflecting typical travel planning cycles.
Recommendations for Hosts
- Use the overall average lead time (24 days) as a baseline for your pricing and availability strategy in Talheim.
- For June stays, consider implementing length-of-stay discounts or slightly higher rates for bookings made less than 68 days out to capitalize on advance planning.
- During July, focus on last-minute booking availability and promotions, as guests book with very short notice (9 days avg.).
- Target marketing efforts for the Winter season well in advance (at least 36 days) to capture early planners.
- Monitor your own booking lead times against these Talheim averages to identify opportunities for dynamic pricing adjustments.
Popular & Essential Airbnb Amenities in Talheim (2025)
Amenity Prevalence
Amenity Insights for Talheim
- Essential amenities in Talheim that guests expect include: Smoke alarm, Heating, TV, Wifi, Hot water. Lacking these (any) could significantly impact bookings.
- Popular amenities like Kitchen, Essentials, Free parking on premises are common but not universal. Offering these can provide a competitive edge.
Recommendations for Hosts
- Ensure your listing includes all essential amenities for Talheim: Smoke alarm, Heating, TV, Wifi, Hot water.
- Consider adding popular differentiators like Kitchen or Essentials to increase appeal.
- Highlight unique or less common amenities you offer (e.g., hot tub, dedicated workspace, EV charger) in your listing description and photos.
- Regularly check competitor amenities in Talheim to stay competitive.
Talheim Airbnb Guest Demographics & Profile Analysis (2025)
Guest Profile Summary for Talheim
- The typical guest profile for Airbnb in Talheim consists of a mix of domestic (64%) and international guests, often arriving from nearby Landau, typically belonging to the Post-2000s (Gen Z/Alpha) group (50%), primarily speaking English or German.
- Domestic travelers account for 64.1% of guests.
- Key international markets include Germany (64.1%) and France (5.8%).
- Top languages spoken are English (39%) followed by German (31.6%).
- A significant demographic segment is the Post-2000s (Gen Z/Alpha) group, representing 50% of guests.
Recommendations for Hosts
- Target domestic marketing efforts towards travelers from Landau and Hamburg.
- Tailor amenities and listing descriptions to appeal to the dominant Post-2000s (Gen Z/Alpha) demographic (e.g., highlight fast WiFi, smart home features, local guides).
- Highlight unique local experiences or amenities relevant to the primary guest profile.
- Consider seasonal promotions aligned with peak travel times for key origin markets.
Nearby Short-Term Rental Market Comparison
How does the Talheim Airbnb market stack up against its neighbors? Compare key performance metrics like average monthly revenue, ADR, and occupancy rates in surrounding areas to understand the broader regional STR landscape.
| Market | Active Properties | Monthly Revenue | Daily Rate | Avg. Occupancy |
|---|---|---|---|---|
| Vitznau | 31 | $3,816 | $332.93 | 48% |
| Bürserberg | 41 | $3,632 | $333.78 | 42% |
| Brand | 61 | $3,577 | $466.21 | 32% |
| Lucerne | 375 | $3,524 | $273.58 | 51% |
| Pfafflar | 10 | $3,421 | $263.43 | 57% |
| Sankt Anton am Arlberg | 125 | $3,122 | $405.49 | 41% |
| Warth | 26 | $3,112 | $395.81 | 39% |
| Kusterdingen | 11 | $3,048 | $191.45 | 52% |
| Meggen | 10 | $2,910 | $217.66 | 55% |
| Sempach | 15 | $2,875 | $213.78 | 50% |