Tbilisi Airbnb Market Analysis 2026: Short Term Rental Data & Vacation Rental Statistics in Tbilisi, Georgia
Is Airbnb profitable in Tbilisi in 2026? Explore comprehensive Airbnb analytics for Tbilisi, Tbilisi, Georgia to uncover income potential. This 2026 STR market report for Tbilisi, based on AirROI data from February 2025 to January 2026, reveals key trends in the bustling market of 5,525 active listings.
Whether you're considering an Airbnb investment in Tbilisi, optimizing your existing vacation rental, or exploring rental arbitrage opportunities, understanding the Tbilisi Airbnb data is crucial. Leveraging the low regulation environment is key to maximizing your short term rental income potential. Let's dive into the specifics.
Key Tbilisi Airbnb Performance Metrics Overview
Monthly Airbnb Revenue Variations & Income Potential in Tbilisi (2026)
Understanding the monthly revenue variations for Airbnb listings in Tbilisi is key to maximizing your short term rental income potential. Seasonality significantly impacts earnings. Our analysis, based on data from the past 12 months, shows that the peak revenue month for STRs in Tbilisi is typically August, while January often presents the lowest earnings, highlighting opportunities for strategic pricing adjustments during shoulder and low seasons. Explore the typical Airbnb income in Tbilisi across different performance tiers:
- Best-in-class properties (Top 10%) achieve $1,632+ monthly, often utilizing dynamic pricing and superior guest experiences.
- Strong performing properties (Top 25%) earn $1,020 or more, indicating effective management and desirable locations/amenities.
- Typical properties (Median) generate around $586 per month, representing the average market performance.
- Entry-level properties (Bottom 25%) see earnings around $276, often with potential for optimization.
Average Monthly Airbnb Earnings Trend in Tbilisi
Tbilisi Airbnb Occupancy Rate Trends (2026)
Maximize your bookings by understanding the Tbilisi STR occupancy trends. Seasonal demand shifts significantly influence how often properties are booked. Typically, Septembersees the highest demand (peak season occupancy), while January experiences the lowest (low season). Effective strategies, like adjusting minimum stays or offering promotions, can boost occupancy during slower periods. Here's how different property tiers perform in Tbilisi:
- Best-in-class properties (Top 10%) achieve 85%+ occupancy, indicating high desirability and potentially optimized availability.
- Strong performing properties (Top 25%) maintain 69% or higher occupancy, suggesting good market fit and guest satisfaction.
- Typical properties (Median) have an occupancy rate around 43%.
- Entry-level properties (Bottom 25%) average 21% occupancy, potentially facing higher vacancy.
Average Monthly Occupancy Rate Trend in Tbilisi
Average Daily Rate (ADR) Airbnb Trends in Tbilisi (2026)
Effective short term rental pricing strategy in Tbilisi involves understanding monthly ADR fluctuations. The Average Daily Rate (ADR) for Airbnb in Tbilisi typically peaks in August and dips lowest during February. Leveraging Airbnb dynamic pricing tools or strategies based on this seasonality can significantly boost revenue. Here's a look at the typical nightly rates achieved:
- Best-in-class properties (Top 10%) command rates of $98+ per night, often due to premium features or locations.
- Strong performing properties (Top 25%) achieve nightly rates of $62 or more.
- Typical properties (Median) charge around $42 per night.
- Entry-level properties (Bottom 25%) earn around $30 per night.
Average Daily Rate (ADR) Trend by Month in Tbilisi
Get Live Tbilisi Market Intelligence 👇

Explore Real-time Analytics
Airbnb Seasonality Analysis & Trends in Tbilisi (2026)
Peak Season (August, July, September)
- Revenue averages $942 per month
- Occupancy rates average 51.4%
- Daily rates average $60
Shoulder Season
- Revenue averages $801 per month
- Occupancy maintains around 46.5%
- Daily rates hold near $57
Low Season (January, February, December)
- Revenue drops to average $642 per month
- Occupancy decreases to average 38.2%
- Daily rates adjust to average $57
Seasonality Insights for Tbilisi
- The Airbnb seasonality in Tbilisi shows moderate seasonality with distinct peak and low periods. While the sections above show seasonal averages, it's also insightful to look at the extremes:
- During the high season, the absolute peak month showcases Tbilisi's highest earning potential, with monthly revenues capable of climbing to $961, occupancy reaching a high of 52.5%, and ADRs peaking at $60.
- Conversely, the slowest single month of the year, typically falling within the low season, marks the market's lowest point. In this month, revenue might dip to $610, occupancy could drop to 34.5%, and ADRs may adjust down to $55.
- Understanding both the seasonal averages and these monthly peaks and troughs in revenue, occupancy, and ADR is crucial for maximizing your Airbnb profit potential in Tbilisi.
Seasonal Strategies for Maximizing Profit
- Peak Season: Maximize revenue through premium pricing and potentially longer minimum stays. Ensure high availability.
- Low Season: Offer competitive pricing, special promotions (e.g., extended stay discounts), and flexible cancellation policies. Target off-season travelers like remote workers or budget-conscious guests.
- Shoulder Seasons: Implement dynamic pricing that balances peak and low rates. Target weekend travelers or specific events. Offer slightly more flexible terms than peak season.
- Regularly analyze your own performance against these Tbilisi seasonality benchmarks and adjust your pricing and availability strategy accordingly.
Best Areas for Airbnb Investment in Tbilisi (2026)
Exploring the top neighborhoods for short-term rentals in Tbilisi? This section highlights key areas, outlining why they are attractive for hosts and guests, along with notable local attractions. Consider these locations based on your target guest profile and investment strategy.
| Neighborhood / Area | Why Host Here? (Target Guests & Appeal) | Key Attractions & Landmarks |
|---|---|---|
| Rustaveli Avenue | The heart of Tbilisi, Rustaveli Avenue is lined with theaters, museums, and cafes. It attracts tourists looking for culture and entertainment, making it an ideal spot for Airbnb hosting. | Georgian National Museum, Tbilisi Opera and Ballet Theatre, Rustaveli Theatre, National Gallery, Etseri Vardzia Café |
| Old Tbilisi | Known for its historic architecture and charming streets, Old Tbilisi offers a unique experience for visitors looking to explore the city's rich history and culture. This area is a popular destination for tourists. | The Bridge of Peace, Narikala Fortress, Sulfur Baths, Metekhi Church, Sharden Street, Freedom Square |
| Vake | A residential area known for parks and upscale living. Vake attracts both locals and visitors looking for a quieter environment close to nature and parks, which is appealing for families and longer stays. | Vake Park, Mziuri Park, Tbilisi Sea, Vake Aquapark, Shota Rustaveli National Science Library |
| Montpellier | A vibrant area popular with the youth and expatriates, Montpellier offers trendy cafes and nightlife. It's a hotspot for those looking to experience Tbilisi's modern lifestyle. | Fabrika, Tbilisi Mall, Dragon's Dream, Club 36, Nadikvari Park |
| Mtatsminda | Mtatsminda offers stunning views of Tbilisi and is home to the Mtatsminda Park. It's a scenic area that attracts tourists for both leisure and adventure activities. | Mtatsminda Park, Mtatsminda Pantheon, Funicular Ride, Tbilisi Television Tower, Tskneti |
| Lisi Lake | A tranquil area located near Lisi Lake, this neighborhood is ideal for nature lovers and those looking for a peaceful retreat from the busy city. It's great for longer stays and family rentals. | Lisi Lake, Lake Park, Lisi Resort, Botanical Garden, Vake Park |
| Saburtalo | A residential area that has seen rapid development, offering modern amenities and proximity to the city center. It's popular with young professionals and families. | Tbilisi Central Park, Saburtalo Market, Kikvidze Park, grocery stores and cafes, Green spaces |
| Chughureti | A lesser-known area with authentic local charm, Chughureti is attracting visitors looking for an off-the-beaten-path experience. Affordable prices make it a good option for budget travelers. | Vera Park, Local markets, Historical buildings, Art cafes, Cultural centers |
Understanding Airbnb License Requirements & STR Laws in Tbilisi (2026)
While Tbilisi, Tbilisi, Georgia currently shows low STR regulations, specific Airbnb license requirements might still exist or change. Always verify the latest short term rental regulations and Airbnb license requirements directly with local government authorities for Tbilisi to ensure full compliance before hosting.
(Source: AirROI data, 2026, based on 0% licensed listings)
Top Performing Airbnb Properties in Tbilisi (2026)
Benchmark your potential! Explore examples of top-performing Airbnb properties in Tbilisibased on Trailing Twelve Month (TTM) revenue. Analyze their characteristics, revenue, occupancy rate, and ADR to understand what drives success in this market.

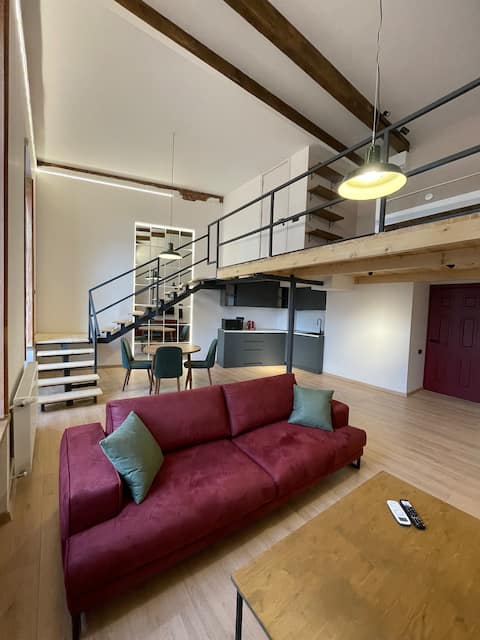
Entire House - Cityscape Retreat: The View
Entire Place • 4 bedrooms
Midamo Orbeliani
Entire Place • 1 bedroom

Tfeli Penthouse
Entire Place • 4 bedrooms

new listing 2bdr apartment
Entire Place • 2 bedrooms

Villa Tabori Hill | 7BR Villa Near Old City
Entire Place • 7 bedrooms

Shindisi Residence – Sauna Retreat & Family Villa
Entire Place • 7 bedrooms
Note: Performance varies based on location, size, amenities, seasonality, and management quality. Data reflects the past 12 months.
Top Performing Airbnb Hosts in Tbilisi (2026)
Learn from the best! This table showcases top-performing Airbnb hosts in Tbilisi based on the number of properties managed and estimated total revenue over the past year. Analyze their scale and performance metrics.
| Host Name | Properties | Grossing Revenue | Stay Reviews | Avg Rating |
|---|---|---|---|---|
| Niko From Wehost | 51 | $916,476 | 4366 | 4.72/5.0 |
| Nikoloz From Wehost | 33 | $474,258 | 1247 | 4.67/5.0 |
| Sergey | 49 | $421,081 | 2400 | 4.74/5.0 |
| Tfeli Stay | 4 | $367,768 | 345 | 4.96/5.0 |
| Nina | 25 | $360,998 | 1529 | 4.88/5.0 |
| Nika | 5 | $280,667 | 234 | 4.84/5.0 |
| Gita | 25 | $270,202 | 690 | 4.92/5.0 |
| Temi From Wehost | 21 | $253,413 | 1608 | 4.71/5.0 |
| Zarina | 31 | $235,659 | 1305 | 4.83/5.0 |
| Nino | 5 | $210,458 | 46 | 4.90/5.0 |
Analyzing the strategies of top hosts, such as their property selection, pricing, and guest communication, can offer valuable lessons for optimizing your own Airbnb operations in Tbilisi.
Dive Deeper: Advanced Tbilisi STR Market Data (2026)
Ready to unlock more insights? AirROI provides access to advanced metrics and comprehensive Airbnb data for Tbilisi. Explore detailed analytics beyond this report to refine your investment strategy, optimize pricing, and maximize your vacation rental profits.
Explore Advanced MetricsTbilisi Short-Term Rental Market Composition (2026): Property & Room Types
Room Type Distribution
Property Type Distribution
Market Composition Insights for Tbilisi
- The Tbilisi Airbnb market composition is heavily skewed towards Entire Home/Apt listings, which make up 91.9% of the 5,525 active rentals. This indicates strong guest preference for privacy and space.
- Looking at the property type distribution in Tbilisi, Apartment/Condo properties are the most common (85.8%), reflecting the local real estate landscape.
- Smaller segments like hotel/boutique, others, outdoor/unique, unique stays (combined 6.4%) offer potential for unique stay experiences.
Tbilisi Airbnb Room Capacity Analysis (2026): Bedroom Distribution
Distribution of Listings by Number of Bedrooms
Room Capacity Insights for Tbilisi
- The dominant room capacity in Tbilisi is 1 bedroom listings, making up 62.3% of the market. This suggests a strong demand for properties suitable for couples or solo travelers.
- Together, 1 bedroom and 2 bedrooms properties represent 82.9% of the active Airbnb listings in Tbilisi, indicating a high concentration in these sizes.
- With over half the market (62.3%) consisting of studios or 1-bedroom units, Tbilisi is particularly well-suited for individuals or couples.
- Listings with 3+ bedrooms (7.9%) represent a smaller niche, potentially indicating an underserved market for larger group accommodations in Tbilisi.
Tbilisi Vacation Rental Guest Capacity Trends (2026)
Distribution of Listings by Guest Capacity
Guest Capacity Insights for Tbilisi
- The most common guest capacity trend in Tbilisi vacation rentals is listings accommodating 2 guests (35.9%). This suggests the primary traveler segment is likely couples or solo travelers.
- Properties designed for 2 guests and 4 guests dominate the Tbilisi STR market, accounting for 57.2% of listings.
- 10.6% of properties accommodate 6+ guests, serving the market segment for larger families or group travel in Tbilisi.
- On average, properties in Tbilisi are equipped to host 3.3 guests.
Tbilisi Airbnb Booking Patterns (2026): Available vs. Booked Days
Available Days Distribution
Booked Days Distribution
Booking Pattern Insights for Tbilisi
- The most common availability pattern in Tbilisi falls within the 271-366 days range, representing 47.7% of listings. This suggests many properties have significant open periods on their calendars.
- Approximately 75.6% of listings show high availability (181+ days open annually), indicating potential for increased bookings or specific owner usage patterns.
- For booked days, the 91-180 days range is most frequent in Tbilisi (28.5%), reflecting common guest stay durations or potential owner blocking patterns.
- A notable 25.4% of properties secure long booking periods (181+ days booked per year), highlighting successful long-term rental strategies or significant owner usage.
Tbilisi Airbnb Minimum Stay Requirements Analysis
Distribution of Listings by Minimum Night Requirement
1 Night
1341 listings
24.3% of total
2 Nights
1389 listings
25.1% of total
3 Nights
598 listings
10.8% of total
4-6 Nights
488 listings
8.8% of total
7-29 Nights
339 listings
6.1% of total
30+ Nights
1370 listings
24.8% of total
Key Insights
- The most prevalent minimum stay requirement in Tbilisi is 2 Nights, adopted by 25.1% of listings. This highlights the market's preference for shorter, flexible bookings.
- A significant segment (24.8%) caters to monthly stays (30+ nights) in Tbilisi, pointing to opportunities in the extended-stay market.
Recommendations
- Align with the market by considering a 2 Nights minimum stay, as 25.1% of Tbilisi hosts use this setting.
- If feasible, allowing 1-night stays, especially midweek or during low season, could capture last-minute bookings, as only 24.3% currently do.
- Explore offering discounts for stays of 30+ nights to attract the 24.8% of the market seeking extended stays.
- Adjust minimum nights based on seasonality – potentially shorter during low season and longer during peak demand periods in Tbilisi.
Tbilisi Airbnb Cancellation Policy Trends Analysis (2026)
Limited
50 listings
0.9% of total
Flexible
2757 listings
50% of total
Moderate
1557 listings
28.2% of total
Firm
877 listings
15.9% of total
Strict
278 listings
5% of total
Cancellation Policy Insights for Tbilisi
- The prevailing Airbnb cancellation policy trend in Tbilisi is Flexible, used by 50% of listings.
- The market strongly favors guest-friendly terms, with 78.2% of listings offering Flexible or Moderate policies. This suggests guests in Tbilisi may expect booking flexibility.
- Strict cancellation policies are quite rare (5%), potentially making listings with this policy less competitive unless justified by high demand or property type.
Recommendations for Hosts
- Consider adopting a Flexible policy to align with the 50% market standard in Tbilisi.
- Using a Strict policy might deter some guests, as only 5% of listings use it. Evaluate if potential revenue protection outweighs possible lower booking rates.
- Regularly review your cancellation policy against competitors and market demand shifts in Tbilisi.
Tbilisi STR Booking Lead Time Analysis (2026)
Average Booking Lead Time by Month
Booking Lead Time Insights for Tbilisi
- The overall average booking lead time for vacation rentals in Tbilisi is 22 days.
- Guests book furthest in advance for stays during August (average 29 days), likely coinciding with peak travel demand or local events.
- The shortest booking windows occur for stays in February (average 14 days), indicating more last-minute travel plans during this time.
- Seasonally, Summer (25 days avg.) sees the longest lead times, while Spring (20 days avg.) has the shortest, reflecting typical travel planning cycles.
Recommendations for Hosts
- Use the overall average lead time (22 days) as a baseline for your pricing and availability strategy in Tbilisi.
- During February, focus on last-minute booking availability and promotions, as guests book with very short notice (14 days avg.).
- Target marketing efforts for the Summer season well in advance (at least 25 days) to capture early planners.
- Monitor your own booking lead times against these Tbilisi averages to identify opportunities for dynamic pricing adjustments.
Popular & Essential Airbnb Amenities in Tbilisi (2026)
Amenity Prevalence
Amenity Insights for Tbilisi
- Essential amenities in Tbilisi that guests expect include: Wifi. Lacking these (this) could significantly impact bookings.
- Popular amenities like Kitchen, Heating, Washer are common but not universal. Offering these can provide a competitive edge.
Recommendations for Hosts
- Ensure your listing includes all essential amenities for Tbilisi: Wifi.
- Prioritize adding missing essentials: Wifi.
- Consider adding popular differentiators like Kitchen or Heating to increase appeal.
- Highlight unique or less common amenities you offer (e.g., hot tub, dedicated workspace, EV charger) in your listing description and photos.
- Regularly check competitor amenities in Tbilisi to stay competitive.
Tbilisi Airbnb Guest Demographics & Profile Analysis (2026)
Guest Profile Summary for Tbilisi
- The typical guest profile for Airbnb in Tbilisi consists of predominantly international visitors (90%), with top international origins including Georgia, typically belonging to the Post-2000s (Gen Z/Alpha) group (50%), primarily speaking English or Russian.
- Domestic travelers account for 9.6% of guests.
- Key international markets include United States (11.2%) and Georgia (9.6%).
- Top languages spoken are English (41%) followed by Russian (18.5%).
- A significant demographic segment is the Post-2000s (Gen Z/Alpha) group, representing 50% of guests.
Recommendations for Hosts
- Focus marketing internationally, particularly towards travelers from Georgia.
- Tailor amenities and listing descriptions to appeal to the dominant Post-2000s (Gen Z/Alpha) demographic (e.g., highlight fast WiFi, smart home features, local guides).
- Highlight unique local experiences or amenities relevant to the primary guest profile.
- Consider seasonal promotions aligned with peak travel times for key origin markets.
Nearby Short-Term Rental Market Comparison
How does the Tbilisi Airbnb market stack up against its neighbors? Compare key performance metrics like average monthly revenue, ADR, and occupancy rates in surrounding areas to understand the broader regional STR landscape.
| Market | Active Properties | Monthly Revenue | Daily Rate | Avg. Occupancy |
|---|---|---|---|---|
| Tba | 10 | $822 | $144.50 | 25% |
| Yerevan | 2,176 | $698 | $73.92 | 42% |
| Stepantsminda | 261 | $641 | $82.50 | 30% |
| Achkhoti | 15 | $597 | $101.39 | 23% |
| Dilijan | 95 | $459 | $113.70 | 24% |
| Gudauri | 647 | $438 | $116.00 | 33% |
| Sadgeri | 11 | $417 | $114.81 | 23% |
| Sioni | 22 | $408 | $99.95 | 21% |
| Ananuri | 10 | $359 | $78.92 | 20% |
| Kumlistsikhe | 79 | $316 | $100.25 | 27% |