Mtskheta Airbnb Market Analysis 2026: Short Term Rental Data & Vacation Rental Statistics in Mtskheta-Mtianeti, Georgia
Is Airbnb profitable in Mtskheta in 2026? Explore comprehensive Airbnb analytics for Mtskheta, Mtskheta-Mtianeti, Georgia to uncover income potential. This 2026 STR market report for Mtskheta, based on AirROI data from February 2025 to January 2026, reveals key trends in the niche market of 40 active listings.
Whether you're considering an Airbnb investment in Mtskheta, optimizing your existing vacation rental, or exploring rental arbitrage opportunities, understanding the Mtskheta Airbnb data is crucial. Leveraging the low regulation environment is key to maximizing your short term rental income potential. Let's dive into the specifics.
Key Mtskheta Airbnb Performance Metrics Overview
Monthly Airbnb Revenue Variations & Income Potential in Mtskheta (2026)
Understanding the monthly revenue variations for Airbnb listings in Mtskheta is key to maximizing your short term rental income potential. Seasonality significantly impacts earnings. Our analysis, based on data from the past 12 months, shows that the peak revenue month for STRs in Mtskheta is typically August, while October often presents the lowest earnings, highlighting opportunities for strategic pricing adjustments during shoulder and low seasons. Explore the typical Airbnb income in Mtskheta across different performance tiers:
- Best-in-class properties (Top 10%) achieve $879+ monthly, often utilizing dynamic pricing and superior guest experiences.
- Strong performing properties (Top 25%) earn $475 or more, indicating effective management and desirable locations/amenities.
- Typical properties (Median) generate around $207 per month, representing the average market performance.
- Entry-level properties (Bottom 25%) see earnings around $89, often with potential for optimization.
Average Monthly Airbnb Earnings Trend in Mtskheta
Mtskheta Airbnb Occupancy Rate Trends (2026)
Maximize your bookings by understanding the Mtskheta STR occupancy trends. Seasonal demand shifts significantly influence how often properties are booked. Typically, Augustsees the highest demand (peak season occupancy), while March experiences the lowest (low season). Effective strategies, like adjusting minimum stays or offering promotions, can boost occupancy during slower periods. Here's how different property tiers perform in Mtskheta:
- Best-in-class properties (Top 10%) achieve 53%+ occupancy, indicating high desirability and potentially optimized availability.
- Strong performing properties (Top 25%) maintain 34% or higher occupancy, suggesting good market fit and guest satisfaction.
- Typical properties (Median) have an occupancy rate around 17%.
- Entry-level properties (Bottom 25%) average 7% occupancy, potentially facing higher vacancy.
Average Monthly Occupancy Rate Trend in Mtskheta
Average Daily Rate (ADR) Airbnb Trends in Mtskheta (2026)
Effective short term rental pricing strategy in Mtskheta involves understanding monthly ADR fluctuations. The Average Daily Rate (ADR) for Airbnb in Mtskheta typically peaks in January and dips lowest during September. Leveraging Airbnb dynamic pricing tools or strategies based on this seasonality can significantly boost revenue. Here's a look at the typical nightly rates achieved:
- Best-in-class properties (Top 10%) command rates of $95+ per night, often due to premium features or locations.
- Strong performing properties (Top 25%) achieve nightly rates of $57 or more.
- Typical properties (Median) charge around $38 per night.
- Entry-level properties (Bottom 25%) earn around $28 per night.
Average Daily Rate (ADR) Trend by Month in Mtskheta
Get Live Mtskheta Market Intelligence 👇

Explore Real-time Analytics
Airbnb Seasonality Analysis & Trends in Mtskheta (2026)
Peak Season (August, February, March)
- Revenue averages $518 per month
- Occupancy rates average 27.8%
- Daily rates average $52
Shoulder Season
- Revenue averages $376 per month
- Occupancy maintains around 23.0%
- Daily rates hold near $52
Low Season (June, October, November)
- Revenue drops to average $287 per month
- Occupancy decreases to average 22.8%
- Daily rates adjust to average $53
Seasonality Insights for Mtskheta
- The Airbnb seasonality in Mtskheta shows highly seasonal trends requiring careful strategy. While the sections above show seasonal averages, it's also insightful to look at the extremes:
- During the high season, the absolute peak month showcases Mtskheta's highest earning potential, with monthly revenues capable of climbing to $606, occupancy reaching a high of 35.6%, and ADRs peaking at $57.
- Conversely, the slowest single month of the year, typically falling within the low season, marks the market's lowest point. In this month, revenue might dip to $272, occupancy could drop to 17.3%, and ADRs may adjust down to $47.
- Understanding both the seasonal averages and these monthly peaks and troughs in revenue, occupancy, and ADR is crucial for maximizing your Airbnb profit potential in Mtskheta.
Seasonal Strategies for Maximizing Profit
- Peak Season: Maximize revenue through premium pricing and potentially longer minimum stays. Ensure high availability.
- Low Season: Offer competitive pricing, special promotions (e.g., extended stay discounts), and flexible cancellation policies. Target off-season travelers like remote workers or budget-conscious guests.
- Shoulder Seasons: Implement dynamic pricing that balances peak and low rates. Target weekend travelers or specific events. Offer slightly more flexible terms than peak season.
- Regularly analyze your own performance against these Mtskheta seasonality benchmarks and adjust your pricing and availability strategy accordingly.
Best Areas for Airbnb Investment in Mtskheta (2026)
Exploring the top neighborhoods for short-term rentals in Mtskheta? This section highlights key areas, outlining why they are attractive for hosts and guests, along with notable local attractions. Consider these locations based on your target guest profile and investment strategy.
| Neighborhood / Area | Why Host Here? (Target Guests & Appeal) | Key Attractions & Landmarks |
|---|---|---|
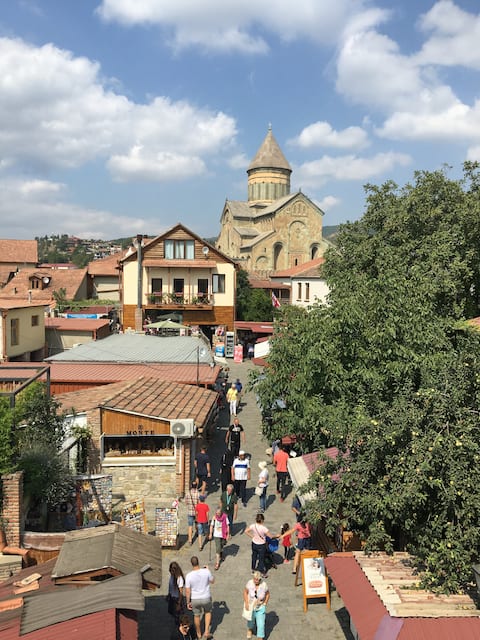
| Mtskheta Old Town | Historical town with UNESCO World Heritage sites. A perfect location for guests looking to explore ancient churches and cultural heritage sites. | Svetitskhoveli Cathedral, Jvari Monastery, Samtavro Monastery, Mtskheta Museum of History, Armazi Fortress |
| Jvari Monastery | Iconic site perched on a hilltop with stunning views of the confluence of the Aragvi and Mtkvari rivers. Attracts tourists for both spirituality and photography. | Jvari Monastery, Scenic viewpoints, Hiking trails |
| Mtkvari River Bank | Beautiful riverside area that offers serene hosting options. Ideal for guests looking for a peaceful retreat. | River boat rides, Walking paths, Picnic areas |
| Svetitskhoveli Street | Lively street close to many attractions, filled with cafes and shops. Great for experiencing local culture and cuisine. | Local shops, Restaurants, Cafes |
| Mtskheta Market | Local market that showcases Georgian food and crafts. Perfect for guests wanting to immerse themselves in local life. | Fresh produce, Handmade crafts, Local snacks |
| Shio-Mgvime Monastery | A tranquil monastery complex in a scenic setting. Attracts guests who seek spirituality and nature. | Monastery, Nature trails, Scenic views |
| Svetitskhoveli Cathedral Square | Central square in front of one of Georgia's most famous churches. Ideal location for an authentic local experience. | Historical architecture, Local events, Cafes |
| Armazi Fortress | A historical fortress with panoramic views of Mtskheta. A great location for adventurous guests. | Fortress ruins, Panoramic views, Hiking opportunities |
Understanding Airbnb License Requirements & STR Laws in Mtskheta (2026)
While Mtskheta, Mtskheta-Mtianeti, Georgia currently shows low STR regulations, specific Airbnb license requirements might still exist or change. Always verify the latest short term rental regulations and Airbnb license requirements directly with local government authorities for Mtskheta to ensure full compliance before hosting.
(Source: AirROI data, 2026, finding no licensed listings among those analyzed)
Top Performing Airbnb Properties in Mtskheta (2026)
Benchmark your potential! Explore examples of top-performing Airbnb properties in Mtskhetabased on Trailing Twelve Month (TTM) revenue. Analyze their characteristics, revenue, occupancy rate, and ADR to understand what drives success in this market.
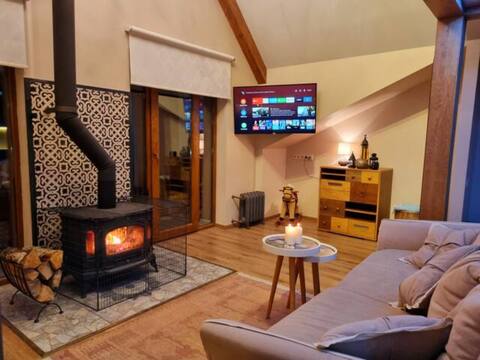
Duplex in New Gudauri with Jacuzzi & Fireplace
Entire Place • 1 bedroom
Mtskheta wellpoint Arsukidze 48 free parking 4 car
Private Room • 4 bedrooms

levanto
Entire Place • 2 bedrooms
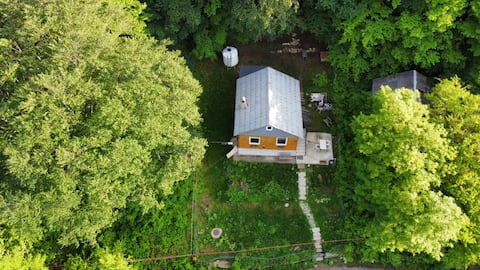
Cottage in Tskhvarichamia forest
Entire Place • 2 bedrooms

Family Hotel Saba
Entire Place • 2 bedrooms

Cozy micro house with a yard
Entire Place • 1 bedroom
Note: Performance varies based on location, size, amenities, seasonality, and management quality. Data reflects the past 12 months.
Top Performing Airbnb Hosts in Mtskheta (2026)
Learn from the best! This table showcases top-performing Airbnb hosts in Mtskheta based on the number of properties managed and estimated total revenue over the past year. Analyze their scale and performance metrics.
| Host Name | Properties | Grossing Revenue | Stay Reviews | Avg Rating |
|---|---|---|---|---|
| Vera | 1 | $10,513 | 2 | Not Rated |
| Rusudan | 1 | $8,136 | 3 | 5.00/5.0 |
| Keti | 1 | $7,347 | 121 | 4.93/5.0 |
| Irma | 1 | $5,285 | 10 | 4.80/5.0 |
| Nino | 1 | $5,148 | 23 | 4.96/5.0 |
| Aslan | 1 | $5,016 | 93 | 4.98/5.0 |
| Ana | 2 | $4,987 | 114 | 4.92/5.0 |
| Nino | 1 | $4,087 | 51 | 4.96/5.0 |
| Chiora | 2 | $3,863 | 145 | 4.79/5.0 |
| Iliya | 1 | $3,697 | 4 | 5.00/5.0 |
Analyzing the strategies of top hosts, such as their property selection, pricing, and guest communication, can offer valuable lessons for optimizing your own Airbnb operations in Mtskheta.
Dive Deeper: Advanced Mtskheta STR Market Data (2026)
Ready to unlock more insights? AirROI provides access to advanced metrics and comprehensive Airbnb data for Mtskheta. Explore detailed analytics beyond this report to refine your investment strategy, optimize pricing, and maximize your vacation rental profits.
Explore Advanced MetricsMtskheta Short-Term Rental Market Composition (2026): Property & Room Types
Room Type Distribution
Property Type Distribution
Market Composition Insights for Mtskheta
- The Mtskheta Airbnb market composition is heavily skewed towards Entire Home/Apt listings, which make up 57.5% of the 40 active rentals. This indicates strong guest preference for privacy and space.
- However, a notable 42.5% share for Private Rooms suggests opportunities for budget-conscious travelers or hosts renting out spare rooms.
- Looking at the property type distribution in Mtskheta, House properties are the most common (45%), reflecting the local real estate landscape.
- Houses represent a significant 45% portion, catering likely to families or larger groups.
- The presence of 35% Hotel/Boutique listings indicates integration with traditional hospitality.
Mtskheta Airbnb Room Capacity Analysis (2026): Bedroom Distribution
Distribution of Listings by Number of Bedrooms
Room Capacity Insights for Mtskheta
- The dominant room capacity in Mtskheta is 1 bedroom listings, making up 50% of the market. This suggests a strong demand for properties suitable for couples or solo travelers.
- Together, 1 bedroom and 2 bedrooms properties represent 70.0% of the active Airbnb listings in Mtskheta, indicating a high concentration in these sizes.
Mtskheta Vacation Rental Guest Capacity Trends (2026)
Distribution of Listings by Guest Capacity
Guest Capacity Insights for Mtskheta
- The most common guest capacity trend in Mtskheta vacation rentals is listings accommodating 2 guests (25%). This suggests the primary traveler segment is likely couples or solo travelers.
- Properties designed for 2 guests and 3 guests dominate the Mtskheta STR market, accounting for 47.5% of listings.
- 17.5% of properties accommodate 6+ guests, serving the market segment for larger families or group travel in Mtskheta.
- On average, properties in Mtskheta are equipped to host 3.4 guests.
Mtskheta Airbnb Booking Patterns (2026): Available vs. Booked Days
Available Days Distribution
Booked Days Distribution
Booking Pattern Insights for Mtskheta
- The most common availability pattern in Mtskheta falls within the 271-366 days range, representing 90% of listings. This suggests many properties have significant open periods on their calendars.
- Approximately 100.0% of listings show high availability (181+ days open annually), indicating potential for increased bookings or specific owner usage patterns.
- For booked days, the 1-30 days range is most frequent in Mtskheta (50%), reflecting common guest stay durations or potential owner blocking patterns.
Mtskheta Airbnb Minimum Stay Requirements Analysis
Distribution of Listings by Minimum Night Requirement
1 Night
33 listings
82.5% of total
2 Nights
1 listings
2.5% of total
4-6 Nights
2 listings
5% of total
7-29 Nights
1 listings
2.5% of total
30+ Nights
3 listings
7.5% of total
Key Insights
- The most prevalent minimum stay requirement in Mtskheta is 1 Night, adopted by 82.5% of listings. This highlights the market's preference for shorter, flexible bookings.
- A strong majority (85.0%) of the Mtskheta Airbnb data shows acceptance of very short stays (1-2 nights), indicating a dynamic, high-turnover market.
Recommendations
- Align with the market by considering a 1 Night minimum stay, as 82.5% of Mtskheta hosts use this setting.
- Explore offering discounts for stays of 30+ nights to attract the 7.5% of the market seeking extended stays.
- Adjust minimum nights based on seasonality – potentially shorter during low season and longer during peak demand periods in Mtskheta.
Mtskheta Airbnb Cancellation Policy Trends Analysis (2026)
Flexible
26 listings
65% of total
Moderate
10 listings
25% of total
Firm
4 listings
10% of total
Cancellation Policy Insights for Mtskheta
- The prevailing Airbnb cancellation policy trend in Mtskheta is Flexible, used by 65% of listings.
- The market strongly favors guest-friendly terms, with 90.0% of listings offering Flexible or Moderate policies. This suggests guests in Mtskheta may expect booking flexibility.
Recommendations for Hosts
- Consider adopting a Flexible policy to align with the 65% market standard in Mtskheta.
- Given the high prevalence of Flexible policies (65%), offering this can enhance booking appeal, especially during shoulder seasons.
- Regularly review your cancellation policy against competitors and market demand shifts in Mtskheta.
Mtskheta STR Booking Lead Time Analysis (2026)
Average Booking Lead Time by Month
Booking Lead Time Insights for Mtskheta
- The overall average booking lead time for vacation rentals in Mtskheta is 28 days.
- Guests book furthest in advance for stays during September (average 35 days), likely coinciding with peak travel demand or local events.
- The shortest booking windows occur for stays in November (average 6 days), indicating more last-minute travel plans during this time.
- Seasonally, Summer (29 days avg.) sees the longest lead times, while Winter (17 days avg.) has the shortest, reflecting typical travel planning cycles.
Recommendations for Hosts
- Use the overall average lead time (28 days) as a baseline for your pricing and availability strategy in Mtskheta.
- During November, focus on last-minute booking availability and promotions, as guests book with very short notice (6 days avg.).
- Target marketing efforts for the Summer season well in advance (at least 29 days) to capture early planners.
- Monitor your own booking lead times against these Mtskheta averages to identify opportunities for dynamic pricing adjustments.
Popular & Essential Airbnb Amenities in Mtskheta (2026)
Amenity Prevalence
Amenity Insights for Mtskheta
- Essential amenities in Mtskheta that guests expect include: Wifi. Lacking these (this) could significantly impact bookings.
- Popular amenities like Air conditioning, Free parking on premises, Kitchen are common but not universal. Offering these can provide a competitive edge.
Recommendations for Hosts
- Ensure your listing includes all essential amenities for Mtskheta: Wifi.
- Prioritize adding missing essentials: Wifi.
- Consider adding popular differentiators like Air conditioning or Free parking on premises to increase appeal.
- Highlight unique or less common amenities you offer (e.g., hot tub, dedicated workspace, EV charger) in your listing description and photos.
- Regularly check competitor amenities in Mtskheta to stay competitive.
Mtskheta Airbnb Guest Demographics & Profile Analysis (2026)
Guest Profile Summary for Mtskheta
- The typical guest profile for Airbnb in Mtskheta consists of predominantly international visitors (89%), with top international origins including Georgia, typically belonging to the Post-2000s (Gen Z/Alpha) group (50%), primarily speaking English or Russian.
- Domestic travelers account for 11.3% of guests.
- Key international markets include China (12.1%) and Georgia (11.3%).
- Top languages spoken are English (41.9%) followed by Russian (15.1%).
- A significant demographic segment is the Post-2000s (Gen Z/Alpha) group, representing 50% of guests.
Recommendations for Hosts
- Focus marketing internationally, particularly towards travelers from Georgia.
- Tailor amenities and listing descriptions to appeal to the dominant Post-2000s (Gen Z/Alpha) demographic (e.g., highlight fast WiFi, smart home features, local guides).
- Highlight unique local experiences or amenities relevant to the primary guest profile.
- Consider seasonal promotions aligned with peak travel times for key origin markets.
Nearby Short-Term Rental Market Comparison
How does the Mtskheta Airbnb market stack up against its neighbors? Compare key performance metrics like average monthly revenue, ADR, and occupancy rates in surrounding areas to understand the broader regional STR landscape.