Saint-André Airbnb Market Analysis 2026: Short Term Rental Data & Vacation Rental Statistics in Réunion, France
Is Airbnb profitable in Saint-André in 2026? Explore comprehensive Airbnb analytics for Saint-André, Réunion, France to uncover income potential. This 2026 STR market report for Saint-André, based on AirROI data from February 2025 to January 2026, reveals key trends in the niche market of 104 active listings.
Whether you're considering an Airbnb investment in Saint-André, optimizing your existing vacation rental, or exploring rental arbitrage opportunities, understanding the Saint-André Airbnb data is crucial. Leveraging the low regulation environment is key to maximizing your short term rental income potential. Let's dive into the specifics.
Key Saint-André Airbnb Performance Metrics Overview
Monthly Airbnb Revenue Variations & Income Potential in Saint-André (2026)
Understanding the monthly revenue variations for Airbnb listings in Saint-André is key to maximizing your short term rental income potential. Seasonality significantly impacts earnings. Our analysis, based on data from the past 12 months, shows that the peak revenue month for STRs in Saint-André is typically November, while February often presents the lowest earnings, highlighting opportunities for strategic pricing adjustments during shoulder and low seasons. Explore the typical Airbnb income in Saint-André across different performance tiers:
- Best-in-class properties (Top 10%) achieve $2,931+ monthly, often utilizing dynamic pricing and superior guest experiences.
- Strong performing properties (Top 25%) earn $2,043 or more, indicating effective management and desirable locations/amenities.
- Typical properties (Median) generate around $1,357 per month, representing the average market performance.
- Entry-level properties (Bottom 25%) see earnings around $772, often with potential for optimization.
Average Monthly Airbnb Earnings Trend in Saint-André
Saint-André Airbnb Occupancy Rate Trends (2026)
Maximize your bookings by understanding the Saint-André STR occupancy trends. Seasonal demand shifts significantly influence how often properties are booked. Typically, Novembersees the highest demand (peak season occupancy), while January experiences the lowest (low season). Effective strategies, like adjusting minimum stays or offering promotions, can boost occupancy during slower periods. Here's how different property tiers perform in Saint-André:
- Best-in-class properties (Top 10%) achieve 87%+ occupancy, indicating high desirability and potentially optimized availability.
- Strong performing properties (Top 25%) maintain 73% or higher occupancy, suggesting good market fit and guest satisfaction.
- Typical properties (Median) have an occupancy rate around 50%.
- Entry-level properties (Bottom 25%) average 27% occupancy, potentially facing higher vacancy.
Average Monthly Occupancy Rate Trend in Saint-André
Average Daily Rate (ADR) Airbnb Trends in Saint-André (2026)
Effective short term rental pricing strategy in Saint-André involves understanding monthly ADR fluctuations. The Average Daily Rate (ADR) for Airbnb in Saint-André typically peaks in August and dips lowest during February. Leveraging Airbnb dynamic pricing tools or strategies based on this seasonality can significantly boost revenue. Here's a look at the typical nightly rates achieved:
- Best-in-class properties (Top 10%) command rates of $192+ per night, often due to premium features or locations.
- Strong performing properties (Top 25%) achieve nightly rates of $128 or more.
- Typical properties (Median) charge around $88 per night.
- Entry-level properties (Bottom 25%) earn around $63 per night.
Average Daily Rate (ADR) Trend by Month in Saint-André
Get Live Saint-André Market Intelligence 👇

Explore Real-time Analytics
Airbnb Seasonality Analysis & Trends in Saint-André (2026)
Peak Season (November, July, October)
- Revenue averages $1,916 per month
- Occupancy rates average 57.9%
- Daily rates average $112
Shoulder Season
- Revenue averages $1,556 per month
- Occupancy maintains around 51.8%
- Daily rates hold near $110
Low Season (January, February, June)
- Revenue drops to average $1,189 per month
- Occupancy decreases to average 40.1%
- Daily rates adjust to average $110
Seasonality Insights for Saint-André
- The Airbnb seasonality in Saint-André shows moderate seasonality with distinct peak and low periods. While the sections above show seasonal averages, it's also insightful to look at the extremes:
- During the high season, the absolute peak month showcases Saint-André's highest earning potential, with monthly revenues capable of climbing to $2,073, occupancy reaching a high of 64.4%, and ADRs peaking at $114.
- Conversely, the slowest single month of the year, typically falling within the low season, marks the market's lowest point. In this month, revenue might dip to $1,133, occupancy could drop to 36.1%, and ADRs may adjust down to $106.
- Understanding both the seasonal averages and these monthly peaks and troughs in revenue, occupancy, and ADR is crucial for maximizing your Airbnb profit potential in Saint-André.
Seasonal Strategies for Maximizing Profit
- Peak Season: Maximize revenue through premium pricing and potentially longer minimum stays. Ensure high availability.
- Low Season: Offer competitive pricing, special promotions (e.g., extended stay discounts), and flexible cancellation policies. Target off-season travelers like remote workers or budget-conscious guests.
- Shoulder Seasons: Implement dynamic pricing that balances peak and low rates. Target weekend travelers or specific events. Offer slightly more flexible terms than peak season.
- Regularly analyze your own performance against these Saint-André seasonality benchmarks and adjust your pricing and availability strategy accordingly.
Best Areas for Airbnb Investment in Saint-André (2026)
Exploring the top neighborhoods for short-term rentals in Saint-André? This section highlights key areas, outlining why they are attractive for hosts and guests, along with notable local attractions. Consider these locations based on your target guest profile and investment strategy.
| Neighborhood / Area | Why Host Here? (Target Guests & Appeal) | Key Attractions & Landmarks |
|---|---|---|
| Saint-Denis | The capital of Réunion, offering a mix of cultural attractions, historic architecture, and vibrant markets. A great spot for tourists wanting to explore the island's culture and history. | La Réunion National Park, Barachois, Saint-Denis Market, Aquarium de La Réunion, Musée Léon Dierx, Theatre de Saint-Denis |
| Cilaos | Known for its stunning mountain scenery and hiking trails, Cilaos is a favorite destination for nature lovers and outdoor enthusiasts. Ideal for those looking to escape to the mountains. | Cirque de Cilaos, Lac de Cilaos, Hot Springs, Hiking Trails, Wine Route, Local Craft Shops |
| Saint-Gilles-les-Bains | A popular beach resort area known for its sandy beaches and water activities. Attracts families and beach lovers looking for relaxation and fun in the sun. | Boucan Canot Beach, La Saline Beach, Aquarium de La Réunion, Water sports, Restaurants and Bars, Le Maïdo mountain peak |
| La Saline-les-Bains | Famous for its beautiful beach and laid-back atmosphere, great for families and those seeking tranquility by the sea with local dining options. | La Saline Beach, Lagoon, Water Sports, Snorkeling, Local Cuisine, Sunset Views |
| Salazie | One of the island's cirques offering lush nature, waterfalls, and hiking. An ideal location for travelers seeking adventure and nature. | Voile de la Mariée Waterfall, Notre-Dame de la Paix, Hiking Trails, Local Creole Cuisine, Scenic Views, Cultural Sites |
| Saint-Pierre | The second largest city in Réunion offers beautiful beaches and a vibrant culture, making it a good base for exploring the southern part of the island. | Saint-Pierre Beach, Market and Local Products, Creole Houses, Cultural Events, Dining Options, Nearby Volcano |
| Etang-Salé | Known for its black sand beaches and protected areas, this locality is ideal for those looking for a quieter beach experience and proximity to nature. | Etang-Salé Beach, Protected Forests, Biodiversity, Recreational Activities, Tranquil Environment, Beach-front Restaurants |
| Plaine-des-Palmistes | Located in the highlands, this area is known for its cool climate and scenic views. Attracts those looking for a peaceful retreat in nature. | Forests and Hiking Trails, Local Fruit Markets, Tropical Gardens, Calm Atmosphere, Cultural Heritage Sites, Wildlife |
Understanding Airbnb License Requirements & STR Laws in Saint-André (2026)
While Saint-André, Réunion, France currently shows low STR regulations, specific Airbnb license requirements might still exist or change. Always verify the latest short term rental regulations and Airbnb license requirements directly with local government authorities for Saint-André to ensure full compliance before hosting.
(Source: AirROI data, 2026, finding no licensed listings among those analyzed)
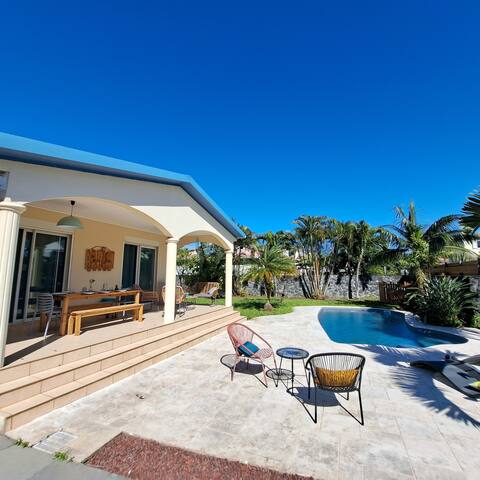
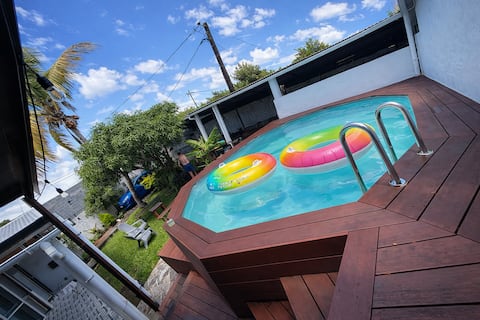
Top Performing Airbnb Properties in Saint-André (2026)
Benchmark your potential! Explore examples of top-performing Airbnb properties in Saint-Andrébased on Trailing Twelve Month (TTM) revenue. Analyze their characteristics, revenue, occupancy rate, and ADR to understand what drives success in this market.
Villa Floréale – 9 guests (8+1)
Entire Place • 4 bedrooms

Nice house with pool, jacuzzi and sauna
Entire Place • 3 bedrooms
Tropical Haven of Peace with Pool, 6 people
Entire Place • 3 bedrooms

Beautiful Villa Pool + Jacuzzi
Entire Place • 3 bedrooms

ti Trou Seasonal House
Entire Place • 5 bedrooms

Fully-equipped F2 apartment with parking and pool
Entire Place • 1 bedroom
Note: Performance varies based on location, size, amenities, seasonality, and management quality. Data reflects the past 12 months.
Top Performing Airbnb Hosts in Saint-André (2026)
Learn from the best! This table showcases top-performing Airbnb hosts in Saint-André based on the number of properties managed and estimated total revenue over the past year. Analyze their scale and performance metrics.
| Host Name | Properties | Grossing Revenue | Stay Reviews | Avg Rating |
|---|---|---|---|---|
| Elisabeth | 2 | $53,682 | 315 | 4.89/5.0 |
| Marie | 2 | $52,773 | 219 | 4.84/5.0 |
| Kévin | 5 | $45,549 | 128 | 4.68/5.0 |
| Lydie | 1 | $41,722 | 21 | 5.00/5.0 |
| Axel | 1 | $41,661 | 120 | 4.90/5.0 |
| Linda | 1 | $40,398 | 27 | 4.67/5.0 |
| Rodolphe | 1 | $38,391 | 25 | 4.72/5.0 |
| Corinne | 2 | $37,575 | 62 | 4.96/5.0 |
| Cyril | 2 | $36,166 | 93 | 4.79/5.0 |
| Jean Max | 2 | $33,657 | 88 | 4.68/5.0 |
Analyzing the strategies of top hosts, such as their property selection, pricing, and guest communication, can offer valuable lessons for optimizing your own Airbnb operations in Saint-André.
Dive Deeper: Advanced Saint-André STR Market Data (2026)
Ready to unlock more insights? AirROI provides access to advanced metrics and comprehensive Airbnb data for Saint-André. Explore detailed analytics beyond this report to refine your investment strategy, optimize pricing, and maximize your vacation rental profits.
Explore Advanced MetricsSaint-André Short-Term Rental Market Composition (2026): Property & Room Types
Room Type Distribution
Property Type Distribution
Market Composition Insights for Saint-André
- The Saint-André Airbnb market composition is heavily skewed towards Entire Home/Apt listings, which make up 84.6% of the 104 active rentals. This indicates strong guest preference for privacy and space.
- Looking at the property type distribution in Saint-André, House properties are the most common (81.7%), reflecting the local real estate landscape.
- Houses represent a significant 81.7% portion, catering likely to families or larger groups.
- Smaller segments like hotel/boutique, others (combined 3.8%) offer potential for unique stay experiences.
Saint-André Airbnb Room Capacity Analysis (2026): Bedroom Distribution
Distribution of Listings by Number of Bedrooms
Room Capacity Insights for Saint-André
- The dominant room capacity in Saint-André is 1 bedroom listings, making up 30.8% of the market. This suggests a strong demand for properties suitable for couples or solo travelers.
- Together, 1 bedroom and 3 bedrooms properties represent 53.9% of the active Airbnb listings in Saint-André, indicating a high concentration in these sizes.
- A significant 31.7% of listings offer 3+ bedrooms, catering to larger groups and families seeking more space in Saint-André.
Saint-André Vacation Rental Guest Capacity Trends (2026)
Distribution of Listings by Guest Capacity
Guest Capacity Insights for Saint-André
- The most common guest capacity trend in Saint-André vacation rentals is listings accommodating 2 guests (23.1%). This suggests the primary traveler segment is likely couples or solo travelers.
- Properties designed for 2 guests and 6 guests dominate the Saint-André STR market, accounting for 43.3% of listings.
- 36.6% of properties accommodate 6+ guests, serving the market segment for larger families or group travel in Saint-André.
- On average, properties in Saint-André are equipped to host 4.0 guests.
Saint-André Airbnb Booking Patterns (2026): Available vs. Booked Days
Available Days Distribution
Booked Days Distribution
Booking Pattern Insights for Saint-André
- The most common availability pattern in Saint-André falls within the 271-366 days range, representing 33.7% of listings. This suggests many properties have significant open periods on their calendars.
- Approximately 65.4% of listings show high availability (181+ days open annually), indicating potential for increased bookings or specific owner usage patterns.
- For booked days, the 91-180 days range is most frequent in Saint-André (32.7%), reflecting common guest stay durations or potential owner blocking patterns.
- A notable 35.6% of properties secure long booking periods (181+ days booked per year), highlighting successful long-term rental strategies or significant owner usage.
Saint-André Airbnb Minimum Stay Requirements Analysis
Distribution of Listings by Minimum Night Requirement
1 Night
23 listings
22.1% of total
2 Nights
39 listings
37.5% of total
3 Nights
11 listings
10.6% of total
4-6 Nights
14 listings
13.5% of total
7-29 Nights
1 listings
1% of total
30+ Nights
16 listings
15.4% of total
Key Insights
- The most prevalent minimum stay requirement in Saint-André is 2 Nights, adopted by 37.5% of listings. This highlights the market's preference for shorter, flexible bookings.
- A significant segment (15.4%) caters to monthly stays (30+ nights) in Saint-André, pointing to opportunities in the extended-stay market.
Recommendations
- Align with the market by considering a 2 Nights minimum stay, as 37.5% of Saint-André hosts use this setting.
- If feasible, allowing 1-night stays, especially midweek or during low season, could capture last-minute bookings, as only 22.1% currently do.
- Explore offering discounts for stays of 30+ nights to attract the 15.4% of the market seeking extended stays.
- Adjust minimum nights based on seasonality – potentially shorter during low season and longer during peak demand periods in Saint-André.
Saint-André Airbnb Cancellation Policy Trends Analysis (2026)
Limited
1 listings
1% of total
Flexible
45 listings
43.7% of total
Moderate
30 listings
29.1% of total
Firm
24 listings
23.3% of total
Strict
3 listings
2.9% of total
Cancellation Policy Insights for Saint-André
- The prevailing Airbnb cancellation policy trend in Saint-André is Flexible, used by 43.7% of listings.
- The market strongly favors guest-friendly terms, with 72.8% of listings offering Flexible or Moderate policies. This suggests guests in Saint-André may expect booking flexibility.
- Strict cancellation policies are quite rare (2.9%), potentially making listings with this policy less competitive unless justified by high demand or property type.
Recommendations for Hosts
- Consider adopting a Flexible policy to align with the 43.7% market standard in Saint-André.
- Using a Strict policy might deter some guests, as only 2.9% of listings use it. Evaluate if potential revenue protection outweighs possible lower booking rates.
- Regularly review your cancellation policy against competitors and market demand shifts in Saint-André.
Saint-André STR Booking Lead Time Analysis (2026)
Average Booking Lead Time by Month
Booking Lead Time Insights for Saint-André
- The overall average booking lead time for vacation rentals in Saint-André is 69 days.
- Guests book furthest in advance for stays during October (average 100 days), likely coinciding with peak travel demand or local events.
- The shortest booking windows occur for stays in February (average 31 days), indicating more last-minute travel plans during this time.
- Seasonally, Fall (95 days avg.) sees the longest lead times, while Spring (45 days avg.) has the shortest, reflecting typical travel planning cycles.
Recommendations for Hosts
- Use the overall average lead time (69 days) as a baseline for your pricing and availability strategy in Saint-André.
- For October stays, consider implementing length-of-stay discounts or slightly higher rates for bookings made less than 100 days out to capitalize on advance planning.
- Target marketing efforts for the Fall season well in advance (at least 95 days) to capture early planners.
- Monitor your own booking lead times against these Saint-André averages to identify opportunities for dynamic pricing adjustments.
Popular & Essential Airbnb Amenities in Saint-André (2026)
Amenity Prevalence
Amenity Insights for Saint-André
- Essential amenities in Saint-André that guests expect include: Wifi, Free parking on premises. Lacking these (any) could significantly impact bookings.
- Popular amenities like Kitchen, Hot water, TV are common but not universal. Offering these can provide a competitive edge.
Recommendations for Hosts
- Ensure your listing includes all essential amenities for Saint-André: Wifi, Free parking on premises.
- Prioritize adding missing essentials: Wifi, Free parking on premises.
- Consider adding popular differentiators like Kitchen or Hot water to increase appeal.
- Highlight unique or less common amenities you offer (e.g., hot tub, dedicated workspace, EV charger) in your listing description and photos.
- Regularly check competitor amenities in Saint-André to stay competitive.
Saint-André Airbnb Guest Demographics & Profile Analysis (2026)
Guest Profile Summary for Saint-André
- The typical guest profile for Airbnb in Saint-André consists of primarily domestic travelers (81%), often arriving from nearby Paris, typically belonging to the Post-2000s (Gen Z/Alpha) group (50%), primarily speaking French or English.
- Domestic travelers account for 81.4% of guests.
- Key international markets include France (81.4%) and Réunion (5.7%).
- Top languages spoken are French (45.9%) followed by English (34.6%).
- A significant demographic segment is the Post-2000s (Gen Z/Alpha) group, representing 50% of guests.
Recommendations for Hosts
- Target domestic marketing efforts towards travelers from Paris and Lyon.
- Tailor amenities and listing descriptions to appeal to the dominant Post-2000s (Gen Z/Alpha) demographic (e.g., highlight fast WiFi, smart home features, local guides).
- Highlight unique local experiences or amenities relevant to the primary guest profile.
- Consider seasonal promotions aligned with peak travel times for key origin markets.
Nearby Short-Term Rental Market Comparison
How does the Saint-André Airbnb market stack up against its neighbors? Compare key performance metrics like average monthly revenue, ADR, and occupancy rates in surrounding areas to understand the broader regional STR landscape.
| Market | Active Properties | Monthly Revenue | Daily Rate | Avg. Occupancy |
|---|---|---|---|---|
| Les Trois-Bassins | 66 | $1,947 | $194.53 | 45% |
| Cilaos | 159 | $1,780 | $144.06 | 46% |
| Salazie | 61 | $1,730 | $130.35 | 49% |
| Petite-Île | 10 | $1,705 | $222.46 | 45% |
| Saint-Paul | 1,777 | $1,660 | $161.67 | 48% |
| Petite-Île | 128 | $1,441 | $141.20 | 42% |
| L'Étang-Salé | 233 | $1,434 | $146.46 | 47% |
| Saint-Leu | 578 | $1,417 | $134.84 | 48% |
| Saint-Joseph | 294 | $1,398 | $138.22 | 42% |
| Saint Pierre | 36 | $1,390 | $145.65 | 46% |