Le Pouliguen Airbnb Market Analysis 2026: Short Term Rental Data & Vacation Rental Statistics in Pays de la Loire, France
Is Airbnb profitable in Le Pouliguen in 2026? Explore comprehensive Airbnb analytics for Le Pouliguen, Pays de la Loire, France to uncover income potential. This 2026 STR market report for Le Pouliguen, based on AirROI data from February 2025 to January 2026, reveals key trends in the market of 316 active listings.
Whether you're considering an Airbnb investment in Le Pouliguen, optimizing your existing vacation rental, or exploring rental arbitrage opportunities, understanding the Le Pouliguen Airbnb data is crucial. Navigating the high regulation landscape is key to maximizing your short term rental income potential. Let's dive into the specifics.
Key Le Pouliguen Airbnb Performance Metrics Overview
Monthly Airbnb Revenue Variations & Income Potential in Le Pouliguen (2026)
Understanding the monthly revenue variations for Airbnb listings in Le Pouliguen is key to maximizing your short term rental income potential. Seasonality significantly impacts earnings. Our analysis, based on data from the past 12 months, shows that the peak revenue month for STRs in Le Pouliguen is typically August, while January often presents the lowest earnings, highlighting opportunities for strategic pricing adjustments during shoulder and low seasons. Explore the typical Airbnb income in Le Pouliguen across different performance tiers:
- Best-in-class properties (Top 10%) achieve $3,161+ monthly, often utilizing dynamic pricing and superior guest experiences.
- Strong performing properties (Top 25%) earn $1,991 or more, indicating effective management and desirable locations/amenities.
- Typical properties (Median) generate around $1,164 per month, representing the average market performance.
- Entry-level properties (Bottom 25%) see earnings around $657, often with potential for optimization.
Average Monthly Airbnb Earnings Trend in Le Pouliguen
Le Pouliguen Airbnb Occupancy Rate Trends (2026)
Maximize your bookings by understanding the Le Pouliguen STR occupancy trends. Seasonal demand shifts significantly influence how often properties are booked. Typically, Augustsees the highest demand (peak season occupancy), while January experiences the lowest (low season). Effective strategies, like adjusting minimum stays or offering promotions, can boost occupancy during slower periods. Here's how different property tiers perform in Le Pouliguen:
- Best-in-class properties (Top 10%) achieve 65%+ occupancy, indicating high desirability and potentially optimized availability.
- Strong performing properties (Top 25%) maintain 48% or higher occupancy, suggesting good market fit and guest satisfaction.
- Typical properties (Median) have an occupancy rate around 31%.
- Entry-level properties (Bottom 25%) average 17% occupancy, potentially facing higher vacancy.
Average Monthly Occupancy Rate Trend in Le Pouliguen
Average Daily Rate (ADR) Airbnb Trends in Le Pouliguen (2026)
Effective short term rental pricing strategy in Le Pouliguen involves understanding monthly ADR fluctuations. The Average Daily Rate (ADR) for Airbnb in Le Pouliguen typically peaks in July and dips lowest during March. Leveraging Airbnb dynamic pricing tools or strategies based on this seasonality can significantly boost revenue. Here's a look at the typical nightly rates achieved:
- Best-in-class properties (Top 10%) command rates of $299+ per night, often due to premium features or locations.
- Strong performing properties (Top 25%) achieve nightly rates of $188 or more.
- Typical properties (Median) charge around $127 per night.
- Entry-level properties (Bottom 25%) earn around $93 per night.
Average Daily Rate (ADR) Trend by Month in Le Pouliguen
Get Live Le Pouliguen Market Intelligence 👇

Explore Real-time Analytics
Airbnb Seasonality Analysis & Trends in Le Pouliguen (2026)
Peak Season (August, July, June)
- Revenue averages $2,717 per month
- Occupancy rates average 53.0%
- Daily rates average $175
Shoulder Season
- Revenue averages $1,323 per month
- Occupancy maintains around 31.1%
- Daily rates hold near $162
Low Season (January, February, November)
- Revenue drops to average $939 per month
- Occupancy decreases to average 22.8%
- Daily rates adjust to average $161
Seasonality Insights for Le Pouliguen
- The Airbnb seasonality in Le Pouliguen shows highly seasonal trends requiring careful strategy. While the sections above show seasonal averages, it's also insightful to look at the extremes:
- During the high season, the absolute peak month showcases Le Pouliguen's highest earning potential, with monthly revenues capable of climbing to $3,743, occupancy reaching a high of 71.1%, and ADRs peaking at $179.
- Conversely, the slowest single month of the year, typically falling within the low season, marks the market's lowest point. In this month, revenue might dip to $784, occupancy could drop to 17.3%, and ADRs may adjust down to $150.
- Understanding both the seasonal averages and these monthly peaks and troughs in revenue, occupancy, and ADR is crucial for maximizing your Airbnb profit potential in Le Pouliguen.
Seasonal Strategies for Maximizing Profit
- Peak Season: Maximize revenue through premium pricing and potentially longer minimum stays. Ensure high availability.
- Low Season: Offer competitive pricing, special promotions (e.g., extended stay discounts), and flexible cancellation policies. Target off-season travelers like remote workers or budget-conscious guests.
- Shoulder Seasons: Implement dynamic pricing that balances peak and low rates. Target weekend travelers or specific events. Offer slightly more flexible terms than peak season.
- Regularly analyze your own performance against these Le Pouliguen seasonality benchmarks and adjust your pricing and availability strategy accordingly.
Best Areas for Airbnb Investment in Le Pouliguen (2026)
Exploring the top neighborhoods for short-term rentals in Le Pouliguen? This section highlights key areas, outlining why they are attractive for hosts and guests, along with notable local attractions. Consider these locations based on your target guest profile and investment strategy.
| Neighborhood / Area | Why Host Here? (Target Guests & Appeal) | Key Attractions & Landmarks |
|---|---|---|
| Plage de la Baie | A scenic beach area in Le Pouliguen known for its sandy shores and family-friendly atmosphere. It's perfect for tourists looking for leisure activities and water sports. | Beachfront promenade, Watersports rentals, Family-friendly parks, Restaurants with sea views, Sunbathing spots |
| Port de La Turballe | A vibrant port area that attracts visitors with its seafood market and picturesque harbor. Great for tourists interested in local culture and seafood cuisine. | Fishing harbor, Seafood restaurants, Boat tours, Local markets, Waterfront views |
| Les Noës | A quieter residential area that offers a peaceful retreat while still being close to the beaches. Ideal for those looking for relaxing stays away from the hustle and bustle. | Nature trails, Parks, Local shops, Community events, Nearby beaches |
| Saint-Michel-Chef-Chef | Just a short drive from Le Pouliguen, this area is popular for its sandy beaches and family activities. A favorite spot for families and tourists alike. | Sandy beaches, Beach clubs, Family fun parks, Cycle paths, Local fairs |
| Quiberon | Known for its stunning coastline and scenic landscapes, Quiberon is a popular destination for tourists looking to explore the beauty of the French Atlantic coast. | Coastal trails, Seaview restaurants, Marine activities, Wild beaches, Local historical sites |
| Batz-sur-Mer | A charming seaside village with a laid-back vibe, known for its beautiful beaches and hiking trails. Perfect for nature lovers and those seeking tranquility. | Beach areas, Nature reserves, Walking paths, Cafés and local shops, Scenic viewpoints |
| La Baule-Escoublac | Famous for its beautiful beach and vibrant nightlife, La Baule is a hotspot for tourists looking for luxury and entertainment in a stunning setting. | La Baule beach, Nightclubs, Upscale restaurants, Shopping streets, Spa centers |
| Piriac-sur-Mer | A picturesque coastal town that offers a unique blend of beaches and historic charm, ideal for tourists interested in both relaxation and exploration. | Historic town center, Seafront promenades, Art galleries, Local festivals, Beautiful coastline |
Understanding Airbnb License Requirements & STR Laws in Le Pouliguen (2026)
Yes, Le Pouliguen, Pays de la Loire, France enforces high STR regulations. Obtaining a license and ensuring compliance is almost certainly required according to current 2026 STR laws. Always verify the latest short term rental regulations and Airbnb license requirements directly with local government authorities for Le Pouliguen to ensure full compliance before hosting.
(Source: AirROI data, 2026, based on 89% licensed listings)
Top Performing Airbnb Properties in Le Pouliguen (2026)
Benchmark your potential! Explore examples of top-performing Airbnb properties in Le Pouliguenbased on Trailing Twelve Month (TTM) revenue. Analyze their characteristics, revenue, occupancy rate, and ADR to understand what drives success in this market.

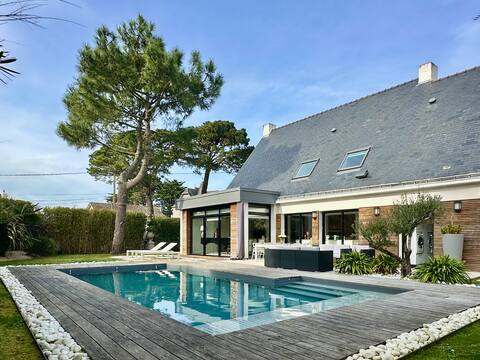
"Bel Horizon" Waterfront Villa
Entire Place • 4 bedrooms

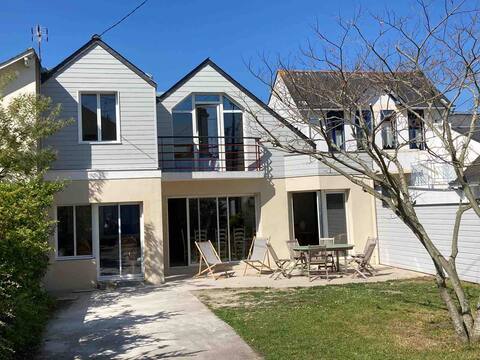
Contemporary villa
Entire Place • 5 bedrooms
Favorite for this stunning family villa
Entire Place • 4 bedrooms

Spacious Villa near beaches in Pouliguen
Entire Place • 6 bedrooms
Villa in the city center, 800 meters from the beach
Entire Place • 5 bedrooms

Close to the beach and the center of Pouliguen: everything within walking distance
Entire Place • 4 bedrooms
Note: Performance varies based on location, size, amenities, seasonality, and management quality. Data reflects the past 12 months.
Top Performing Airbnb Hosts in Le Pouliguen (2026)
Learn from the best! This table showcases top-performing Airbnb hosts in Le Pouliguen based on the number of properties managed and estimated total revenue over the past year. Analyze their scale and performance metrics.
| Host Name | Properties | Grossing Revenue | Stay Reviews | Avg Rating |
|---|---|---|---|---|
| L'Équipe Hoomy Conciergerie | 19 | $173,987 | 127 | 4.68/5.0 |
| E.C Conciergerie | 11 | $131,654 | 242 | 4.74/5.0 |
| Fanny Et Amandine | 9 | $114,098 | 36 | 4.59/5.0 |
| Victoria | 1 | $109,345 | 14 | 5.00/5.0 |
| Cécilia | 3 | $63,386 | 54 | 4.94/5.0 |
| Alexandra | 3 | $55,841 | 31 | 4.88/5.0 |
| Coutant | 1 | $53,540 | 8 | 5.00/5.0 |
| Laurence | 2 | $52,985 | 47 | 4.89/5.0 |
| Céline | 3 | $50,129 | 23 | 4.92/5.0 |
| Tracy | 2 | $45,077 | 62 | 4.99/5.0 |
Analyzing the strategies of top hosts, such as their property selection, pricing, and guest communication, can offer valuable lessons for optimizing your own Airbnb operations in Le Pouliguen.
Dive Deeper: Advanced Le Pouliguen STR Market Data (2026)
Ready to unlock more insights? AirROI provides access to advanced metrics and comprehensive Airbnb data for Le Pouliguen. Explore detailed analytics beyond this report to refine your investment strategy, optimize pricing, and maximize your vacation rental profits.
Explore Advanced MetricsLe Pouliguen Short-Term Rental Market Composition (2026): Property & Room Types
Room Type Distribution
Property Type Distribution
Market Composition Insights for Le Pouliguen
- The Le Pouliguen Airbnb market composition is heavily skewed towards Entire Home/Apt listings, which make up 97.8% of the 316 active rentals. This indicates strong guest preference for privacy and space.
- Looking at the property type distribution in Le Pouliguen, Apartment/Condo properties are the most common (52.8%), reflecting the local real estate landscape.
- Houses represent a significant 44.6% portion, catering likely to families or larger groups.
- Smaller segments like hotel/boutique, others, outdoor/unique (combined 2.5%) offer potential for unique stay experiences.
Le Pouliguen Airbnb Room Capacity Analysis (2026): Bedroom Distribution
Distribution of Listings by Number of Bedrooms
Room Capacity Insights for Le Pouliguen
- The dominant room capacity in Le Pouliguen is 2 bedrooms listings, making up 33.9% of the market. This suggests a strong demand for properties suitable for couples or solo travelers.
- Together, 2 bedrooms and 1 bedroom properties represent 58.9% of the active Airbnb listings in Le Pouliguen, indicating a high concentration in these sizes.
- A significant 30.7% of listings offer 3+ bedrooms, catering to larger groups and families seeking more space in Le Pouliguen.
Le Pouliguen Vacation Rental Guest Capacity Trends (2026)
Distribution of Listings by Guest Capacity
Guest Capacity Insights for Le Pouliguen
- The most common guest capacity trend in Le Pouliguen vacation rentals is listings accommodating 4 guests (32.9%). This suggests the primary traveler segment is likely small families or groups.
- Properties designed for 4 guests and 6 guests dominate the Le Pouliguen STR market, accounting for 50.9% of listings.
- 38.0% of properties accommodate 6+ guests, serving the market segment for larger families or group travel in Le Pouliguen.
- On average, properties in Le Pouliguen are equipped to host 4.8 guests.
Le Pouliguen Airbnb Booking Patterns (2026): Available vs. Booked Days
Available Days Distribution
Booked Days Distribution
Booking Pattern Insights for Le Pouliguen
- The most common availability pattern in Le Pouliguen falls within the 271-366 days range, representing 62% of listings. This suggests many properties have significant open periods on their calendars.
- Approximately 93.0% of listings show high availability (181+ days open annually), indicating potential for increased bookings or specific owner usage patterns.
- For booked days, the 31-90 days range is most frequent in Le Pouliguen (41.1%), reflecting common guest stay durations or potential owner blocking patterns.
- A notable 7.9% of properties secure long booking periods (181+ days booked per year), highlighting successful long-term rental strategies or significant owner usage.
Le Pouliguen Airbnb Minimum Stay Requirements Analysis
Distribution of Listings by Minimum Night Requirement
1 Night
10 listings
3.2% of total
2 Nights
42 listings
13.3% of total
3 Nights
21 listings
6.6% of total
4-6 Nights
50 listings
15.8% of total
7-29 Nights
24 listings
7.6% of total
30+ Nights
169 listings
53.5% of total
Key Insights
- The most prevalent minimum stay requirement in Le Pouliguen is 30+ Nights, adopted by 53.5% of listings. This highlights the market's preference for longer commitments.
- Very short stays (1-2 nights) are less common (16.5%), suggesting hosts prefer slightly longer bookings to optimize turnover.
- A significant segment (53.5%) caters to monthly stays (30+ nights) in Le Pouliguen, pointing to opportunities in the extended-stay market.
Recommendations
- Align with the market by considering a 30+ Nights minimum stay, as 53.5% of Le Pouliguen hosts use this setting.
- If feasible, allowing 1-night stays, especially midweek or during low season, could capture last-minute bookings, as only 3.2% currently do.
- Explore offering discounts for stays of 30+ nights to attract the 53.5% of the market seeking extended stays.
- Adjust minimum nights based on seasonality – potentially shorter during low season and longer during peak demand periods in Le Pouliguen.
Le Pouliguen Airbnb Cancellation Policy Trends Analysis (2026)
Super Strict 30 Days
1 listings
0.3% of total
Limited
3 listings
0.9% of total
Flexible
64 listings
20.3% of total
Moderate
68 listings
21.5% of total
Firm
134 listings
42.4% of total
Strict
46 listings
14.6% of total
Cancellation Policy Insights for Le Pouliguen
- The prevailing Airbnb cancellation policy trend in Le Pouliguen is Firm, used by 42.4% of listings.
- A majority (57.0%) of hosts in Le Pouliguen utilize Firm or Strict policies, indicating a market where hosts prioritize booking security.
Recommendations for Hosts
- Consider adopting a Firm policy to align with the 42.4% market standard in Le Pouliguen.
- Using a Strict policy might deter some guests, as only 14.6% of listings use it. Evaluate if potential revenue protection outweighs possible lower booking rates.
- Regularly review your cancellation policy against competitors and market demand shifts in Le Pouliguen.
Le Pouliguen STR Booking Lead Time Analysis (2026)
Average Booking Lead Time by Month
Booking Lead Time Insights for Le Pouliguen
- The overall average booking lead time for vacation rentals in Le Pouliguen is 53 days.
- Guests book furthest in advance for stays during August (average 95 days), likely coinciding with peak travel demand or local events.
- The shortest booking windows occur for stays in February (average 17 days), indicating more last-minute travel plans during this time.
- Seasonally, Summer (71 days avg.) sees the longest lead times, while Winter (29 days avg.) has the shortest, reflecting typical travel planning cycles.
Recommendations for Hosts
- Use the overall average lead time (53 days) as a baseline for your pricing and availability strategy in Le Pouliguen.
- For August stays, consider implementing length-of-stay discounts or slightly higher rates for bookings made less than 95 days out to capitalize on advance planning.
- Target marketing efforts for the Summer season well in advance (at least 71 days) to capture early planners.
- Monitor your own booking lead times against these Le Pouliguen averages to identify opportunities for dynamic pricing adjustments.
Popular & Essential Airbnb Amenities in Le Pouliguen (2026)
Amenity Prevalence
Amenity Insights for Le Pouliguen
- Essential amenities in Le Pouliguen that guests expect include: Kitchen. Lacking these (this) could significantly impact bookings.
- Popular amenities like Heating, TV, Refrigerator are common but not universal. Offering these can provide a competitive edge.
Recommendations for Hosts
- Ensure your listing includes all essential amenities for Le Pouliguen: Kitchen.
- Prioritize adding missing essentials: Kitchen.
- Consider adding popular differentiators like Heating or TV to increase appeal.
- Highlight unique or less common amenities you offer (e.g., hot tub, dedicated workspace, EV charger) in your listing description and photos.
- Regularly check competitor amenities in Le Pouliguen to stay competitive.
Le Pouliguen Airbnb Guest Demographics & Profile Analysis (2026)
Guest Profile Summary for Le Pouliguen
- The typical guest profile for Airbnb in Le Pouliguen consists of primarily domestic travelers (93%), often arriving from nearby Paris, typically belonging to the Post-2000s (Gen Z/Alpha) group (50%), primarily speaking French or English.
- Domestic travelers account for 93.3% of guests.
- Key international markets include France (93.3%) and United Kingdom (1.2%).
- Top languages spoken are French (45%) followed by English (34.2%).
- A significant demographic segment is the Post-2000s (Gen Z/Alpha) group, representing 50% of guests.
Recommendations for Hosts
- Target domestic marketing efforts towards travelers from Paris and Nantes.
- Tailor amenities and listing descriptions to appeal to the dominant Post-2000s (Gen Z/Alpha) demographic (e.g., highlight fast WiFi, smart home features, local guides).
- Highlight unique local experiences or amenities relevant to the primary guest profile.
- Consider seasonal promotions aligned with peak travel times for key origin markets.
Nearby Short-Term Rental Market Comparison
How does the Le Pouliguen Airbnb market stack up against its neighbors? Compare key performance metrics like average monthly revenue, ADR, and occupancy rates in surrounding areas to understand the broader regional STR landscape.
| Market | Active Properties | Monthly Revenue | Daily Rate | Avg. Occupancy |
|---|---|---|---|---|
| Donges | 12 | $3,715 | $297.19 | 43% |
| Servon | 10 | $2,565 | $202.01 | 51% |
| Croix-Chapeau | 12 | $2,532 | $224.85 | 45% |
| Lanmodez | 18 | $2,492 | $234.53 | 40% |
| Le Bois-Plage-en-Ré | 321 | $2,457 | $318.28 | 42% |
| Sainte-Florence | 10 | $2,413 | $179.27 | 52% |
| Île-de-Bréhat | 49 | $2,373 | $230.16 | 45% |
| Plélan-le-Petit | 13 | $2,358 | $204.12 | 39% |
| La Flotte | 421 | $2,336 | $242.46 | 44% |
| Mouilleron-le-Captif | 17 | $2,197 | $195.86 | 45% |