Villefort Airbnb Market Analysis 2026: Short Term Rental Data & Vacation Rental Statistics in Occitania, France
Is Airbnb profitable in Villefort in 2026? Explore comprehensive Airbnb analytics for Villefort, Occitania, France to uncover income potential. This 2026 STR market report for Villefort, based on AirROI data from February 2025 to January 2026, reveals key trends in the niche market of 28 active listings.
Whether you're considering an Airbnb investment in Villefort, optimizing your existing vacation rental, or exploring rental arbitrage opportunities, understanding the Villefort Airbnb data is crucial. Understanding the local regulations is key to maximizing your short term rental income potential. Let's dive into the specifics.
Key Villefort Airbnb Performance Metrics Overview
Monthly Airbnb Revenue Variations & Income Potential in Villefort (2026)
Understanding the monthly revenue variations for Airbnb listings in Villefort is key to maximizing your short term rental income potential. Seasonality significantly impacts earnings. Our analysis, based on data from the past 12 months, shows that the peak revenue month for STRs in Villefort is typically August, while January often presents the lowest earnings, highlighting opportunities for strategic pricing adjustments during shoulder and low seasons. Explore the typical Airbnb income in Villefort across different performance tiers:
- Best-in-class properties (Top 10%) achieve $2,182+ monthly, often utilizing dynamic pricing and superior guest experiences.
- Strong performing properties (Top 25%) earn $1,466 or more, indicating effective management and desirable locations/amenities.
- Typical properties (Median) generate around $783 per month, representing the average market performance.
- Entry-level properties (Bottom 25%) see earnings around $436, often with potential for optimization.
Average Monthly Airbnb Earnings Trend in Villefort
Villefort Airbnb Occupancy Rate Trends (2026)
Maximize your bookings by understanding the Villefort STR occupancy trends. Seasonal demand shifts significantly influence how often properties are booked. Typically, Augustsees the highest demand (peak season occupancy), while January experiences the lowest (low season). Effective strategies, like adjusting minimum stays or offering promotions, can boost occupancy during slower periods. Here's how different property tiers perform in Villefort:
- Best-in-class properties (Top 10%) achieve 61%+ occupancy, indicating high desirability and potentially optimized availability.
- Strong performing properties (Top 25%) maintain 40% or higher occupancy, suggesting good market fit and guest satisfaction.
- Typical properties (Median) have an occupancy rate around 24%.
- Entry-level properties (Bottom 25%) average 14% occupancy, potentially facing higher vacancy.
Average Monthly Occupancy Rate Trend in Villefort
Average Daily Rate (ADR) Airbnb Trends in Villefort (2026)
Effective short term rental pricing strategy in Villefort involves understanding monthly ADR fluctuations. The Average Daily Rate (ADR) for Airbnb in Villefort typically peaks in August and dips lowest during February. Leveraging Airbnb dynamic pricing tools or strategies based on this seasonality can significantly boost revenue. Here's a look at the typical nightly rates achieved:
- Best-in-class properties (Top 10%) command rates of $242+ per night, often due to premium features or locations.
- Strong performing properties (Top 25%) achieve nightly rates of $130 or more.
- Typical properties (Median) charge around $104 per night.
- Entry-level properties (Bottom 25%) earn around $80 per night.
Average Daily Rate (ADR) Trend by Month in Villefort
Get Live Villefort Market Intelligence 👇

Explore Real-time Analytics
Airbnb Seasonality Analysis & Trends in Villefort (2026)
Peak Season (August, July, June)
- Revenue averages $1,886 per month
- Occupancy rates average 44.7%
- Daily rates average $138
Shoulder Season
- Revenue averages $874 per month
- Occupancy maintains around 26.1%
- Daily rates hold near $127
Low Season (January, November, December)
- Revenue drops to average $532 per month
- Occupancy decreases to average 21.7%
- Daily rates adjust to average $133
Seasonality Insights for Villefort
- The Airbnb seasonality in Villefort shows highly seasonal trends requiring careful strategy. While the sections above show seasonal averages, it's also insightful to look at the extremes:
- During the high season, the absolute peak month showcases Villefort's highest earning potential, with monthly revenues capable of climbing to $2,550, occupancy reaching a high of 62.1%, and ADRs peaking at $143.
- Conversely, the slowest single month of the year, typically falling within the low season, marks the market's lowest point. In this month, revenue might dip to $423, occupancy could drop to 18.1%, and ADRs may adjust down to $118.
- Understanding both the seasonal averages and these monthly peaks and troughs in revenue, occupancy, and ADR is crucial for maximizing your Airbnb profit potential in Villefort.
Seasonal Strategies for Maximizing Profit
- Peak Season: Maximize revenue through premium pricing and potentially longer minimum stays. Ensure high availability.
- Low Season: Offer competitive pricing, special promotions (e.g., extended stay discounts), and flexible cancellation policies. Target off-season travelers like remote workers or budget-conscious guests.
- Shoulder Seasons: Implement dynamic pricing that balances peak and low rates. Target weekend travelers or specific events. Offer slightly more flexible terms than peak season.
- Regularly analyze your own performance against these Villefort seasonality benchmarks and adjust your pricing and availability strategy accordingly.
Best Areas for Airbnb Investment in Villefort (2026)
Exploring the top neighborhoods for short-term rentals in Villefort? This section highlights key areas, outlining why they are attractive for hosts and guests, along with notable local attractions. Consider these locations based on your target guest profile and investment strategy.
| Neighborhood / Area | Why Host Here? (Target Guests & Appeal) | Key Attractions & Landmarks |
|---|---|---|
| Villefort Old Town | Charming medieval town with picturesque streets and historical significance. Ideally located near attractions that draw visitors interested in history and culture. | Saint George's Church, Château de Villefort, Local artisan shops, Festival of the Chestnut |
| Lac de Villefort | Beautiful lake surrounded by natural scenery, ideal for nature lovers and outdoor activities. Offers opportunities for hiking, swimming, and fishing. | Water sports, Lakeside restaurants, Nature trails, Picnic areas, Camping options |
| Cevennes National Park | Stunning natural park known for its diverse flora and fauna. Perfect for tourists seeking adventure and exploration in nature. | Hiking trails, Scenic viewpoints, Wildlife watching, Historical paths, Local flora |
| Loch Ness of France | Adventure tourism destination known for its mystical waters and outdoor activities. Attracts visitors looking to explore unique natural attractions. | Kayaking, Fishing, Nature exploration, Photography spots |
| Sainte-Cécile-d'Andorge | Quaint village near Villefort with close-knit community feel. Offers local experiences and authenticity for visitors looking to escape the hustle. | Local markets, Cultural festivals, Gorges of the Chassezac |
| Barrage de Villefort | A large dam that provides picturesque views and recreational activities. Great spot for tourists who appreciate engineering marvels and nature combined. | Scenic walks, Fishing, Boat rentals, Photography opportunities |
| Chamborigaud | Nearby village known for its tranquility and access to scenic routes. Ideal for those looking for peaceful retreats close to nature. | Scenic drives, Outdoor activities, Historic village charm |
| Cévennes Wine Region | Region known for its vineyards and wine production. Attracts wine enthusiasts and foodies looking for local culinary delights. | Wine tours, Tastings, Local gastronomy events |
Understanding Airbnb License Requirements & STR Laws in Villefort (2026)
With 11% of listings showing registration in 2026, understanding potential Airbnb license requirements is crucial in Villefort. Always verify the latest short term rental regulations and Airbnb license requirements directly with local government authorities for Villefort to ensure full compliance before hosting.
(Source: AirROI data, 2026, based on 11% licensed listings)
Top Performing Airbnb Properties in Villefort (2026)
Benchmark your potential! Explore examples of top-performing Airbnb properties in Villefortbased on Trailing Twelve Month (TTM) revenue. Analyze their characteristics, revenue, occupancy rate, and ADR to understand what drives success in this market.
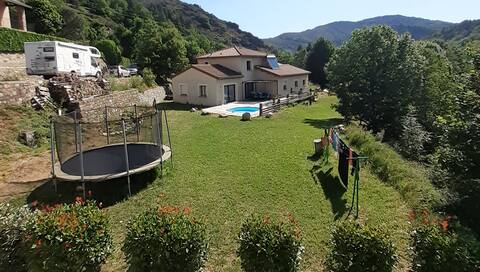
Summer House in Lozère
Entire Place • 3 bedrooms
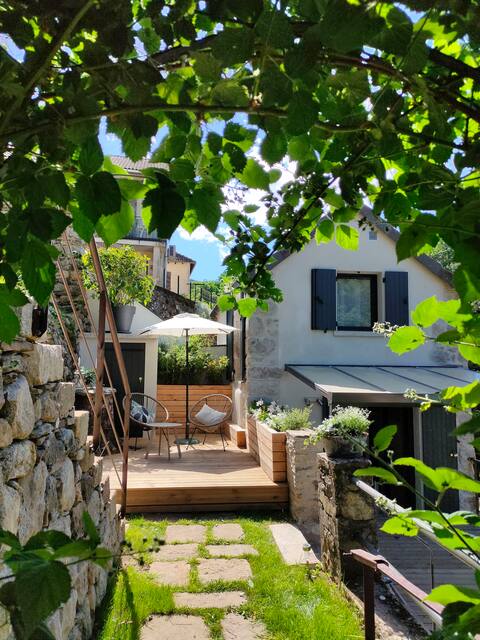
Le Secret du Moulin, pleasant tiny house in Villefort
Entire Place • 1 bedroom

Le Grenier d'Annick
Entire Place • 2 bedrooms
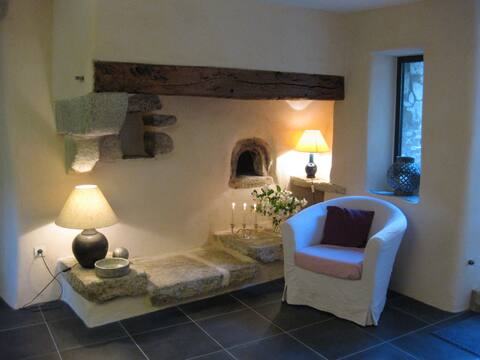
The Little Mill House
Entire Place • 1 bedroom

Maison de vacances Cosy et jardin clos
Entire Place • 1 bedroom
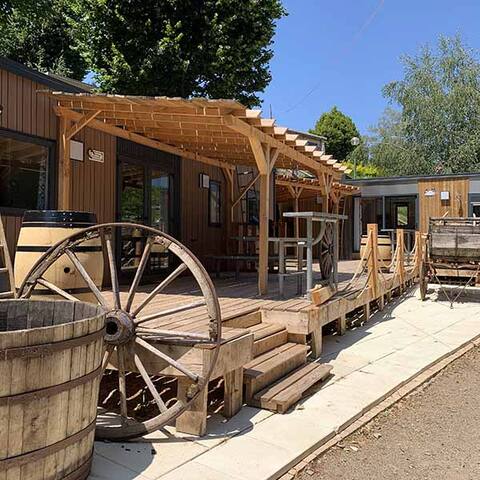
3 Western-themed chalets for 16 people
Entire Place • 8 bedrooms
Note: Performance varies based on location, size, amenities, seasonality, and management quality. Data reflects the past 12 months.
Top Performing Airbnb Hosts in Villefort (2026)
Learn from the best! This table showcases top-performing Airbnb hosts in Villefort based on the number of properties managed and estimated total revenue over the past year. Analyze their scale and performance metrics.
| Host Name | Properties | Grossing Revenue | Stay Reviews | Avg Rating |
|---|---|---|---|---|
| Patrice | 6 | $37,726 | 51 | 4.65/5.0 |
| Martine | 2 | $33,191 | 221 | 4.92/5.0 |
| Myriam | 2 | $29,950 | 179 | 4.71/5.0 |
| Holidu | 3 | $27,196 | 13 | 4.48/5.0 |
| Franck CANADAS | 2 | $16,715 | 134 | 4.38/5.0 |
| Caroline | 2 | $15,291 | 40 | 4.75/5.0 |
| Otalora | 1 | $14,103 | 12 | 4.92/5.0 |
| Mireille | 1 | $13,017 | 5 | 5.00/5.0 |
| Gaelle | 1 | $12,085 | 89 | 4.66/5.0 |
| Florent | 1 | $11,779 | 20 | 4.75/5.0 |
Analyzing the strategies of top hosts, such as their property selection, pricing, and guest communication, can offer valuable lessons for optimizing your own Airbnb operations in Villefort.
Dive Deeper: Advanced Villefort STR Market Data (2026)
Ready to unlock more insights? AirROI provides access to advanced metrics and comprehensive Airbnb data for Villefort. Explore detailed analytics beyond this report to refine your investment strategy, optimize pricing, and maximize your vacation rental profits.
Explore Advanced MetricsVillefort Short-Term Rental Market Composition (2026): Property & Room Types
Room Type Distribution
Property Type Distribution
Market Composition Insights for Villefort
- The Villefort Airbnb market composition is heavily skewed towards Entire Home/Apt listings, which make up 100% of the 28 active rentals. This indicates strong guest preference for privacy and space.
- Looking at the property type distribution in Villefort, House properties are the most common (60.7%), reflecting the local real estate landscape.
- Houses represent a significant 60.7% portion, catering likely to families or larger groups.
- Smaller segments like hotel/boutique (combined 3.6%) offer potential for unique stay experiences.
Villefort Airbnb Room Capacity Analysis (2026): Bedroom Distribution
Distribution of Listings by Number of Bedrooms
Room Capacity Insights for Villefort
- The dominant room capacity in Villefort is 1 bedroom listings, making up 39.3% of the market. This suggests a strong demand for properties suitable for couples or solo travelers.
- Together, 1 bedroom and 2 bedrooms properties represent 64.3% of the active Airbnb listings in Villefort, indicating a high concentration in these sizes.
- A significant 32.1% of listings offer 3+ bedrooms, catering to larger groups and families seeking more space in Villefort.
Villefort Vacation Rental Guest Capacity Trends (2026)
Distribution of Listings by Guest Capacity
Guest Capacity Insights for Villefort
- The most common guest capacity trend in Villefort vacation rentals is listings accommodating 6 guests (35.7%). This suggests the primary traveler segment is likely larger groups.
- Properties designed for 6 guests and 2 guests dominate the Villefort STR market, accounting for 57.1% of listings.
- 57.2% of properties accommodate 6+ guests, serving the market segment for larger families or group travel in Villefort.
- On average, properties in Villefort are equipped to host 5.1 guests.
Villefort Airbnb Booking Patterns (2026): Available vs. Booked Days
Available Days Distribution
Booked Days Distribution
Booking Pattern Insights for Villefort
- The most common availability pattern in Villefort falls within the 271-366 days range, representing 67.9% of listings. This suggests many properties have significant open periods on their calendars.
- Approximately 96.5% of listings show high availability (181+ days open annually), indicating potential for increased bookings or specific owner usage patterns.
- For booked days, the 31-90 days range is most frequent in Villefort (46.4%), reflecting common guest stay durations or potential owner blocking patterns.
- A notable 3.6% of properties secure long booking periods (181+ days booked per year), highlighting successful long-term rental strategies or significant owner usage.
Villefort Airbnb Minimum Stay Requirements Analysis
Distribution of Listings by Minimum Night Requirement
1 Night
7 listings
25% of total
2 Nights
2 listings
7.1% of total
3 Nights
2 listings
7.1% of total
4-6 Nights
1 listings
3.6% of total
7-29 Nights
3 listings
10.7% of total
30+ Nights
13 listings
46.4% of total
Key Insights
- The most prevalent minimum stay requirement in Villefort is 30+ Nights, adopted by 46.4% of listings. This highlights the market's preference for longer commitments.
- A significant segment (46.4%) caters to monthly stays (30+ nights) in Villefort, pointing to opportunities in the extended-stay market.
Recommendations
- Align with the market by considering a 30+ Nights minimum stay, as 46.4% of Villefort hosts use this setting.
- If feasible, allowing 1-night stays, especially midweek or during low season, could capture last-minute bookings, as only 25% currently do.
- Explore offering discounts for stays of 30+ nights to attract the 46.4% of the market seeking extended stays.
- Adjust minimum nights based on seasonality – potentially shorter during low season and longer during peak demand periods in Villefort.
Villefort Airbnb Cancellation Policy Trends Analysis (2026)
Super Strict 60 Days
1 listings
3.6% of total
Flexible
6 listings
21.4% of total
Moderate
7 listings
25% of total
Firm
9 listings
32.1% of total
Strict
5 listings
17.9% of total
Cancellation Policy Insights for Villefort
- The prevailing Airbnb cancellation policy trend in Villefort is Firm, used by 32.1% of listings.
- There's a relatively balanced mix between guest-friendly (46.4%) and stricter (50.0%) policies, offering choices for different guest needs.
Recommendations for Hosts
- Consider adopting a Firm policy to align with the 32.1% market standard in Villefort.
- Regularly review your cancellation policy against competitors and market demand shifts in Villefort.
Villefort STR Booking Lead Time Analysis (2026)
Average Booking Lead Time by Month
Booking Lead Time Insights for Villefort
- The overall average booking lead time for vacation rentals in Villefort is 59 days.
- Guests book furthest in advance for stays during September (average 76 days), likely coinciding with peak travel demand or local events.
- The shortest booking windows occur for stays in December (average 6 days), indicating more last-minute travel plans during this time.
- Seasonally, Summer (55 days avg.) sees the longest lead times, while Winter (18 days avg.) has the shortest, reflecting typical travel planning cycles.
Recommendations for Hosts
- Use the overall average lead time (59 days) as a baseline for your pricing and availability strategy in Villefort.
- For September stays, consider implementing length-of-stay discounts or slightly higher rates for bookings made less than 76 days out to capitalize on advance planning.
- During December, focus on last-minute booking availability and promotions, as guests book with very short notice (6 days avg.).
- Target marketing efforts for the Summer season well in advance (at least 55 days) to capture early planners.
- Monitor your own booking lead times against these Villefort averages to identify opportunities for dynamic pricing adjustments.
Popular & Essential Airbnb Amenities in Villefort (2026)
Amenity Prevalence
Amenity Insights for Villefort
- Essential amenities in Villefort that guests expect include: Kitchen. Lacking these (this) could significantly impact bookings.
- Popular amenities like TV, Heating, Free parking on premises are common but not universal. Offering these can provide a competitive edge.
- Warning: Wifi is not universally provided but is considered essential globally. Ensure reliable Wifi is offered.
Recommendations for Hosts
- Ensure your listing includes all essential amenities for Villefort: Kitchen.
- Consider adding popular differentiators like TV or Heating to increase appeal.
- Highlight unique or less common amenities you offer (e.g., hot tub, dedicated workspace, EV charger) in your listing description and photos.
- Regularly check competitor amenities in Villefort to stay competitive.
Villefort Airbnb Guest Demographics & Profile Analysis (2026)
Guest Profile Summary for Villefort
- The typical guest profile for Airbnb in Villefort consists of primarily domestic travelers (91%), often arriving from nearby Lyon, typically belonging to the Post-2000s (Gen Z/Alpha) group (50%), primarily speaking French or English.
- Domestic travelers account for 91.0% of guests.
- Key international markets include France (91%) and Belgium (3.6%).
- Top languages spoken are French (42.9%) followed by English (31.9%).
- A significant demographic segment is the Post-2000s (Gen Z/Alpha) group, representing 50% of guests.
Recommendations for Hosts
- Target domestic marketing efforts towards travelers from Lyon and Paris.
- Tailor amenities and listing descriptions to appeal to the dominant Post-2000s (Gen Z/Alpha) demographic (e.g., highlight fast WiFi, smart home features, local guides).
- Highlight unique local experiences or amenities relevant to the primary guest profile.
- Consider seasonal promotions aligned with peak travel times for key origin markets.
Nearby Short-Term Rental Market Comparison
How does the Villefort Airbnb market stack up against its neighbors? Compare key performance metrics like average monthly revenue, ADR, and occupancy rates in surrounding areas to understand the broader regional STR landscape.
| Market | Active Properties | Monthly Revenue | Daily Rate | Avg. Occupancy |
|---|---|---|---|---|
| Cavillargues | 12 | $3,274 | $342.99 | 43% |
| Eygalières | 82 | $3,206 | $417.97 | 39% |
| Divajeu | 20 | $3,061 | $421.97 | 32% |
| Lamotte-du-Rhône | 13 | $2,854 | $315.16 | 36% |
| Les Baux-de-Provence | 28 | $2,764 | $332.51 | 41% |
| Travaillan | 10 | $2,684 | $693.56 | 28% |
| Anneyron | 11 | $2,670 | $253.37 | 44% |
| Puimisson | 15 | $2,618 | $381.71 | 38% |
| Villeneuvette | 20 | $2,555 | $282.96 | 36% |
| Verquières | 10 | $2,524 | $358.48 | 45% |