Vendres Airbnb Market Analysis 2026: Short Term Rental Data & Vacation Rental Statistics in Occitania, France
Is Airbnb profitable in Vendres in 2026? Explore comprehensive Airbnb analytics for Vendres, Occitania, France to uncover income potential. This 2026 STR market report for Vendres, based on AirROI data from February 2025 to January 2026, reveals key trends in the niche market of 102 active listings.
Whether you're considering an Airbnb investment in Vendres, optimizing your existing vacation rental, or exploring rental arbitrage opportunities, understanding the Vendres Airbnb data is crucial. Leveraging the low regulation environment is key to maximizing your short term rental income potential. Let's dive into the specifics.
Key Vendres Airbnb Performance Metrics Overview
Monthly Airbnb Revenue Variations & Income Potential in Vendres (2026)
Understanding the monthly revenue variations for Airbnb listings in Vendres is key to maximizing your short term rental income potential. Seasonality significantly impacts earnings. Our analysis, based on data from the past 12 months, shows that the peak revenue month for STRs in Vendres is typically August, while January often presents the lowest earnings, highlighting opportunities for strategic pricing adjustments during shoulder and low seasons. Explore the typical Airbnb income in Vendres across different performance tiers:
- Best-in-class properties (Top 10%) achieve $3,004+ monthly, often utilizing dynamic pricing and superior guest experiences.
- Strong performing properties (Top 25%) earn $1,583 or more, indicating effective management and desirable locations/amenities.
- Typical properties (Median) generate around $985 per month, representing the average market performance.
- Entry-level properties (Bottom 25%) see earnings around $485, often with potential for optimization.
Average Monthly Airbnb Earnings Trend in Vendres
Vendres Airbnb Occupancy Rate Trends (2026)
Maximize your bookings by understanding the Vendres STR occupancy trends. Seasonal demand shifts significantly influence how often properties are booked. Typically, Augustsees the highest demand (peak season occupancy), while January experiences the lowest (low season). Effective strategies, like adjusting minimum stays or offering promotions, can boost occupancy during slower periods. Here's how different property tiers perform in Vendres:
- Best-in-class properties (Top 10%) achieve 63%+ occupancy, indicating high desirability and potentially optimized availability.
- Strong performing properties (Top 25%) maintain 43% or higher occupancy, suggesting good market fit and guest satisfaction.
- Typical properties (Median) have an occupancy rate around 26%.
- Entry-level properties (Bottom 25%) average 13% occupancy, potentially facing higher vacancy.
Average Monthly Occupancy Rate Trend in Vendres
Average Daily Rate (ADR) Airbnb Trends in Vendres (2026)
Effective short term rental pricing strategy in Vendres involves understanding monthly ADR fluctuations. The Average Daily Rate (ADR) for Airbnb in Vendres typically peaks in August and dips lowest during March. Leveraging Airbnb dynamic pricing tools or strategies based on this seasonality can significantly boost revenue. Here's a look at the typical nightly rates achieved:
- Best-in-class properties (Top 10%) command rates of $262+ per night, often due to premium features or locations.
- Strong performing properties (Top 25%) achieve nightly rates of $172 or more.
- Typical properties (Median) charge around $117 per night.
- Entry-level properties (Bottom 25%) earn around $90 per night.
Average Daily Rate (ADR) Trend by Month in Vendres
Get Live Vendres Market Intelligence 👇

Explore Real-time Analytics
Airbnb Seasonality Analysis & Trends in Vendres (2026)
Peak Season (August, July, September)
- Revenue averages $2,521 per month
- Occupancy rates average 47.5%
- Daily rates average $157
Shoulder Season
- Revenue averages $1,091 per month
- Occupancy maintains around 27.2%
- Daily rates hold near $141
Low Season (January, February, April)
- Revenue drops to average $643 per month
- Occupancy decreases to average 21.2%
- Daily rates adjust to average $139
Seasonality Insights for Vendres
- The Airbnb seasonality in Vendres shows highly seasonal trends requiring careful strategy. While the sections above show seasonal averages, it's also insightful to look at the extremes:
- During the high season, the absolute peak month showcases Vendres's highest earning potential, with monthly revenues capable of climbing to $3,386, occupancy reaching a high of 62.0%, and ADRs peaking at $166.
- Conversely, the slowest single month of the year, typically falling within the low season, marks the market's lowest point. In this month, revenue might dip to $468, occupancy could drop to 11.0%, and ADRs may adjust down to $135.
- Understanding both the seasonal averages and these monthly peaks and troughs in revenue, occupancy, and ADR is crucial for maximizing your Airbnb profit potential in Vendres.
Seasonal Strategies for Maximizing Profit
- Peak Season: Maximize revenue through premium pricing and potentially longer minimum stays. Ensure high availability.
- Low Season: Offer competitive pricing, special promotions (e.g., extended stay discounts), and flexible cancellation policies. Target off-season travelers like remote workers or budget-conscious guests.
- Shoulder Seasons: Implement dynamic pricing that balances peak and low rates. Target weekend travelers or specific events. Offer slightly more flexible terms than peak season.
- Regularly analyze your own performance against these Vendres seasonality benchmarks and adjust your pricing and availability strategy accordingly.
Best Areas for Airbnb Investment in Vendres (2026)
Exploring the top neighborhoods for short-term rentals in Vendres? This section highlights key areas, outlining why they are attractive for hosts and guests, along with notable local attractions. Consider these locations based on your target guest profile and investment strategy.
| Neighborhood / Area | Why Host Here? (Target Guests & Appeal) | Key Attractions & Landmarks |
|---|---|---|
| Vendres Beach | Beautiful sandy beach area known for its picturesque views and water activities. Ideal for tourists looking for beach relaxation and water sports. | Vendres Plage, Étang de Vendres, Vendres River, Local seafood restaurants, Water sports rentals |
| Historical Center of Vendres | Charming small town atmosphere with historical architecture and local culture. Perfect for visitors wanting a quiet, authentic French experience. | Église Sainte-Cécile, Local markets, Vendres town square, Local wineries, Historical walking paths |
| Nearby Beziers | Vibrant city known for its rich history and cultural attractions. Great for guests who want to explore beyond Vendres while enjoying urban amenities. | Saint-Nazaire Cathedral, Alley of the Poets, Beziers Arena, Mediterranean beaches, Les Allées Paul Riquet |
| Capes d'Agde | Tourist hotspot known for its beaches, nightlife, and family-friendly activities. Attracts a diverse crowd from families to party-goers. | Cap d'Agde naturist village, Aqualand Cap d'Agde, Agde Cathedral, Sautee de la Tonnelle, Local markets |
| Parc Naturel Régional de la Narbonnaise en Méditerranée | Stunning natural park with diverse ecosystems, perfect for nature lovers and outdoor activities. Ideal for guests looking for adventure and exploration. | Hiking trails, Bird watching, Scenic coastal views, Flora and fauna tours, Cycling paths |
| Narbonne | Historic city with Roman heritage and vibrant culture. Offers a mix of historical sightseeing and modern urban life. | Narbonne Cathedral, Canal de la Robine, Les Halles de Narbonne, Palais des Archevêques, Botanical Garden |
| Marseillan | Charming town known for its wine production and close proximity to the Mediterranean. Attracts wine enthusiasts and beach lovers alike. | Marseillan Plage, Noilly Prat distillery, Local wine cellars, Mediterranean restaurants, Historic town center |
| Serignan | Rural retreat by the coast offering beaches and relaxation. Great for families and those looking to unwind away from the busier tourist spots. | Serignan Plage, Local parks, Art exhibitions, Wine tasting events, Family-friendly activities |
Understanding Airbnb License Requirements & STR Laws in Vendres (2026)
While Vendres, Occitania, France currently shows low STR regulations, specific Airbnb license requirements might still exist or change. Always verify the latest short term rental regulations and Airbnb license requirements directly with local government authorities for Vendres to ensure full compliance before hosting.
(Source: AirROI data, 2026, based on 7% licensed listings)
Top Performing Airbnb Properties in Vendres (2026)
Benchmark your potential! Explore examples of top-performing Airbnb properties in Vendresbased on Trailing Twelve Month (TTM) revenue. Analyze their characteristics, revenue, occupancy rate, and ADR to understand what drives success in this market.
Villa Juxta Maré Beach 500 m Away
Entire Place • 3 bedrooms
Villa Selva Beach 500 m Away
Entire Place • 3 bedrooms
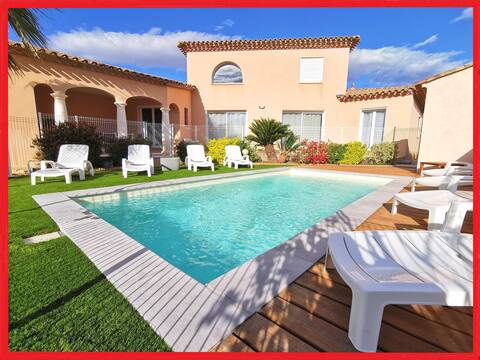
4-star villa with private pool and bowling alley
Entire Place • 5 bedrooms
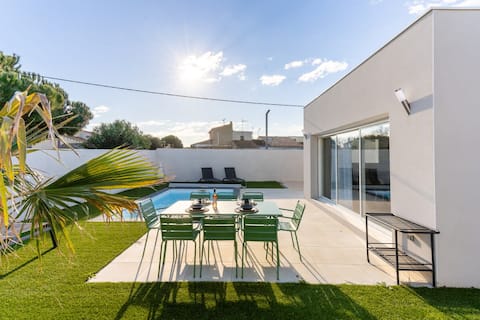
5 min from the beaches "La Villa Sun" private pool
Entire Place • 5 bedrooms
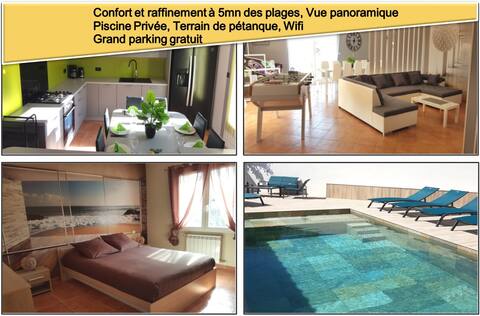
Oasis Vendres swimming pool and modern comfort
Entire Place • 3 bedrooms
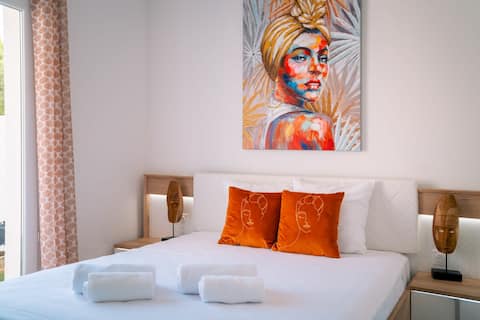
Suite with Spa, SukhaSpa, 1 km from the beaches.
Entire Place • 2 bedrooms
Note: Performance varies based on location, size, amenities, seasonality, and management quality. Data reflects the past 12 months.
Top Performing Airbnb Hosts in Vendres (2026)
Learn from the best! This table showcases top-performing Airbnb hosts in Vendres based on the number of properties managed and estimated total revenue over the past year. Analyze their scale and performance metrics.
| Host Name | Properties | Grossing Revenue | Stay Reviews | Avg Rating |
|---|---|---|---|---|
| Laetitia Et Erwann | 2 | $104,008 | 59 | 4.99/5.0 |
| Clés D'Ici | 5 | $54,157 | 15 | 4.75/5.0 |
| Cécile | 1 | $45,459 | 31 | 4.97/5.0 |
| Cédric | 1 | $38,292 | 25 | 5.00/5.0 |
| Veronique | 1 | $34,971 | 8 | 4.75/5.0 |
| Sarah | 1 | $31,030 | 169 | 4.96/5.0 |
| Fabrice | 1 | $29,944 | 59 | 4.95/5.0 |
| Les Clés De Fanny | 3 | $27,394 | 63 | 4.54/5.0 |
| Nathalie | 1 | $27,047 | 2 | Not Rated |
| Corinne | 2 | $27,024 | 281 | 4.82/5.0 |
Analyzing the strategies of top hosts, such as their property selection, pricing, and guest communication, can offer valuable lessons for optimizing your own Airbnb operations in Vendres.
Dive Deeper: Advanced Vendres STR Market Data (2026)
Ready to unlock more insights? AirROI provides access to advanced metrics and comprehensive Airbnb data for Vendres. Explore detailed analytics beyond this report to refine your investment strategy, optimize pricing, and maximize your vacation rental profits.
Explore Advanced MetricsVendres Short-Term Rental Market Composition (2026): Property & Room Types
Room Type Distribution
Property Type Distribution
Market Composition Insights for Vendres
- The Vendres Airbnb market composition is heavily skewed towards Entire Home/Apt listings, which make up 95.1% of the 102 active rentals. This indicates strong guest preference for privacy and space.
- Looking at the property type distribution in Vendres, House properties are the most common (78.4%), reflecting the local real estate landscape.
- Houses represent a significant 78.4% portion, catering likely to families or larger groups.
- Smaller segments like hotel/boutique, outdoor/unique (combined 7.8%) offer potential for unique stay experiences.
Vendres Airbnb Room Capacity Analysis (2026): Bedroom Distribution
Distribution of Listings by Number of Bedrooms
Room Capacity Insights for Vendres
- The dominant room capacity in Vendres is 2 bedrooms listings, making up 43.1% of the market. This suggests a strong demand for properties suitable for couples or solo travelers.
- Together, 2 bedrooms and 3 bedrooms properties represent 82.3% of the active Airbnb listings in Vendres, indicating a high concentration in these sizes.
- A significant 46.1% of listings offer 3+ bedrooms, catering to larger groups and families seeking more space in Vendres.
Vendres Vacation Rental Guest Capacity Trends (2026)
Distribution of Listings by Guest Capacity
Guest Capacity Insights for Vendres
- The most common guest capacity trend in Vendres vacation rentals is listings accommodating 6 guests (35.3%). This suggests the primary traveler segment is likely larger groups.
- Properties designed for 6 guests and 4 guests dominate the Vendres STR market, accounting for 62.8% of listings.
- 53.0% of properties accommodate 6+ guests, serving the market segment for larger families or group travel in Vendres.
- On average, properties in Vendres are equipped to host 5.3 guests.
Vendres Airbnb Booking Patterns (2026): Available vs. Booked Days
Available Days Distribution
Booked Days Distribution
Booking Pattern Insights for Vendres
- The most common availability pattern in Vendres falls within the 271-366 days range, representing 72.5% of listings. This suggests many properties have significant open periods on their calendars.
- Approximately 95.0% of listings show high availability (181+ days open annually), indicating potential for increased bookings or specific owner usage patterns.
- For booked days, the 31-90 days range is most frequent in Vendres (38.2%), reflecting common guest stay durations or potential owner blocking patterns.
- A notable 4.9% of properties secure long booking periods (181+ days booked per year), highlighting successful long-term rental strategies or significant owner usage.
Vendres Airbnb Minimum Stay Requirements Analysis
Distribution of Listings by Minimum Night Requirement
1 Night
9 listings
8.8% of total
2 Nights
10 listings
9.8% of total
3 Nights
5 listings
4.9% of total
4-6 Nights
17 listings
16.7% of total
7-29 Nights
7 listings
6.9% of total
30+ Nights
54 listings
52.9% of total
Key Insights
- The most prevalent minimum stay requirement in Vendres is 30+ Nights, adopted by 52.9% of listings. This highlights the market's preference for longer commitments.
- Very short stays (1-2 nights) are less common (18.6%), suggesting hosts prefer slightly longer bookings to optimize turnover.
- A significant segment (52.9%) caters to monthly stays (30+ nights) in Vendres, pointing to opportunities in the extended-stay market.
Recommendations
- Align with the market by considering a 30+ Nights minimum stay, as 52.9% of Vendres hosts use this setting.
- If feasible, allowing 1-night stays, especially midweek or during low season, could capture last-minute bookings, as only 8.8% currently do.
- Explore offering discounts for stays of 30+ nights to attract the 52.9% of the market seeking extended stays.
- Adjust minimum nights based on seasonality – potentially shorter during low season and longer during peak demand periods in Vendres.
Vendres Airbnb Cancellation Policy Trends Analysis (2026)
Super Strict 30 Days
9 listings
8.8% of total
Limited
1 listings
1% of total
Flexible
14 listings
13.7% of total
Moderate
24 listings
23.5% of total
Firm
38 listings
37.3% of total
Strict
16 listings
15.7% of total
Cancellation Policy Insights for Vendres
- The prevailing Airbnb cancellation policy trend in Vendres is Firm, used by 37.3% of listings.
- A majority (53.0%) of hosts in Vendres utilize Firm or Strict policies, indicating a market where hosts prioritize booking security.
Recommendations for Hosts
- Consider adopting a Firm policy to align with the 37.3% market standard in Vendres.
- Regularly review your cancellation policy against competitors and market demand shifts in Vendres.
Vendres STR Booking Lead Time Analysis (2026)
Average Booking Lead Time by Month
Booking Lead Time Insights for Vendres
- The overall average booking lead time for vacation rentals in Vendres is 50 days.
- Guests book furthest in advance for stays during August (average 91 days), likely coinciding with peak travel demand or local events.
- The shortest booking windows occur for stays in December (average 26 days), indicating more last-minute travel plans during this time.
- Seasonally, Summer (66 days avg.) sees the longest lead times, while Winter (29 days avg.) has the shortest, reflecting typical travel planning cycles.
Recommendations for Hosts
- Use the overall average lead time (50 days) as a baseline for your pricing and availability strategy in Vendres.
- For August stays, consider implementing length-of-stay discounts or slightly higher rates for bookings made less than 91 days out to capitalize on advance planning.
- Target marketing efforts for the Summer season well in advance (at least 66 days) to capture early planners.
- Monitor your own booking lead times against these Vendres averages to identify opportunities for dynamic pricing adjustments.
Popular & Essential Airbnb Amenities in Vendres (2026)
Amenity Prevalence
Amenity Insights for Vendres
- Essential amenities in Vendres that guests expect include: TV. Lacking these (this) could significantly impact bookings.
- Popular amenities like Kitchen, Free parking on premises, Refrigerator are common but not universal. Offering these can provide a competitive edge.
Recommendations for Hosts
- Ensure your listing includes all essential amenities for Vendres: TV.
- Prioritize adding missing essentials: TV.
- Consider adding popular differentiators like Kitchen or Free parking on premises to increase appeal.
- Highlight unique or less common amenities you offer (e.g., hot tub, dedicated workspace, EV charger) in your listing description and photos.
- Regularly check competitor amenities in Vendres to stay competitive.
Vendres Airbnb Guest Demographics & Profile Analysis (2026)
Guest Profile Summary for Vendres
- The typical guest profile for Airbnb in Vendres consists of primarily domestic travelers (80%), often arriving from nearby Toulouse, typically belonging to the Post-2000s (Gen Z/Alpha) group (50%), primarily speaking French or English.
- Domestic travelers account for 80.1% of guests.
- Key international markets include France (80.1%) and Germany (3.9%).
- Top languages spoken are French (40%) followed by English (30%).
- A significant demographic segment is the Post-2000s (Gen Z/Alpha) group, representing 50% of guests.
Recommendations for Hosts
- Target domestic marketing efforts towards travelers from Toulouse and Girona.
- Tailor amenities and listing descriptions to appeal to the dominant Post-2000s (Gen Z/Alpha) demographic (e.g., highlight fast WiFi, smart home features, local guides).
- Highlight unique local experiences or amenities relevant to the primary guest profile.
- Consider seasonal promotions aligned with peak travel times for key origin markets.
Nearby Short-Term Rental Market Comparison
How does the Vendres Airbnb market stack up against its neighbors? Compare key performance metrics like average monthly revenue, ADR, and occupancy rates in surrounding areas to understand the broader regional STR landscape.
| Market | Active Properties | Monthly Revenue | Daily Rate | Avg. Occupancy |
|---|---|---|---|---|
| Cornellà del Terri | 15 | $6,458 | $584.61 | 40% |
| Amer | 11 | $4,949 | $462.57 | 38% |
| Vilanant | 12 | $4,526 | $404.10 | 36% |
| Porqueres | 13 | $4,304 | $512.14 | 31% |
| Sant Ferriol | 18 | $3,987 | $316.31 | 43% |
| Bàscara | 13 | $3,777 | $563.92 | 31% |
| Vilademuls | 21 | $3,518 | $352.52 | 38% |
| Cavillargues | 12 | $3,274 | $342.99 | 43% |
| Eygalières | 82 | $3,206 | $417.97 | 39% |
| les Llosses | 10 | $3,165 | $392.85 | 32% |