Oms Airbnb Market Analysis 2025: Short Term Rental Data & Vacation Rental Statistics in Occitania, France
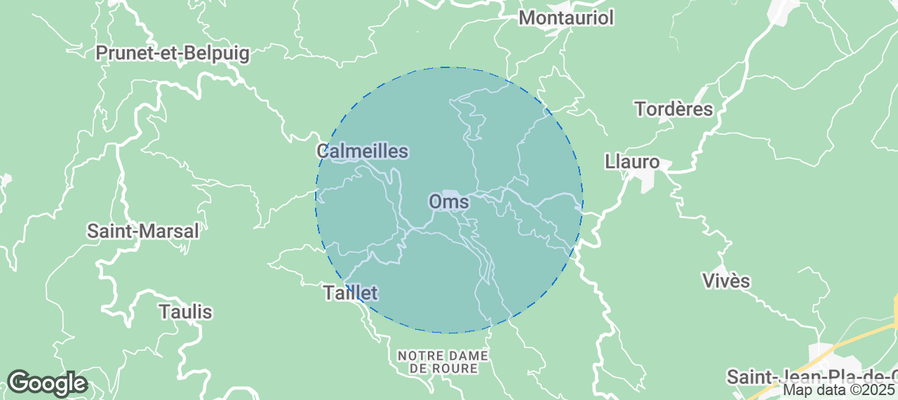
Is Airbnb profitable in Oms in 2025? Explore comprehensive Airbnb analytics for Oms, Occitania, France to uncover income potential. This 2025 STR market report for Oms, based on AirROI data from November 2024 to October 2025, reveals key trends in the niche market of 17 active listings.
Whether you're considering an Airbnb investment in Oms, optimizing your existing vacation rental, or exploring rental arbitrage opportunities, understanding the Oms Airbnb data is crucial. Leveraging the low regulation environment is key to maximizing your short term rental income potential. Let's dive into the specifics.
Key Oms Airbnb Performance Metrics Overview
Monthly Airbnb Revenue Variations & Income Potential in Oms (2025)
Understanding the monthly revenue variations for Airbnb listings in Oms is key to maximizing your short term rental income potential. Seasonality significantly impacts earnings. Our analysis, based on data from the past 12 months, shows that the peak revenue month for STRs in Oms is typically August, while February often presents the lowest earnings, highlighting opportunities for strategic pricing adjustments during shoulder and low seasons. Explore the typical Airbnb income in Oms across different performance tiers:
- Best-in-class properties (Top 10%) achieve $4,149+ monthly, often utilizing dynamic pricing and superior guest experiences.
- Strong performing properties (Top 25%) earn $2,163 or more, indicating effective management and desirable locations/amenities.
- Typical properties (Median) generate around $1,209 per month, representing the average market performance.
- Entry-level properties (Bottom 25%) see earnings around $619, often with potential for optimization.
Average Monthly Airbnb Earnings Trend in Oms
Oms Airbnb Occupancy Rate Trends (2025)
Maximize your bookings by understanding the Oms STR occupancy trends. Seasonal demand shifts significantly influence how often properties are booked. Typically, Julysees the highest demand (peak season occupancy), while March experiences the lowest (low season). Effective strategies, like adjusting minimum stays or offering promotions, can boost occupancy during slower periods. Here's how different property tiers perform in Oms:
- Best-in-class properties (Top 10%) achieve 58%+ occupancy, indicating high desirability and potentially optimized availability.
- Strong performing properties (Top 25%) maintain 38% or higher occupancy, suggesting good market fit and guest satisfaction.
- Typical properties (Median) have an occupancy rate around 21%.
- Entry-level properties (Bottom 25%) average 13% occupancy, potentially facing higher vacancy.
Average Monthly Occupancy Rate Trend in Oms
Average Daily Rate (ADR) Airbnb Trends in Oms (2025)
Effective short term rental pricing strategy in Oms involves understanding monthly ADR fluctuations. The Average Daily Rate (ADR) for Airbnb in Oms typically peaks in August and dips lowest during March. Leveraging Airbnb dynamic pricing tools or strategies based on this seasonality can significantly boost revenue. Here's a look at the typical nightly rates achieved:
- Best-in-class properties (Top 10%) command rates of $372+ per night, often due to premium features or locations.
- Strong performing properties (Top 25%) achieve nightly rates of $226 or more.
- Typical properties (Median) charge around $161 per night.
- Entry-level properties (Bottom 25%) earn around $114 per night.
Average Daily Rate (ADR) Trend by Month in Oms
Get Live Oms Market Intelligence 👇
Explore Real-time Analytics
Airbnb Seasonality Analysis & Trends in Oms (2025)
Peak Season (August, July, January)
- Revenue averages $2,819 per month
- Occupancy rates average 38.5%
- Daily rates average $193
Shoulder Season
- Revenue averages $1,544 per month
- Occupancy maintains around 27.0%
- Daily rates hold near $184
Low Season (February, March, December)
- Revenue drops to average $870 per month
- Occupancy decreases to average 19.8%
- Daily rates adjust to average $176
Seasonality Insights for Oms
- The Airbnb seasonality in Oms shows highly seasonal trends requiring careful strategy. While the sections above show seasonal averages, it's also insightful to look at the extremes:
- During the high season, the absolute peak month showcases Oms's highest earning potential, with monthly revenues capable of climbing to $3,387, occupancy reaching a high of 44.1%, and ADRs peaking at $201.
- Conversely, the slowest single month of the year, typically falling within the low season, marks the market's lowest point. In this month, revenue might dip to $851, occupancy could drop to 12.1%, and ADRs may adjust down to $174.
- Understanding both the seasonal averages and these monthly peaks and troughs in revenue, occupancy, and ADR is crucial for maximizing your Airbnb profit potential in Oms.
Seasonal Strategies for Maximizing Profit
- Peak Season: Maximize revenue through premium pricing and potentially longer minimum stays. Ensure high availability.
- Low Season: Offer competitive pricing, special promotions (e.g., extended stay discounts), and flexible cancellation policies. Target off-season travelers like remote workers or budget-conscious guests.
- Shoulder Seasons: Implement dynamic pricing that balances peak and low rates. Target weekend travelers or specific events. Offer slightly more flexible terms than peak season.
- Regularly analyze your own performance against these Oms seasonality benchmarks and adjust your pricing and availability strategy accordingly.
Best Areas for Airbnb Investment in Oms (2025)
Exploring the top neighborhoods for short-term rentals in Oms? This section highlights key areas, outlining why they are attractive for hosts and guests, along with notable local attractions. Consider these locations based on your target guest profile and investment strategy.
| Neighborhood / Area | Why Host Here? (Target Guests & Appeal) | Key Attractions & Landmarks |
|---|---|---|
| Carcassonne | Famous for its medieval fortress, Carcassonne attracts tourists who wish to explore its history and architecture. A captivating destination for those looking for a unique cultural experience. | Cité de Carcassonne, Château Comtal, Basilique Saint-Nazaire, Canal du Midi, Place Carnot, Carcassonne Festival |
| Toulouse | Known as "La Ville Rose" for its pink terracotta buildings, Toulouse offers a blend of historic sites and a vibrant cultural scene, making it popular among travelers throughout the year. | Place du Capitole, Basilique Saint-Sernin, Cité de l'Espace, Musée des Augustins, Garonne River, Les Abattoirs |
| Albi | Home to the stunning Sainte-Cécile Cathedral and a UNESCO World Heritage Site, Albi offers a quaint and charming atmosphere appealing to visitors interested in art and history. | Sainte-Cécile Cathedral, Museum of Toulouse-Lautrec, Albi Old Bridge, Palais de la Berbies, Fortified Town of Cordes-sur-Ciel |
| Montpellier | A dynamic and youthful city known for its beautiful architecture and Mediterranean climate, Montpellier attracts a large number of students and visitors, making it a great location for Airbnb. | Place de la Comédie, Montpellier Zoo, Musée Fabre, Botanical Garden, Rockstore concerts |
| Nîmes | Rich in Roman history, Nîmes includes spectacular ancient monuments and is a great destination for history buffs and tourists alike, looking for authenticity and culture. | Arena of Nîmes, Maison Carrée, Jardins de la Fontaine, Temple de Diane, Pont du Gard, Nîmes Contemporary Art Museum |
| Sète | Known for its beautiful canals and Mediterranean beaches, Sète is a charming coastal town that attracts both tourists and locals looking for relaxation and sun. | Mont Saint Clair, Beach of Sète, Canal Royal, Museum of Fine Arts, Sète's seafood restaurants |
| Agen | Agen is known for its prunes and charming setting along the Garonne River, making it an ideal getaway spot for those who seek a quieter rural experience. | Agen Bridge, Jardin des Remparts, Walibi Sud-Ouest, Museum of Fine Arts, Les Pyrénées |
| Le Grau-du-Roi | A delightful seaside resort, Le Grau-du-Roi boasts beautiful beaches and a relaxed atmosphere, ideal for summer tourism and beach lovers. | Plage de l'Espiguette, Seaquarium, Port Camargue, Les Grandes Dunes, Grau-du-Roi marina |
Understanding Airbnb License Requirements & STR Laws in Oms (2025)
While Oms, Occitania, France currently shows low STR regulations, specific Airbnb license requirements might still exist or change. Always verify the latest short term rental regulations and Airbnb license requirements directly with local government authorities for Oms to ensure full compliance before hosting.
(Source: AirROI data, 2025, based on 6% licensed listings)
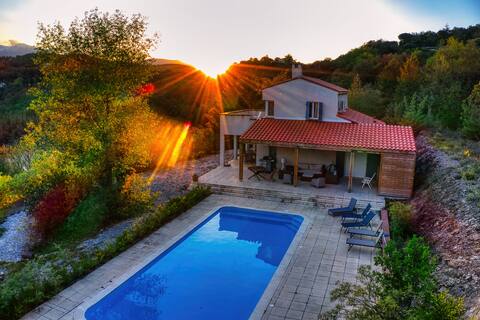
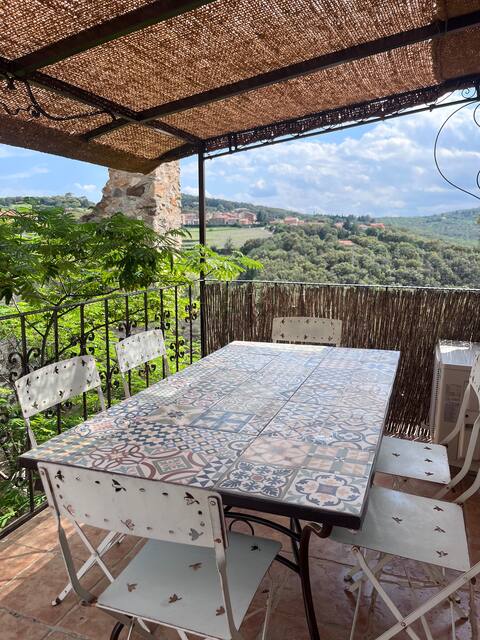
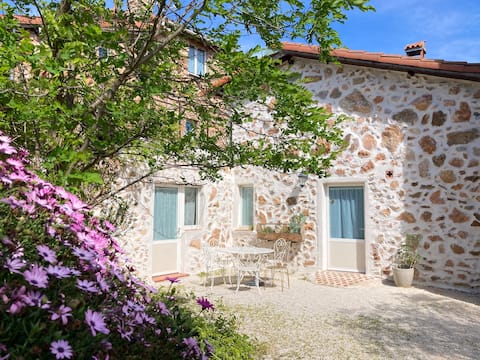
Top Performing Airbnb Properties in Oms (2025)
Benchmark your potential! Explore examples of top-performing Airbnb properties in Omsbased on Trailing Twelve Month (TTM) revenue. Analyze their characteristics, revenue, occupancy rate, and ADR to understand what drives success in this market.

the mas du vieux four
Entire Place • 3 bedrooms
Le Mas Tessa private accommodation 4 bedrooms 8 people
Entire Place • 4 bedrooms

6 person villa with pool
Entire Place • 3 bedrooms
Nature stay at the Orchidée cottage in the Pyrenees
Entire Place • 3 bedrooms
large quiet cottage with sunny terrace
Entire Place • 3 bedrooms
4-person gîte, pool, quiet and nature
Entire Place • 2 bedrooms
Note: Performance varies based on location, size, amenities, seasonality, and management quality. Data reflects the past 12 months.
Top Performing Airbnb Hosts in Oms (2025)
Learn from the best! This table showcases top-performing Airbnb hosts in Oms based on the number of properties managed and estimated total revenue over the past year. Analyze their scale and performance metrics.
| Host Name | Properties | Grossing Revenue | Stay Reviews | Avg Rating |
|---|---|---|---|---|
| Audrey | 6 | $56,176 | 64 | 4.98/5.0 |
| Annabelle | 3 | $36,643 | 95 | 4.98/5.0 |
| Isabelle | 1 | $31,983 | 5 | 4.60/5.0 |
| Caroline | 1 | $29,168 | 9 | 5.00/5.0 |
| Alexia | 3 | $16,262 | 57 | 4.95/5.0 |
| Clemence | 1 | $12,452 | 14 | 4.93/5.0 |
| Eric | 1 | $10,636 | 1 | Not Rated |
| Rob | 1 | $2,887 | 0 | Not Rated |
Analyzing the strategies of top hosts, such as their property selection, pricing, and guest communication, can offer valuable lessons for optimizing your own Airbnb operations in Oms.
Dive Deeper: Advanced Oms STR Market Data (2025)
Ready to unlock more insights? AirROI provides access to advanced metrics and comprehensive Airbnb data for Oms. Explore detailed analytics beyond this report to refine your investment strategy, optimize pricing, and maximize your vacation rental profits.
Explore Advanced MetricsOms Short-Term Rental Market Composition (2025): Property & Room Types
Room Type Distribution
Property Type Distribution
Market Composition Insights for Oms
- The Oms Airbnb market composition is heavily skewed towards Entire Home/Apt listings, which make up 82.4% of the 17 active rentals. This indicates strong guest preference for privacy and space.
- Looking at the property type distribution in Oms, House properties are the most common (52.9%), reflecting the local real estate landscape.
- Houses represent a significant 52.9% portion, catering likely to families or larger groups.
- The presence of 17.6% Hotel/Boutique listings indicates integration with traditional hospitality.
Oms Airbnb Room Capacity Analysis (2025): Bedroom Distribution
Distribution of Listings by Number of Bedrooms
Room Capacity Insights for Oms
- The dominant room capacity in Oms is 2 bedrooms listings, making up 41.2% of the market. This suggests a strong demand for properties suitable for couples or solo travelers.
- Together, 2 bedrooms and 3 bedrooms properties represent 64.7% of the active Airbnb listings in Oms, indicating a high concentration in these sizes.
- A significant 35.3% of listings offer 3+ bedrooms, catering to larger groups and families seeking more space in Oms.
Oms Vacation Rental Guest Capacity Trends (2025)
Distribution of Listings by Guest Capacity
Guest Capacity Insights for Oms
- The most common guest capacity trend in Oms vacation rentals is listings accommodating 4 guests (41.2%). This suggests the primary traveler segment is likely small families or groups.
- Properties designed for 4 guests and 8+ guests dominate the Oms STR market, accounting for 58.8% of listings.
- 35.2% of properties accommodate 6+ guests, serving the market segment for larger families or group travel in Oms.
- On average, properties in Oms are equipped to host 4.4 guests.
Oms Airbnb Booking Patterns (2025): Available vs. Booked Days
Available Days Distribution
Booked Days Distribution
Booking Pattern Insights for Oms
- The most common availability pattern in Oms falls within the 271-366 days range, representing 88.2% of listings. This suggests many properties have significant open periods on their calendars.
- Approximately 94.1% of listings show high availability (181+ days open annually), indicating potential for increased bookings or specific owner usage patterns.
- For booked days, the 31-90 days range is most frequent in Oms (64.7%), reflecting common guest stay durations or potential owner blocking patterns.
- A notable 5.9% of properties secure long booking periods (181+ days booked per year), highlighting successful long-term rental strategies or significant owner usage.
Oms Airbnb Minimum Stay Requirements Analysis
Distribution of Listings by Minimum Night Requirement
1 Night
4 listings
23.5% of total
4-6 Nights
1 listings
5.9% of total
7-29 Nights
2 listings
11.8% of total
30+ Nights
10 listings
58.8% of total
Key Insights
- The most prevalent minimum stay requirement in Oms is 30+ Nights, adopted by 58.8% of listings. This highlights the market's preference for longer commitments.
- A significant segment (58.8%) caters to monthly stays (30+ nights) in Oms, pointing to opportunities in the extended-stay market.
Recommendations
- Align with the market by considering a 30+ Nights minimum stay, as 58.8% of Oms hosts use this setting.
- If feasible, allowing 1-night stays, especially midweek or during low season, could capture last-minute bookings, as only 23.5% currently do.
- Explore offering discounts for stays of 30+ nights to attract the 58.8% of the market seeking extended stays.
- Adjust minimum nights based on seasonality – potentially shorter during low season and longer during peak demand periods in Oms.
Oms Airbnb Cancellation Policy Trends Analysis (2025)
Moderate
9 listings
52.9% of total
Firm
5 listings
29.4% of total
Strict
3 listings
17.6% of total
Cancellation Policy Insights for Oms
- The prevailing Airbnb cancellation policy trend in Oms is Moderate, used by 52.9% of listings.
- There's a relatively balanced mix between guest-friendly (52.9%) and stricter (47.0%) policies, offering choices for different guest needs.
Recommendations for Hosts
- Consider adopting a Moderate policy to align with the 52.9% market standard in Oms.
- Regularly review your cancellation policy against competitors and market demand shifts in Oms.
Oms STR Booking Lead Time Analysis (2025)
Average Booking Lead Time by Month
Booking Lead Time Insights for Oms
- The overall average booking lead time for vacation rentals in Oms is 67 days.
- Guests book furthest in advance for stays during April (average 107 days), likely coinciding with peak travel demand or local events.
- The shortest booking windows occur for stays in December (average 13 days), indicating more last-minute travel plans during this time.
- Seasonally, Spring (97 days avg.) sees the longest lead times, while Winter (41 days avg.) has the shortest, reflecting typical travel planning cycles.
Recommendations for Hosts
- Use the overall average lead time (67 days) as a baseline for your pricing and availability strategy in Oms.
- For April stays, consider implementing length-of-stay discounts or slightly higher rates for bookings made less than 107 days out to capitalize on advance planning.
- During December, focus on last-minute booking availability and promotions, as guests book with very short notice (13 days avg.).
- Target marketing efforts for the Spring season well in advance (at least 97 days) to capture early planners.
- Monitor your own booking lead times against these Oms averages to identify opportunities for dynamic pricing adjustments.
Popular & Essential Airbnb Amenities in Oms (2025)
Amenity Prevalence
Amenity Insights for Oms
- Essential amenities in Oms that guests expect include: Free parking on premises. Lacking these (this) could significantly impact bookings.
- Popular amenities like TV, Wifi, Smoke alarm are common but not universal. Offering these can provide a competitive edge.
- A pool is a highly desired but not standard amenity, making it a key feature for attracting guests seeking leisure in Oms.
- Warning: Wifi is not universally provided but is considered essential globally. Ensure reliable Wifi is offered.
Recommendations for Hosts
- Ensure your listing includes all essential amenities for Oms: Free parking on premises.
- Consider adding popular differentiators like TV or Wifi to increase appeal.
- Highlight unique or less common amenities you offer (e.g., hot tub, dedicated workspace, EV charger) in your listing description and photos.
- Regularly check competitor amenities in Oms to stay competitive.
Oms Airbnb Guest Demographics & Profile Analysis (2025)
Guest Profile Summary for Oms
- The typical guest profile for Airbnb in Oms consists of a mix of domestic (59%) and international guests, often arriving from nearby Barcelona, typically belonging to the Post-2000s (Gen Z/Alpha) group (50%), primarily speaking Spanish or English.
- Domestic travelers account for 59.3% of guests.
- Key international markets include France (59.3%) and Spain (29.6%).
- Top languages spoken are Spanish (32.4%) followed by English (23.5%).
- A significant demographic segment is the Post-2000s (Gen Z/Alpha) group, representing 50% of guests.
Recommendations for Hosts
- Balance marketing efforts between domestic and international channels based on the guest mix.
- Tailor amenities and listing descriptions to appeal to the dominant Post-2000s (Gen Z/Alpha) demographic (e.g., highlight fast WiFi, smart home features, local guides).
- Highlight unique local experiences or amenities relevant to the primary guest profile.
- Consider seasonal promotions aligned with peak travel times for key origin markets.
Nearby Short-Term Rental Market Comparison
How does the Oms Airbnb market stack up against its neighbors? Compare key performance metrics like average monthly revenue, ADR, and occupancy rates in surrounding areas to understand the broader regional STR landscape.
| Market | Active Properties | Monthly Revenue | Daily Rate | Avg. Occupancy |
|---|---|---|---|---|
| Vall-llobrega | 15 | $12,259 | $907.49 | 43% |
| Cornellà del Terri | 14 | $6,757 | $606.30 | 40% |
| Canyelles | 48 | $6,074 | $1199.19 | 32% |
| Tiana | 14 | $5,286 | $343.84 | 43% |
| Teià | 24 | $5,255 | $415.34 | 40% |
| Sant Vicenç de Montalt | 38 | $5,115 | $421.01 | 37% |
| Sant Andreu de Llavaneres | 44 | $4,985 | $500.74 | 38% |
| Amer | 11 | $4,860 | $469.96 | 36% |
| Villeneuvette | 12 | $4,669 | $403.10 | 43% |
| la Baronia de Rialb | 16 | $4,612 | $433.42 | 43% |