Narbonne Airbnb Market Analysis 2026: Short Term Rental Data & Vacation Rental Statistics in Occitania, France
Is Airbnb profitable in Narbonne in 2026? Explore comprehensive Airbnb analytics for Narbonne, Occitania, France to uncover income potential. This 2026 STR market report for Narbonne, based on AirROI data from February 2025 to January 2026, reveals key trends in the bustling market of 1,084 active listings.
Whether you're considering an Airbnb investment in Narbonne, optimizing your existing vacation rental, or exploring rental arbitrage opportunities, understanding the Narbonne Airbnb data is crucial. Leveraging the low regulation environment is key to maximizing your short term rental income potential. Let's dive into the specifics.
Key Narbonne Airbnb Performance Metrics Overview
Monthly Airbnb Revenue Variations & Income Potential in Narbonne (2026)
Understanding the monthly revenue variations for Airbnb listings in Narbonne is key to maximizing your short term rental income potential. Seasonality significantly impacts earnings. Our analysis, based on data from the past 12 months, shows that the peak revenue month for STRs in Narbonne is typically August, while February often presents the lowest earnings, highlighting opportunities for strategic pricing adjustments during shoulder and low seasons. Explore the typical Airbnb income in Narbonne across different performance tiers:
- Best-in-class properties (Top 10%) achieve $2,651+ monthly, often utilizing dynamic pricing and superior guest experiences.
- Strong performing properties (Top 25%) earn $1,730 or more, indicating effective management and desirable locations/amenities.
- Typical properties (Median) generate around $1,036 per month, representing the average market performance.
- Entry-level properties (Bottom 25%) see earnings around $525, often with potential for optimization.
Average Monthly Airbnb Earnings Trend in Narbonne
Narbonne Airbnb Occupancy Rate Trends (2026)
Maximize your bookings by understanding the Narbonne STR occupancy trends. Seasonal demand shifts significantly influence how often properties are booked. Typically, Augustsees the highest demand (peak season occupancy), while January experiences the lowest (low season). Effective strategies, like adjusting minimum stays or offering promotions, can boost occupancy during slower periods. Here's how different property tiers perform in Narbonne:
- Best-in-class properties (Top 10%) achieve 77%+ occupancy, indicating high desirability and potentially optimized availability.
- Strong performing properties (Top 25%) maintain 59% or higher occupancy, suggesting good market fit and guest satisfaction.
- Typical properties (Median) have an occupancy rate around 37%.
- Entry-level properties (Bottom 25%) average 17% occupancy, potentially facing higher vacancy.
Average Monthly Occupancy Rate Trend in Narbonne
Average Daily Rate (ADR) Airbnb Trends in Narbonne (2026)
Effective short term rental pricing strategy in Narbonne involves understanding monthly ADR fluctuations. The Average Daily Rate (ADR) for Airbnb in Narbonne typically peaks in August and dips lowest during March. Leveraging Airbnb dynamic pricing tools or strategies based on this seasonality can significantly boost revenue. Here's a look at the typical nightly rates achieved:
- Best-in-class properties (Top 10%) command rates of $206+ per night, often due to premium features or locations.
- Strong performing properties (Top 25%) achieve nightly rates of $135 or more.
- Typical properties (Median) charge around $92 per night.
- Entry-level properties (Bottom 25%) earn around $70 per night.
Average Daily Rate (ADR) Trend by Month in Narbonne
Get Live Narbonne Market Intelligence 👇

Explore Real-time Analytics
Airbnb Seasonality Analysis & Trends in Narbonne (2026)
Peak Season (August, July, October)
- Revenue averages $1,943 per month
- Occupancy rates average 49.7%
- Daily rates average $124
Shoulder Season
- Revenue averages $1,257 per month
- Occupancy maintains around 37.4%
- Daily rates hold near $117
Low Season (January, February, March)
- Revenue drops to average $975 per month
- Occupancy decreases to average 33.5%
- Daily rates adjust to average $112
Seasonality Insights for Narbonne
- The Airbnb seasonality in Narbonne shows highly seasonal trends requiring careful strategy. While the sections above show seasonal averages, it's also insightful to look at the extremes:
- During the high season, the absolute peak month showcases Narbonne's highest earning potential, with monthly revenues capable of climbing to $2,466, occupancy reaching a high of 61.1%, and ADRs peaking at $126.
- Conversely, the slowest single month of the year, typically falling within the low season, marks the market's lowest point. In this month, revenue might dip to $911, occupancy could drop to 27.9%, and ADRs may adjust down to $108.
- Understanding both the seasonal averages and these monthly peaks and troughs in revenue, occupancy, and ADR is crucial for maximizing your Airbnb profit potential in Narbonne.
Seasonal Strategies for Maximizing Profit
- Peak Season: Maximize revenue through premium pricing and potentially longer minimum stays. Ensure high availability.
- Low Season: Offer competitive pricing, special promotions (e.g., extended stay discounts), and flexible cancellation policies. Target off-season travelers like remote workers or budget-conscious guests.
- Shoulder Seasons: Implement dynamic pricing that balances peak and low rates. Target weekend travelers or specific events. Offer slightly more flexible terms than peak season.
- Regularly analyze your own performance against these Narbonne seasonality benchmarks and adjust your pricing and availability strategy accordingly.
Best Areas for Airbnb Investment in Narbonne (2026)
Exploring the top neighborhoods for short-term rentals in Narbonne? This section highlights key areas, outlining why they are attractive for hosts and guests, along with notable local attractions. Consider these locations based on your target guest profile and investment strategy.
| Neighborhood / Area | Why Host Here? (Target Guests & Appeal) | Key Attractions & Landmarks |
|---|---|---|
| Cité de Carcassonne | An UNESCO World Heritage site, this medieval fortress attracts tourists from all over the world. It offers a fascinating historical experience and picturesque views, ideal for those who appreciate rich history and architecture. | Carcassonne Castle, Basilica of Saint-Nazaire, Aude River, Cité de Carcassonne, Canal du Midi |
| Plage de Narbonne | A beautiful beach area that attracts sun-seekers and families. It provides a relaxing atmosphere close to nature and water activities, making it perfect for vacation rentals during the summer months. | Narbonne Beach, Water sports, Beachside restaurants, Vibrant boardwalk, Family-friendly activities |
| Historic Center of Narbonne | The historic heart of Narbonne is rich in Roman heritage and medieval architecture, attracting history enthusiasts and tourists eager to explore its quaint streets and local shops. | Palais des Archevêques, Les Halles de Narbonne, Narbonne Cathedral, Roman Via Domitia, Museum of Archaeology |
| Fontfroide Abbey | A stunning rural site offering a chance to experience the beauty of nature and history. This tranquil setting can attract visitors seeking peace and culture, especially during summer concerts and events. | Fontfroide Abbey, Gardens of Fontfroide, Wine tastings, Nature walks, Cultural events |
| Bages | A charming village on the edge of a lagoon, known for its picturesque houses and seafood. Ideal for those looking for a peaceful getaway near water activities and nature. | Lac de Bages, Seafront restaurants, Birdwatching, Charming village ambiance, Nearby hiking trails |
| Gruissan | Famous for its medieval tower and scenic beaches, Gruissan is a perfect location for those seeking a vibrant seaside experience with plenty of outdoor activities and local festivals. | Gruissan's Medieval Tower, Beaches, Water sports, Local markets, Seafood restaurants |
| Narbonne Plage | A popular destination during the summer, Narbonne Plage is favored by families and beach enthusiasts, making it an excellent choice for vacation rentals with easy access to the beach. | Wide sandy beaches, Water sports, Beachfront cafes, Camping sites, Summer festivals |
| Les Ayguades | A less crowded area with beautiful beaches and a calm atmosphere. Perfect for tourists looking for tranquility and beautiful natural landscapes, ideal for longer stays. | Ayguades Beach, Nature walks, Quiet beach spots, Cycling paths, Watersports |
Understanding Airbnb License Requirements & STR Laws in Narbonne (2026)
While Narbonne, Occitania, France currently shows low STR regulations, specific Airbnb license requirements might still exist or change. Always verify the latest short term rental regulations and Airbnb license requirements directly with local government authorities for Narbonne to ensure full compliance before hosting.
(Source: AirROI data, 2026, based on 9% licensed listings)
Top Performing Airbnb Properties in Narbonne (2026)
Benchmark your potential! Explore examples of top-performing Airbnb properties in Narbonnebased on Trailing Twelve Month (TTM) revenue. Analyze their characteristics, revenue, occupancy rate, and ADR to understand what drives success in this market.
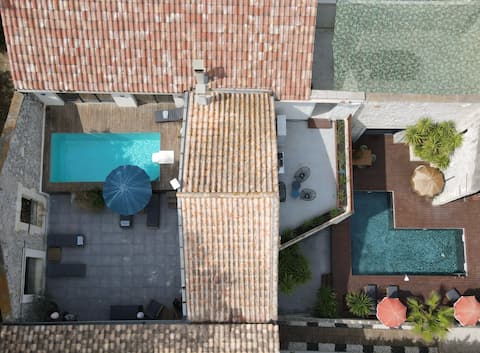
Mediterranean Duo – 2 swimming pools
Entire Place • 7 bedrooms
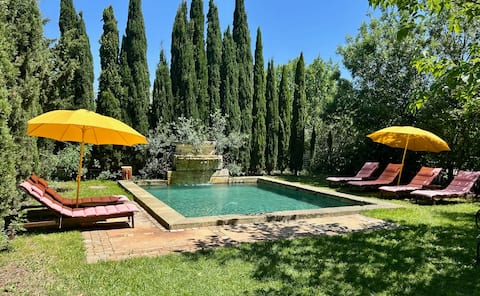
Large Vacation Home 5 minutes from the city center
Entire Place • 4 bedrooms

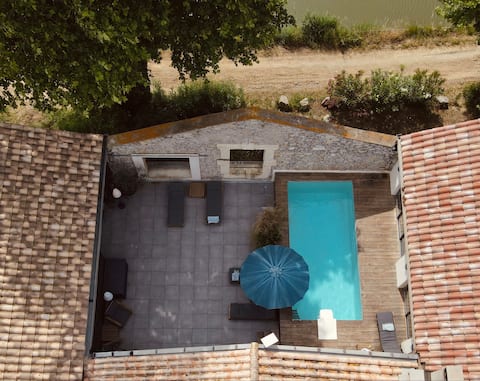
villa sophora special announcement large buffet
Entire Place • 5 bedrooms

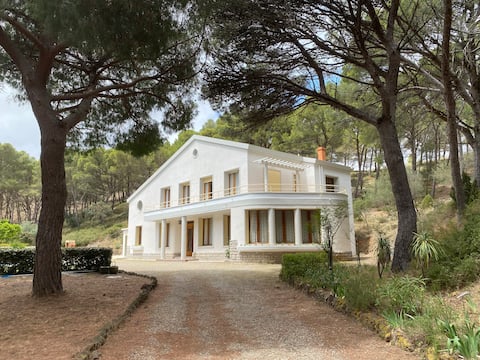
Luxury 5 bedroom private pool villa, Narbonne
Entire Place • 5 bedrooms
Penthouse - Pool - Canal view by Salty Dayz
Entire Place • 4 bedrooms
Family home 300 m from the sea
Entire Place • 5 bedrooms
Note: Performance varies based on location, size, amenities, seasonality, and management quality. Data reflects the past 12 months.
Top Performing Airbnb Hosts in Narbonne (2026)
Learn from the best! This table showcases top-performing Airbnb hosts in Narbonne based on the number of properties managed and estimated total revenue over the past year. Analyze their scale and performance metrics.
| Host Name | Properties | Grossing Revenue | Stay Reviews | Avg Rating |
|---|---|---|---|---|
| Les Clés De Charlotte | 5 | $328,493 | 100 | 4.91/5.0 |
| Manuel | 13 | $132,490 | 164 | 4.87/5.0 |
| Olivier | 1 | $122,373 | 22 | 5.00/5.0 |
| Vincent | 5 | $114,602 | 593 | 4.86/5.0 |
| Sebastien Et Audrey | 5 | $104,970 | 782 | 4.81/5.0 |
| Andréa | 2 | $103,042 | 87 | 4.96/5.0 |
| Thomas | 1 | $96,800 | 31 | 5.00/5.0 |
| Loic | 11 | $96,154 | 928 | 4.56/5.0 |
| Alexis | 16 | $95,888 | 194 | 4.51/5.0 |
| Rimi | 4 | $95,200 | 323 | 4.93/5.0 |
Analyzing the strategies of top hosts, such as their property selection, pricing, and guest communication, can offer valuable lessons for optimizing your own Airbnb operations in Narbonne.
Dive Deeper: Advanced Narbonne STR Market Data (2026)
Ready to unlock more insights? AirROI provides access to advanced metrics and comprehensive Airbnb data for Narbonne. Explore detailed analytics beyond this report to refine your investment strategy, optimize pricing, and maximize your vacation rental profits.
Explore Advanced MetricsNarbonne Short-Term Rental Market Composition (2026): Property & Room Types
Room Type Distribution
Property Type Distribution
Market Composition Insights for Narbonne
- The Narbonne Airbnb market composition is heavily skewed towards Entire Home/Apt listings, which make up 95% of the 1,084 active rentals. This indicates strong guest preference for privacy and space.
- Looking at the property type distribution in Narbonne, Apartment/Condo properties are the most common (68.1%), reflecting the local real estate landscape.
- Houses represent a significant 27.8% portion, catering likely to families or larger groups.
- Smaller segments like hotel/boutique, outdoor/unique, others (combined 4.1%) offer potential for unique stay experiences.
Narbonne Airbnb Room Capacity Analysis (2026): Bedroom Distribution
Distribution of Listings by Number of Bedrooms
Room Capacity Insights for Narbonne
- The dominant room capacity in Narbonne is 1 bedroom listings, making up 41.2% of the market. This suggests a strong demand for properties suitable for couples or solo travelers.
- Together, 1 bedroom and 2 bedrooms properties represent 67.9% of the active Airbnb listings in Narbonne, indicating a high concentration in these sizes.
Narbonne Vacation Rental Guest Capacity Trends (2026)
Distribution of Listings by Guest Capacity
Guest Capacity Insights for Narbonne
- The most common guest capacity trend in Narbonne vacation rentals is listings accommodating 4 guests (33.9%). This suggests the primary traveler segment is likely small families or groups.
- Properties designed for 4 guests and 2 guests dominate the Narbonne STR market, accounting for 60.7% of listings.
- 24.9% of properties accommodate 6+ guests, serving the market segment for larger families or group travel in Narbonne.
- On average, properties in Narbonne are equipped to host 4.0 guests.
Narbonne Airbnb Booking Patterns (2026): Available vs. Booked Days
Available Days Distribution
Booked Days Distribution
Booking Pattern Insights for Narbonne
- The most common availability pattern in Narbonne falls within the 271-366 days range, representing 56.5% of listings. This suggests many properties have significant open periods on their calendars.
- Approximately 84.6% of listings show high availability (181+ days open annually), indicating potential for increased bookings or specific owner usage patterns.
- For booked days, the 31-90 days range is most frequent in Narbonne (34.4%), reflecting common guest stay durations or potential owner blocking patterns.
- A notable 16.1% of properties secure long booking periods (181+ days booked per year), highlighting successful long-term rental strategies or significant owner usage.
Narbonne Airbnb Minimum Stay Requirements Analysis
Distribution of Listings by Minimum Night Requirement
1 Night
220 listings
20.3% of total
2 Nights
181 listings
16.7% of total
3 Nights
60 listings
5.5% of total
4-6 Nights
100 listings
9.2% of total
7-29 Nights
58 listings
5.4% of total
30+ Nights
465 listings
42.9% of total
Key Insights
- The most prevalent minimum stay requirement in Narbonne is 30+ Nights, adopted by 42.9% of listings. This highlights the market's preference for longer commitments.
- A significant segment (42.9%) caters to monthly stays (30+ nights) in Narbonne, pointing to opportunities in the extended-stay market.
Recommendations
- Align with the market by considering a 30+ Nights minimum stay, as 42.9% of Narbonne hosts use this setting.
- If feasible, allowing 1-night stays, especially midweek or during low season, could capture last-minute bookings, as only 20.3% currently do.
- Explore offering discounts for stays of 30+ nights to attract the 42.9% of the market seeking extended stays.
- Adjust minimum nights based on seasonality – potentially shorter during low season and longer during peak demand periods in Narbonne.
Narbonne Airbnb Cancellation Policy Trends Analysis (2026)
Super Strict 60 Days
14 listings
1.3% of total
Super Strict 30 Days
3 listings
0.3% of total
Limited
1 listings
0.1% of total
Flexible
321 listings
29.7% of total
Moderate
308 listings
28.5% of total
Firm
312 listings
28.9% of total
Strict
122 listings
11.3% of total
Cancellation Policy Insights for Narbonne
- The prevailing Airbnb cancellation policy trend in Narbonne is Flexible, used by 29.7% of listings.
- There's a relatively balanced mix between guest-friendly (58.2%) and stricter (40.2%) policies, offering choices for different guest needs.
Recommendations for Hosts
- Consider adopting a Flexible policy to align with the 29.7% market standard in Narbonne.
- Using a Strict policy might deter some guests, as only 11.3% of listings use it. Evaluate if potential revenue protection outweighs possible lower booking rates.
- Regularly review your cancellation policy against competitors and market demand shifts in Narbonne.
Narbonne STR Booking Lead Time Analysis (2026)
Average Booking Lead Time by Month
Booking Lead Time Insights for Narbonne
- The overall average booking lead time for vacation rentals in Narbonne is 50 days.
- Guests book furthest in advance for stays during August (average 72 days), likely coinciding with peak travel demand or local events.
- The shortest booking windows occur for stays in February (average 34 days), indicating more last-minute travel plans during this time.
- Seasonally, Summer (60 days avg.) sees the longest lead times, while Winter (37 days avg.) has the shortest, reflecting typical travel planning cycles.
Recommendations for Hosts
- Use the overall average lead time (50 days) as a baseline for your pricing and availability strategy in Narbonne.
- For August stays, consider implementing length-of-stay discounts or slightly higher rates for bookings made less than 72 days out to capitalize on advance planning.
- Target marketing efforts for the Summer season well in advance (at least 60 days) to capture early planners.
- Monitor your own booking lead times against these Narbonne averages to identify opportunities for dynamic pricing adjustments.
Popular & Essential Airbnb Amenities in Narbonne (2026)
Amenity Prevalence
Amenity Insights for Narbonne
- Popular amenities like TV, Kitchen, Heating are common but not universal. Offering these can provide a competitive edge.
Recommendations for Hosts
- Consider adding popular differentiators like TV or Kitchen to increase appeal.
- Highlight unique or less common amenities you offer (e.g., hot tub, dedicated workspace, EV charger) in your listing description and photos.
- Regularly check competitor amenities in Narbonne to stay competitive.
Narbonne Airbnb Guest Demographics & Profile Analysis (2026)
Guest Profile Summary for Narbonne
- The typical guest profile for Airbnb in Narbonne consists of primarily domestic travelers (74%), often arriving from nearby Toulouse, typically belonging to the Post-2000s (Gen Z/Alpha) group (50%), primarily speaking French or English.
- Domestic travelers account for 73.7% of guests.
- Key international markets include France (73.7%) and Spain (6.7%).
- Top languages spoken are French (38.8%) followed by English (33%).
- A significant demographic segment is the Post-2000s (Gen Z/Alpha) group, representing 50% of guests.
Recommendations for Hosts
- Target domestic marketing efforts towards travelers from Toulouse and Paris.
- Tailor amenities and listing descriptions to appeal to the dominant Post-2000s (Gen Z/Alpha) demographic (e.g., highlight fast WiFi, smart home features, local guides).
- Highlight unique local experiences or amenities relevant to the primary guest profile.
- Consider seasonal promotions aligned with peak travel times for key origin markets.
Nearby Short-Term Rental Market Comparison
How does the Narbonne Airbnb market stack up against its neighbors? Compare key performance metrics like average monthly revenue, ADR, and occupancy rates in surrounding areas to understand the broader regional STR landscape.
| Market | Active Properties | Monthly Revenue | Daily Rate | Avg. Occupancy |
|---|---|---|---|---|
| Cornellà del Terri | 15 | $6,458 | $584.61 | 40% |
| Amer | 11 | $4,949 | $462.57 | 38% |
| Vilanant | 12 | $4,526 | $404.10 | 36% |
| Porqueres | 13 | $4,304 | $512.14 | 31% |
| Sant Ferriol | 18 | $3,987 | $316.31 | 43% |
| Bàscara | 13 | $3,777 | $563.92 | 31% |
| Vilademuls | 21 | $3,518 | $352.52 | 38% |
| Cavillargues | 12 | $3,274 | $342.99 | 43% |
| Eygalières | 82 | $3,206 | $417.97 | 39% |
| les Llosses | 10 | $3,165 | $392.85 | 32% |