Montpellier Airbnb Market Analysis 2026: Short Term Rental Data & Vacation Rental Statistics in Occitania, France
Is Airbnb profitable in Montpellier in 2026? Explore comprehensive Airbnb analytics for Montpellier, Occitania, France to uncover income potential. This 2026 STR market report for Montpellier, based on AirROI data from February 2025 to January 2026, reveals key trends in the bustling market of 3,165 active listings.
Whether you're considering an Airbnb investment in Montpellier, optimizing your existing vacation rental, or exploring rental arbitrage opportunities, understanding the Montpellier Airbnb data is crucial. Navigating the high regulation landscape is key to maximizing your short term rental income potential. Let's dive into the specifics.
Key Montpellier Airbnb Performance Metrics Overview
Monthly Airbnb Revenue Variations & Income Potential in Montpellier (2026)
Understanding the monthly revenue variations for Airbnb listings in Montpellier is key to maximizing your short term rental income potential. Seasonality significantly impacts earnings. Our analysis, based on data from the past 12 months, shows that the peak revenue month for STRs in Montpellier is typically August, while January often presents the lowest earnings, highlighting opportunities for strategic pricing adjustments during shoulder and low seasons. Explore the typical Airbnb income in Montpellier across different performance tiers:
- Best-in-class properties (Top 10%) achieve $2,859+ monthly, often utilizing dynamic pricing and superior guest experiences.
- Strong performing properties (Top 25%) earn $1,948 or more, indicating effective management and desirable locations/amenities.
- Typical properties (Median) generate around $1,232 per month, representing the average market performance.
- Entry-level properties (Bottom 25%) see earnings around $622, often with potential for optimization.
Average Monthly Airbnb Earnings Trend in Montpellier
Montpellier Airbnb Occupancy Rate Trends (2026)
Maximize your bookings by understanding the Montpellier STR occupancy trends. Seasonal demand shifts significantly influence how often properties are booked. Typically, Augustsees the highest demand (peak season occupancy), while January experiences the lowest (low season). Effective strategies, like adjusting minimum stays or offering promotions, can boost occupancy during slower periods. Here's how different property tiers perform in Montpellier:
- Best-in-class properties (Top 10%) achieve 86%+ occupancy, indicating high desirability and potentially optimized availability.
- Strong performing properties (Top 25%) maintain 72% or higher occupancy, suggesting good market fit and guest satisfaction.
- Typical properties (Median) have an occupancy rate around 50%.
- Entry-level properties (Bottom 25%) average 25% occupancy, potentially facing higher vacancy.
Average Monthly Occupancy Rate Trend in Montpellier
Average Daily Rate (ADR) Airbnb Trends in Montpellier (2026)
Effective short term rental pricing strategy in Montpellier involves understanding monthly ADR fluctuations. The Average Daily Rate (ADR) for Airbnb in Montpellier typically peaks in September and dips lowest during March. Leveraging Airbnb dynamic pricing tools or strategies based on this seasonality can significantly boost revenue. Here's a look at the typical nightly rates achieved:
- Best-in-class properties (Top 10%) command rates of $173+ per night, often due to premium features or locations.
- Strong performing properties (Top 25%) achieve nightly rates of $116 or more.
- Typical properties (Median) charge around $82 per night.
- Entry-level properties (Bottom 25%) earn around $60 per night.
Average Daily Rate (ADR) Trend by Month in Montpellier
Get Live Montpellier Market Intelligence 👇

Explore Real-time Analytics
Airbnb Seasonality Analysis & Trends in Montpellier (2026)
Peak Season (August, July, September)
- Revenue averages $1,923 per month
- Occupancy rates average 54.9%
- Daily rates average $106
Shoulder Season
- Revenue averages $1,456 per month
- Occupancy maintains around 48.6%
- Daily rates hold near $101
Low Season (January, February, March)
- Revenue drops to average $1,110 per month
- Occupancy decreases to average 43.7%
- Daily rates adjust to average $96
Seasonality Insights for Montpellier
- The Airbnb seasonality in Montpellier shows highly seasonal trends requiring careful strategy. While the sections above show seasonal averages, it's also insightful to look at the extremes:
- During the high season, the absolute peak month showcases Montpellier's highest earning potential, with monthly revenues capable of climbing to $2,145, occupancy reaching a high of 59.2%, and ADRs peaking at $108.
- Conversely, the slowest single month of the year, typically falling within the low season, marks the market's lowest point. In this month, revenue might dip to $979, occupancy could drop to 33.9%, and ADRs may adjust down to $93.
- Understanding both the seasonal averages and these monthly peaks and troughs in revenue, occupancy, and ADR is crucial for maximizing your Airbnb profit potential in Montpellier.
Seasonal Strategies for Maximizing Profit
- Peak Season: Maximize revenue through premium pricing and potentially longer minimum stays. Ensure high availability.
- Low Season: Offer competitive pricing, special promotions (e.g., extended stay discounts), and flexible cancellation policies. Target off-season travelers like remote workers or budget-conscious guests.
- Shoulder Seasons: Implement dynamic pricing that balances peak and low rates. Target weekend travelers or specific events. Offer slightly more flexible terms than peak season.
- Regularly analyze your own performance against these Montpellier seasonality benchmarks and adjust your pricing and availability strategy accordingly.
Best Areas for Airbnb Investment in Montpellier (2026)
Exploring the top neighborhoods for short-term rentals in Montpellier? This section highlights key areas, outlining why they are attractive for hosts and guests, along with notable local attractions. Consider these locations based on your target guest profile and investment strategy.
| Neighborhood / Area | Why Host Here? (Target Guests & Appeal) | Key Attractions & Landmarks |
|---|---|---|
| Historic Centre | The heart of Montpellier filled with medieval architecture, vibrant squares, and rich history. A top destination for tourists looking to explore local culture and enjoy cafés and restaurants. | Place de la Comédie, Cathedral of Saint Peter, Museums of Montpelliérais, Rue de la Loge, Jardin des Plantes |
| Antigone | This modern neighborhood designed by architect Ricardo Bofill offers a unique architectural style and is located near the historical center. It's appealing for its modern amenities and proximity to the river. | Esplanade de l'Europe, Le Polygone Shopping Centre, Parc Rabelais, The Antigone District, Odysseum |
| Port Marianne | A newly developed area that is rapidly becoming popular, known for its contemporary buildings and proximity to the Lez River. Ideal for those seeking a modern ambiance with easy access to the city center. | Parc Marianne, Les Rives du Lez, Shopping at Carrefour, Restaurants along the river, Canoeing on the Lez |
| Les Beaux-Arts | A charming district characterized by its artistic vibe, trendy cafés, and art galleries. Attracts those who appreciate a bohemian lifestyle and local arts scene. | Musée Fabre, Local Art Galleries, Place Jean Jaurès, Café de la Gare, Street Art |
| Clemenceau | A lively area known for its markets and local dining options. Offers a more authentic experience away from the tourist spots but still close to key attractions. | Marché de Les Halles, Place Clemenceau, Local Bistros, La Panacée, Cinema Gaumont |
| Occitanie University | Ideal for students and young adults, with plenty of amenities and cafes. A great location for hosting short-term rentals targeting students and academic visitors. | University Campus, Nearby Parks, Cafés, Student Hangouts, Public Transport Links |
| L’Observatoire | A calm and residential area with a mix of green spaces. Attractive for families and travelers looking for a serene yet connected stay in Montpellier. | Parc du Domaine de Méric, Observatory of Montpellier, Local parks and playgrounds, Family-friendly cafes, Cycling paths |
| La Mosson | Popular with sports enthusiasts due to its proximity to the stadium. A fantastic option for visitors coming to attend events or enjoy active lifestyles. | Stadium de la Mosson, Sports Events, Nearby Parks, Local Restaurants, Public Transport Access |
Understanding Airbnb License Requirements & STR Laws in Montpellier (2026)
Yes, Montpellier, Occitania, France enforces high STR regulations. Obtaining a license and ensuring compliance is almost certainly required according to current 2026 STR laws. Always verify the latest short term rental regulations and Airbnb license requirements directly with local government authorities for Montpellier to ensure full compliance before hosting.
(Source: AirROI data, 2026, based on 74% licensed listings)
Top Performing Airbnb Properties in Montpellier (2026)
Benchmark your potential! Explore examples of top-performing Airbnb properties in Montpellierbased on Trailing Twelve Month (TTM) revenue. Analyze their characteristics, revenue, occupancy rate, and ADR to understand what drives success in this market.
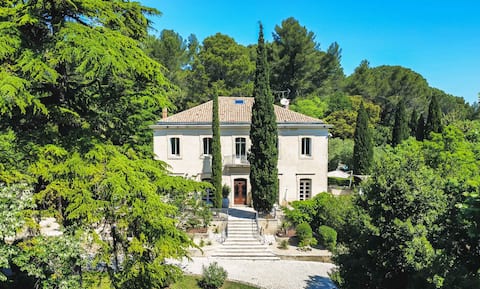
Bastide Castella – Privatization – Pool/Jacuzzi
Entire Place • 6 bedrooms
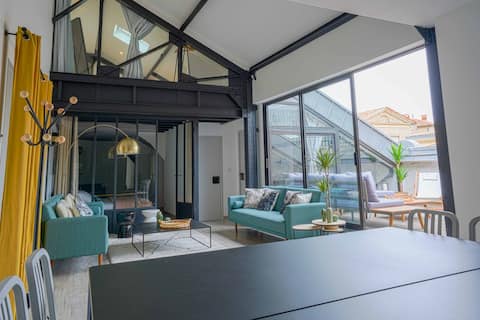
NOCNOC Le Loft- Superb apartment with terrace
Entire Place • 5 bedrooms
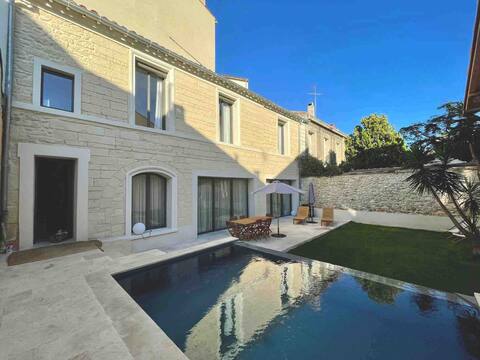
Incredible Villa Garden Pool – Heart of Town –
Entire Place • 3 bedrooms
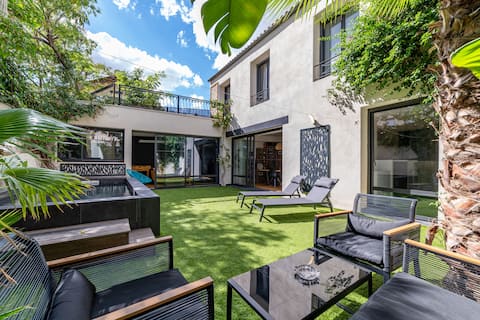
House with intimate garden in the city center
Entire Place • 3 bedrooms

Family home
Entire Place • 3 bedrooms
Nocnoc Le Zellige Small pool and private garden
Entire Place • 5 bedrooms
Note: Performance varies based on location, size, amenities, seasonality, and management quality. Data reflects the past 12 months.
Top Performing Airbnb Hosts in Montpellier (2026)
Learn from the best! This table showcases top-performing Airbnb hosts in Montpellier based on the number of properties managed and estimated total revenue over the past year. Analyze their scale and performance metrics.
| Host Name | Properties | Grossing Revenue | Stay Reviews | Avg Rating |
|---|---|---|---|---|
| Geoffrey- Couette & Oreillers | 63 | $882,295 | 2688 | 4.43/5.0 |
| Mathieu | 40 | $601,675 | 3596 | 4.57/5.0 |
| Louane | 10 | $585,231 | 746 | 4.60/5.0 |
| Conciergerie BNB Boost | 25 | $466,554 | 1509 | 4.57/5.0 |
| Première Conciergerie | 27 | $432,349 | 758 | 4.43/5.0 |
| Manon | 24 | $401,088 | 741 | 4.51/5.0 |
| Vanessa | 26 | $341,183 | 1057 | 4.43/5.0 |
| Corentin | 15 | $275,038 | 509 | 4.69/5.0 |
| Eva | 14 | $261,247 | 2034 | 4.81/5.0 |
| Julien | 12 | $239,335 | 1573 | 4.85/5.0 |
Analyzing the strategies of top hosts, such as their property selection, pricing, and guest communication, can offer valuable lessons for optimizing your own Airbnb operations in Montpellier.
Dive Deeper: Advanced Montpellier STR Market Data (2026)
Ready to unlock more insights? AirROI provides access to advanced metrics and comprehensive Airbnb data for Montpellier. Explore detailed analytics beyond this report to refine your investment strategy, optimize pricing, and maximize your vacation rental profits.
Explore Advanced MetricsMontpellier Short-Term Rental Market Composition (2026): Property & Room Types
Room Type Distribution
Property Type Distribution
Market Composition Insights for Montpellier
- The Montpellier Airbnb market composition is heavily skewed towards Entire Home/Apt listings, which make up 82.9% of the 3,165 active rentals. This indicates strong guest preference for privacy and space.
- Looking at the property type distribution in Montpellier, Apartment/Condo properties are the most common (83%), reflecting the local real estate landscape.
- Smaller segments like hotel/boutique, others, unique stays, outdoor/unique (combined 3.8%) offer potential for unique stay experiences.
Montpellier Airbnb Room Capacity Analysis (2026): Bedroom Distribution
Distribution of Listings by Number of Bedrooms
Room Capacity Insights for Montpellier
- The dominant room capacity in Montpellier is 1 bedroom listings, making up 44.7% of the market. This suggests a strong demand for properties suitable for couples or solo travelers.
- Together, 1 bedroom and 2 bedrooms properties represent 62.9% of the active Airbnb listings in Montpellier, indicating a high concentration in these sizes.
Montpellier Vacation Rental Guest Capacity Trends (2026)
Distribution of Listings by Guest Capacity
Guest Capacity Insights for Montpellier
- The most common guest capacity trend in Montpellier vacation rentals is listings accommodating 2 guests (35.1%). This suggests the primary traveler segment is likely couples or solo travelers.
- Properties designed for 2 guests and 4 guests dominate the Montpellier STR market, accounting for 61.0% of listings.
- 13.3% of properties accommodate 6+ guests, serving the market segment for larger families or group travel in Montpellier.
- On average, properties in Montpellier are equipped to host 3.0 guests.
Montpellier Airbnb Booking Patterns (2026): Available vs. Booked Days
Available Days Distribution
Booked Days Distribution
Booking Pattern Insights for Montpellier
- The most common availability pattern in Montpellier falls within the 271-366 days range, representing 43.6% of listings. This suggests many properties have significant open periods on their calendars.
- Approximately 73.7% of listings show high availability (181+ days open annually), indicating potential for increased bookings or specific owner usage patterns.
- For booked days, the 91-180 days range is most frequent in Montpellier (30.5%), reflecting common guest stay durations or potential owner blocking patterns.
- A notable 27.4% of properties secure long booking periods (181+ days booked per year), highlighting successful long-term rental strategies or significant owner usage.
Montpellier Airbnb Minimum Stay Requirements Analysis
Distribution of Listings by Minimum Night Requirement
1 Night
536 listings
16.9% of total
2 Nights
593 listings
18.7% of total
3 Nights
317 listings
10% of total
4-6 Nights
328 listings
10.4% of total
7-29 Nights
156 listings
4.9% of total
30+ Nights
1235 listings
39% of total
Key Insights
- The most prevalent minimum stay requirement in Montpellier is 30+ Nights, adopted by 39% of listings. This highlights the market's preference for longer commitments.
- A significant segment (39%) caters to monthly stays (30+ nights) in Montpellier, pointing to opportunities in the extended-stay market.
Recommendations
- Align with the market by considering a 30+ Nights minimum stay, as 39% of Montpellier hosts use this setting.
- If feasible, allowing 1-night stays, especially midweek or during low season, could capture last-minute bookings, as only 16.9% currently do.
- Explore offering discounts for stays of 30+ nights to attract the 39% of the market seeking extended stays.
- Adjust minimum nights based on seasonality – potentially shorter during low season and longer during peak demand periods in Montpellier.
Montpellier Airbnb Cancellation Policy Trends Analysis (2026)
Limited
45 listings
1.4% of total
Super Strict 30 Days
9 listings
0.3% of total
Flexible
815 listings
25.9% of total
Moderate
1177 listings
37.3% of total
Firm
868 listings
27.5% of total
Strict
238 listings
7.6% of total
Cancellation Policy Insights for Montpellier
- The prevailing Airbnb cancellation policy trend in Montpellier is Moderate, used by 37.3% of listings.
- There's a relatively balanced mix between guest-friendly (63.2%) and stricter (35.1%) policies, offering choices for different guest needs.
- Strict cancellation policies are quite rare (7.6%), potentially making listings with this policy less competitive unless justified by high demand or property type.
Recommendations for Hosts
- Consider adopting a Moderate policy to align with the 37.3% market standard in Montpellier.
- Using a Strict policy might deter some guests, as only 7.6% of listings use it. Evaluate if potential revenue protection outweighs possible lower booking rates.
- Regularly review your cancellation policy against competitors and market demand shifts in Montpellier.
Montpellier STR Booking Lead Time Analysis (2026)
Average Booking Lead Time by Month
Booking Lead Time Insights for Montpellier
- The overall average booking lead time for vacation rentals in Montpellier is 40 days.
- Guests book furthest in advance for stays during May (average 47 days), likely coinciding with peak travel demand or local events.
- The shortest booking windows occur for stays in February (average 26 days), indicating more last-minute travel plans during this time.
- Seasonally, Summer (44 days avg.) sees the longest lead times, while Winter (30 days avg.) has the shortest, reflecting typical travel planning cycles.
Recommendations for Hosts
- Use the overall average lead time (40 days) as a baseline for your pricing and availability strategy in Montpellier.
- Target marketing efforts for the Summer season well in advance (at least 44 days) to capture early planners.
- Monitor your own booking lead times against these Montpellier averages to identify opportunities for dynamic pricing adjustments.
Popular & Essential Airbnb Amenities in Montpellier (2026)
Amenity Prevalence
Amenity Insights for Montpellier
- Popular amenities like Kitchen, Wifi, Heating are common but not universal. Offering these can provide a competitive edge.
- Warning: Wifi is not universally provided but is considered essential globally. Ensure reliable Wifi is offered.
Recommendations for Hosts
- Consider adding popular differentiators like Kitchen or Wifi to increase appeal.
- Highlight unique or less common amenities you offer (e.g., hot tub, dedicated workspace, EV charger) in your listing description and photos.
- Regularly check competitor amenities in Montpellier to stay competitive.
Montpellier Airbnb Guest Demographics & Profile Analysis (2026)
Guest Profile Summary for Montpellier
- The typical guest profile for Airbnb in Montpellier consists of primarily domestic travelers (68%), often arriving from nearby Paris, typically belonging to the Post-2000s (Gen Z/Alpha) group (50%), primarily speaking French or English.
- Domestic travelers account for 67.6% of guests.
- Key international markets include France (67.6%) and United States (5.1%).
- Top languages spoken are French (35%) followed by English (35%).
- A significant demographic segment is the Post-2000s (Gen Z/Alpha) group, representing 50% of guests.
Recommendations for Hosts
- Target domestic marketing efforts towards travelers from Paris and Montpellier.
- Tailor amenities and listing descriptions to appeal to the dominant Post-2000s (Gen Z/Alpha) demographic (e.g., highlight fast WiFi, smart home features, local guides).
- Highlight unique local experiences or amenities relevant to the primary guest profile.
- Consider seasonal promotions aligned with peak travel times for key origin markets.
Nearby Short-Term Rental Market Comparison
How does the Montpellier Airbnb market stack up against its neighbors? Compare key performance metrics like average monthly revenue, ADR, and occupancy rates in surrounding areas to understand the broader regional STR landscape.
| Market | Active Properties | Monthly Revenue | Daily Rate | Avg. Occupancy |
|---|---|---|---|---|
| Cornellà del Terri | 15 | $6,458 | $584.61 | 40% |
| Amer | 11 | $4,949 | $462.57 | 38% |
| Vilanant | 12 | $4,526 | $404.10 | 36% |
| Porqueres | 13 | $4,304 | $512.14 | 31% |
| Sant Ferriol | 18 | $3,987 | $316.31 | 43% |
| Bàscara | 13 | $3,777 | $563.92 | 31% |
| Vilademuls | 21 | $3,518 | $352.52 | 38% |
| Cavillargues | 12 | $3,274 | $342.99 | 43% |
| Eygalières | 82 | $3,206 | $417.97 | 39% |
| les Llosses | 10 | $3,165 | $392.85 | 32% |