Marseillan Airbnb Market Analysis 2026: Short Term Rental Data & Vacation Rental Statistics in Occitania, France
Is Airbnb profitable in Marseillan in 2026? Explore comprehensive Airbnb analytics for Marseillan, Occitania, France to uncover income potential. This 2026 STR market report for Marseillan, based on AirROI data from February 2025 to January 2026, reveals key trends in the market of 540 active listings.
Whether you're considering an Airbnb investment in Marseillan, optimizing your existing vacation rental, or exploring rental arbitrage opportunities, understanding the Marseillan Airbnb data is crucial. Navigating the high regulation landscape is key to maximizing your short term rental income potential. Let's dive into the specifics.
Key Marseillan Airbnb Performance Metrics Overview
Monthly Airbnb Revenue Variations & Income Potential in Marseillan (2026)
Understanding the monthly revenue variations for Airbnb listings in Marseillan is key to maximizing your short term rental income potential. Seasonality significantly impacts earnings. Our analysis, based on data from the past 12 months, shows that the peak revenue month for STRs in Marseillan is typically August, while January often presents the lowest earnings, highlighting opportunities for strategic pricing adjustments during shoulder and low seasons. Explore the typical Airbnb income in Marseillan across different performance tiers:
- Best-in-class properties (Top 10%) achieve $2,883+ monthly, often utilizing dynamic pricing and superior guest experiences.
- Strong performing properties (Top 25%) earn $1,806 or more, indicating effective management and desirable locations/amenities.
- Typical properties (Median) generate around $1,061 per month, representing the average market performance.
- Entry-level properties (Bottom 25%) see earnings around $585, often with potential for optimization.
Average Monthly Airbnb Earnings Trend in Marseillan
Marseillan Airbnb Occupancy Rate Trends (2026)
Maximize your bookings by understanding the Marseillan STR occupancy trends. Seasonal demand shifts significantly influence how often properties are booked. Typically, Augustsees the highest demand (peak season occupancy), while January experiences the lowest (low season). Effective strategies, like adjusting minimum stays or offering promotions, can boost occupancy during slower periods. Here's how different property tiers perform in Marseillan:
- Best-in-class properties (Top 10%) achieve 71%+ occupancy, indicating high desirability and potentially optimized availability.
- Strong performing properties (Top 25%) maintain 51% or higher occupancy, suggesting good market fit and guest satisfaction.
- Typical properties (Median) have an occupancy rate around 32%.
- Entry-level properties (Bottom 25%) average 17% occupancy, potentially facing higher vacancy.
Average Monthly Occupancy Rate Trend in Marseillan
Average Daily Rate (ADR) Airbnb Trends in Marseillan (2026)
Effective short term rental pricing strategy in Marseillan involves understanding monthly ADR fluctuations. The Average Daily Rate (ADR) for Airbnb in Marseillan typically peaks in August and dips lowest during March. Leveraging Airbnb dynamic pricing tools or strategies based on this seasonality can significantly boost revenue. Here's a look at the typical nightly rates achieved:
- Best-in-class properties (Top 10%) command rates of $209+ per night, often due to premium features or locations.
- Strong performing properties (Top 25%) achieve nightly rates of $143 or more.
- Typical properties (Median) charge around $106 per night.
- Entry-level properties (Bottom 25%) earn around $83 per night.
Average Daily Rate (ADR) Trend by Month in Marseillan
Get Live Marseillan Market Intelligence 👇

Explore Real-time Analytics
Airbnb Seasonality Analysis & Trends in Marseillan (2026)
Peak Season (August, July, September)
- Revenue averages $2,534 per month
- Occupancy rates average 56.9%
- Daily rates average $140
Shoulder Season
- Revenue averages $1,171 per month
- Occupancy maintains around 31.9%
- Daily rates hold near $126
Low Season (January, February, November)
- Revenue drops to average $729 per month
- Occupancy decreases to average 23.3%
- Daily rates adjust to average $127
Seasonality Insights for Marseillan
- The Airbnb seasonality in Marseillan shows highly seasonal trends requiring careful strategy. While the sections above show seasonal averages, it's also insightful to look at the extremes:
- During the high season, the absolute peak month showcases Marseillan's highest earning potential, with monthly revenues capable of climbing to $3,109, occupancy reaching a high of 67.5%, and ADRs peaking at $143.
- Conversely, the slowest single month of the year, typically falling within the low season, marks the market's lowest point. In this month, revenue might dip to $590, occupancy could drop to 18.1%, and ADRs may adjust down to $116.
- Understanding both the seasonal averages and these monthly peaks and troughs in revenue, occupancy, and ADR is crucial for maximizing your Airbnb profit potential in Marseillan.
Seasonal Strategies for Maximizing Profit
- Peak Season: Maximize revenue through premium pricing and potentially longer minimum stays. Ensure high availability.
- Low Season: Offer competitive pricing, special promotions (e.g., extended stay discounts), and flexible cancellation policies. Target off-season travelers like remote workers or budget-conscious guests.
- Shoulder Seasons: Implement dynamic pricing that balances peak and low rates. Target weekend travelers or specific events. Offer slightly more flexible terms than peak season.
- Regularly analyze your own performance against these Marseillan seasonality benchmarks and adjust your pricing and availability strategy accordingly.
Best Areas for Airbnb Investment in Marseillan (2026)
Exploring the top neighborhoods for short-term rentals in Marseillan? This section highlights key areas, outlining why they are attractive for hosts and guests, along with notable local attractions. Consider these locations based on your target guest profile and investment strategy.
| Neighborhood / Area | Why Host Here? (Target Guests & Appeal) | Key Attractions & Landmarks |
|---|---|---|
| Port Marseillan | A charming area with a picturesque harbor and lots of waterfront dining options, making it an attractive spot for tourists looking to relax by the water. | Marseillan Beach, Etang de Thau, Fishing village charm, Water sports activities, Local seafood restaurants |
| Marseillan Village | This historic village offers traditional French architecture and a true taste of local culture, appealing to visitors interested in authentic experiences away from tourist traps. | Historic center, Local markets, Saint John the Baptist Church, Château de Marseillan |
| Etang de Thau | Famous for its oyster farming, this area provides a unique culinary experience and is popular among foodies and nature lovers. | Oyster farms, Bicycle trails, Scenic views, Bird watching, Water sports |
| Marseillan Beach | A family-friendly beach with easy access to the sea, ideal for summer tourists and those seeking sun and sand. | Sunny beach, Beach clubs, Watersports, Sunset views, Shops and cafes |
| Coteaux de Marseillan | Beautiful hilly outskirts perfect for wine lovers, offering vineyard tours and tasting experiences. | Vineyards, Wine tasting tours, Scenic views, Cycling paths, Nature trails |
| Languedoc Roussillon | The surrounding area is known for its stunning landscapes and excellent wine region, attracting tourists who enjoy outdoor activities and wine tourism. | Local vineyards, Wine festivals, Hiking, Scenic drives, Historic sites |
| Sète | Nearby, this coastal city is famous for its canals and seafood, making it a great complementary destination for Marseillan visitors. | Canal de Sète, Local seafood markets, Beaches, Cultural events, Arts scene |
| Agde | Another nearby town with a rich history and beautiful old town, of interest to tourists exploring the region. | Agde Cathedral, Historic old town, Black beach, Water attractions, Local cuisine |
Understanding Airbnb License Requirements & STR Laws in Marseillan (2026)
Yes, Marseillan, Occitania, France enforces high STR regulations. Obtaining a license and ensuring compliance is almost certainly required according to current 2026 STR laws. Always verify the latest short term rental regulations and Airbnb license requirements directly with local government authorities for Marseillan to ensure full compliance before hosting.
(Source: AirROI data, 2026, based on 81% licensed listings)
Top Performing Airbnb Properties in Marseillan (2026)
Benchmark your potential! Explore examples of top-performing Airbnb properties in Marseillanbased on Trailing Twelve Month (TTM) revenue. Analyze their characteristics, revenue, occupancy rate, and ADR to understand what drives success in this market.
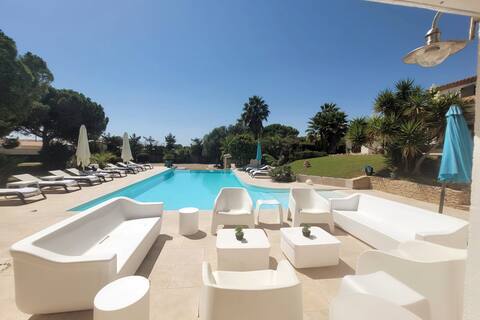
Outstanding cottage
Entire Place • 7 bedrooms
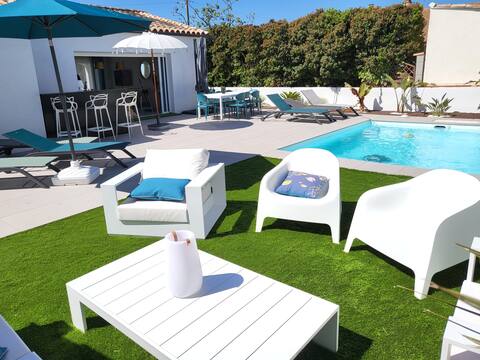
Villa Céladon. Pool, pondside
Entire Place • 5 bedrooms
Mediterranean Villa, Heated XXL Pool, Pets Allowed
Entire Place • 4 bedrooms
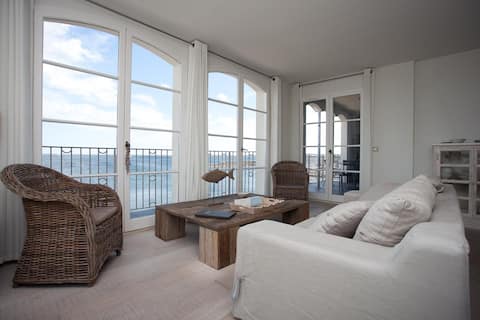
Marseillan, the view as far as the eye can see...
Entire Place • 2 bedrooms
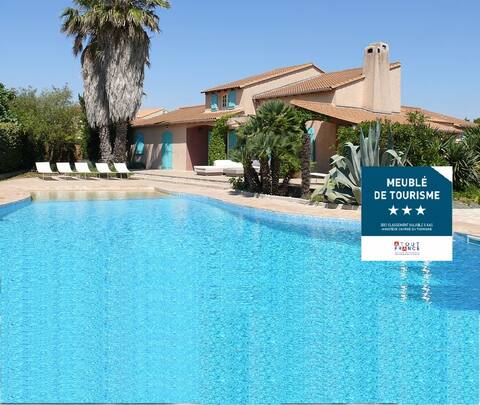
House-Heated pool 28°-Quiet-Near center
Entire Place • 3 bedrooms
La Scribote - Waterside Villa With Great Views
Entire Place • 5 bedrooms
Note: Performance varies based on location, size, amenities, seasonality, and management quality. Data reflects the past 12 months.
Top Performing Airbnb Hosts in Marseillan (2026)
Learn from the best! This table showcases top-performing Airbnb hosts in Marseillan based on the number of properties managed and estimated total revenue over the past year. Analyze their scale and performance metrics.
| Host Name | Properties | Grossing Revenue | Stay Reviews | Avg Rating |
|---|---|---|---|---|
| Manuel | 10 | $211,460 | 348 | 4.92/5.0 |
| Clémentine | 10 | $155,745 | 285 | 4.91/5.0 |
| Sylvie | 13 | $109,113 | 515 | 4.81/5.0 |
| Carine | 1 | $103,745 | 38 | 4.87/5.0 |
| Agus | 2 | $97,387 | 305 | 4.90/5.0 |
| France | 4 | $75,725 | 135 | 4.96/5.0 |
| Jérôme | 2 | $71,837 | 289 | 4.78/5.0 |
| Nick | 3 | $71,365 | 18 | 4.54/5.0 |
| Charlene | 7 | $70,487 | 18 | 4.70/5.0 |
| Carole | 1 | $70,355 | 6 | 5.00/5.0 |
Analyzing the strategies of top hosts, such as their property selection, pricing, and guest communication, can offer valuable lessons for optimizing your own Airbnb operations in Marseillan.
Dive Deeper: Advanced Marseillan STR Market Data (2026)
Ready to unlock more insights? AirROI provides access to advanced metrics and comprehensive Airbnb data for Marseillan. Explore detailed analytics beyond this report to refine your investment strategy, optimize pricing, and maximize your vacation rental profits.
Explore Advanced MetricsMarseillan Short-Term Rental Market Composition (2026): Property & Room Types
Room Type Distribution
Property Type Distribution
Market Composition Insights for Marseillan
- The Marseillan Airbnb market composition is heavily skewed towards Entire Home/Apt listings, which make up 95% of the 540 active rentals. This indicates strong guest preference for privacy and space.
- Looking at the property type distribution in Marseillan, Apartment/Condo properties are the most common (55.6%), reflecting the local real estate landscape.
- Houses represent a significant 39.8% portion, catering likely to families or larger groups.
- Smaller segments like hotel/boutique, others, outdoor/unique (combined 4.6%) offer potential for unique stay experiences.
Marseillan Airbnb Room Capacity Analysis (2026): Bedroom Distribution
Distribution of Listings by Number of Bedrooms
Room Capacity Insights for Marseillan
- The dominant room capacity in Marseillan is 2 bedrooms listings, making up 36.9% of the market. This suggests a strong demand for properties suitable for couples or solo travelers.
- Together, 2 bedrooms and 1 bedroom properties represent 68.4% of the active Airbnb listings in Marseillan, indicating a high concentration in these sizes.
Marseillan Vacation Rental Guest Capacity Trends (2026)
Distribution of Listings by Guest Capacity
Guest Capacity Insights for Marseillan
- The most common guest capacity trend in Marseillan vacation rentals is listings accommodating 4 guests (42%). This suggests the primary traveler segment is likely small families or groups.
- Properties designed for 4 guests and 6 guests dominate the Marseillan STR market, accounting for 60.7% of listings.
- 27.7% of properties accommodate 6+ guests, serving the market segment for larger families or group travel in Marseillan.
- On average, properties in Marseillan are equipped to host 4.4 guests.
Marseillan Airbnb Booking Patterns (2026): Available vs. Booked Days
Available Days Distribution
Booked Days Distribution
Booking Pattern Insights for Marseillan
- The most common availability pattern in Marseillan falls within the 271-366 days range, representing 62% of listings. This suggests many properties have significant open periods on their calendars.
- Approximately 92.0% of listings show high availability (181+ days open annually), indicating potential for increased bookings or specific owner usage patterns.
- For booked days, the 31-90 days range is most frequent in Marseillan (37.8%), reflecting common guest stay durations or potential owner blocking patterns.
- A notable 8.4% of properties secure long booking periods (181+ days booked per year), highlighting successful long-term rental strategies or significant owner usage.
Marseillan Airbnb Minimum Stay Requirements Analysis
Distribution of Listings by Minimum Night Requirement
1 Night
31 listings
5.7% of total
2 Nights
55 listings
10.2% of total
3 Nights
67 listings
12.4% of total
4-6 Nights
94 listings
17.4% of total
7-29 Nights
42 listings
7.8% of total
30+ Nights
251 listings
46.5% of total
Key Insights
- The most prevalent minimum stay requirement in Marseillan is 30+ Nights, adopted by 46.5% of listings. This highlights the market's preference for longer commitments.
- Very short stays (1-2 nights) are less common (15.9%), suggesting hosts prefer slightly longer bookings to optimize turnover.
- A significant segment (46.5%) caters to monthly stays (30+ nights) in Marseillan, pointing to opportunities in the extended-stay market.
Recommendations
- Align with the market by considering a 30+ Nights minimum stay, as 46.5% of Marseillan hosts use this setting.
- If feasible, allowing 1-night stays, especially midweek or during low season, could capture last-minute bookings, as only 5.7% currently do.
- Explore offering discounts for stays of 30+ nights to attract the 46.5% of the market seeking extended stays.
- Adjust minimum nights based on seasonality – potentially shorter during low season and longer during peak demand periods in Marseillan.
Marseillan Airbnb Cancellation Policy Trends Analysis (2026)
Super Strict 30 Days
1 listings
0.2% of total
Super Strict 60 Days
3 listings
0.6% of total
Limited
1 listings
0.2% of total
Flexible
97 listings
18.1% of total
Moderate
126 listings
23.5% of total
Firm
231 listings
43% of total
Strict
78 listings
14.5% of total
Cancellation Policy Insights for Marseillan
- The prevailing Airbnb cancellation policy trend in Marseillan is Firm, used by 43% of listings.
- A majority (57.5%) of hosts in Marseillan utilize Firm or Strict policies, indicating a market where hosts prioritize booking security.
Recommendations for Hosts
- Consider adopting a Firm policy to align with the 43% market standard in Marseillan.
- Using a Strict policy might deter some guests, as only 14.5% of listings use it. Evaluate if potential revenue protection outweighs possible lower booking rates.
- Regularly review your cancellation policy against competitors and market demand shifts in Marseillan.
Marseillan STR Booking Lead Time Analysis (2026)
Average Booking Lead Time by Month
Booking Lead Time Insights for Marseillan
- The overall average booking lead time for vacation rentals in Marseillan is 60 days.
- Guests book furthest in advance for stays during August (average 100 days), likely coinciding with peak travel demand or local events.
- The shortest booking windows occur for stays in January (average 30 days), indicating more last-minute travel plans during this time.
- Seasonally, Summer (80 days avg.) sees the longest lead times, while Winter (35 days avg.) has the shortest, reflecting typical travel planning cycles.
Recommendations for Hosts
- Use the overall average lead time (60 days) as a baseline for your pricing and availability strategy in Marseillan.
- For August stays, consider implementing length-of-stay discounts or slightly higher rates for bookings made less than 100 days out to capitalize on advance planning.
- Target marketing efforts for the Summer season well in advance (at least 80 days) to capture early planners.
- Monitor your own booking lead times against these Marseillan averages to identify opportunities for dynamic pricing adjustments.
Popular & Essential Airbnb Amenities in Marseillan (2026)
Amenity Prevalence
Amenity Insights for Marseillan
- Essential amenities in Marseillan that guests expect include: Kitchen. Lacking these (this) could significantly impact bookings.
- Popular amenities like TV, Hot water, Heating are common but not universal. Offering these can provide a competitive edge.
Recommendations for Hosts
- Ensure your listing includes all essential amenities for Marseillan: Kitchen.
- Prioritize adding missing essentials: Kitchen.
- Consider adding popular differentiators like TV or Hot water to increase appeal.
- Highlight unique or less common amenities you offer (e.g., hot tub, dedicated workspace, EV charger) in your listing description and photos.
- Regularly check competitor amenities in Marseillan to stay competitive.
Marseillan Airbnb Guest Demographics & Profile Analysis (2026)
Guest Profile Summary for Marseillan
- The typical guest profile for Airbnb in Marseillan consists of primarily domestic travelers (80%), often arriving from nearby Toulouse, typically belonging to the Post-2000s (Gen Z/Alpha) group (50%), primarily speaking French or English.
- Domestic travelers account for 79.6% of guests.
- Key international markets include France (79.6%) and Germany (5.2%).
- Top languages spoken are French (44.3%) followed by English (30.3%).
- A significant demographic segment is the Post-2000s (Gen Z/Alpha) group, representing 50% of guests.
Recommendations for Hosts
- Target domestic marketing efforts towards travelers from Toulouse and Lyon.
- Tailor amenities and listing descriptions to appeal to the dominant Post-2000s (Gen Z/Alpha) demographic (e.g., highlight fast WiFi, smart home features, local guides).
- Highlight unique local experiences or amenities relevant to the primary guest profile.
- Consider seasonal promotions aligned with peak travel times for key origin markets.
Nearby Short-Term Rental Market Comparison
How does the Marseillan Airbnb market stack up against its neighbors? Compare key performance metrics like average monthly revenue, ADR, and occupancy rates in surrounding areas to understand the broader regional STR landscape.
| Market | Active Properties | Monthly Revenue | Daily Rate | Avg. Occupancy |
|---|---|---|---|---|
| Cornellà del Terri | 15 | $6,458 | $584.61 | 40% |
| Amer | 11 | $4,949 | $462.57 | 38% |
| Vilanant | 12 | $4,526 | $404.10 | 36% |
| Porqueres | 13 | $4,304 | $512.14 | 31% |
| Sant Ferriol | 18 | $3,987 | $316.31 | 43% |
| Bàscara | 13 | $3,777 | $563.92 | 31% |
| Vilademuls | 21 | $3,518 | $352.52 | 38% |
| Cavillargues | 12 | $3,274 | $342.99 | 43% |
| Eygalières | 82 | $3,206 | $417.97 | 39% |
| les Llosses | 10 | $3,165 | $392.85 | 32% |