Lattes Airbnb Market Analysis 2026: Short Term Rental Data & Vacation Rental Statistics in Occitania, France
Is Airbnb profitable in Lattes in 2026? Explore comprehensive Airbnb analytics for Lattes, Occitania, France to uncover income potential. This 2026 STR market report for Lattes, based on AirROI data from February 2025 to January 2026, reveals key trends in the market of 232 active listings.
Whether you're considering an Airbnb investment in Lattes, optimizing your existing vacation rental, or exploring rental arbitrage opportunities, understanding the Lattes Airbnb data is crucial. Navigating the high regulation landscape is key to maximizing your short term rental income potential. Let's dive into the specifics.
Key Lattes Airbnb Performance Metrics Overview
Monthly Airbnb Revenue Variations & Income Potential in Lattes (2026)
Understanding the monthly revenue variations for Airbnb listings in Lattes is key to maximizing your short term rental income potential. Seasonality significantly impacts earnings. Our analysis, based on data from the past 12 months, shows that the peak revenue month for STRs in Lattes is typically August, while January often presents the lowest earnings, highlighting opportunities for strategic pricing adjustments during shoulder and low seasons. Explore the typical Airbnb income in Lattes across different performance tiers:
- Best-in-class properties (Top 10%) achieve $3,597+ monthly, often utilizing dynamic pricing and superior guest experiences.
- Strong performing properties (Top 25%) earn $2,200 or more, indicating effective management and desirable locations/amenities.
- Typical properties (Median) generate around $1,321 per month, representing the average market performance.
- Entry-level properties (Bottom 25%) see earnings around $642, often with potential for optimization.
Average Monthly Airbnb Earnings Trend in Lattes
Lattes Airbnb Occupancy Rate Trends (2026)
Maximize your bookings by understanding the Lattes STR occupancy trends. Seasonal demand shifts significantly influence how often properties are booked. Typically, Augustsees the highest demand (peak season occupancy), while January experiences the lowest (low season). Effective strategies, like adjusting minimum stays or offering promotions, can boost occupancy during slower periods. Here's how different property tiers perform in Lattes:
- Best-in-class properties (Top 10%) achieve 77%+ occupancy, indicating high desirability and potentially optimized availability.
- Strong performing properties (Top 25%) maintain 61% or higher occupancy, suggesting good market fit and guest satisfaction.
- Typical properties (Median) have an occupancy rate around 39%.
- Entry-level properties (Bottom 25%) average 21% occupancy, potentially facing higher vacancy.
Average Monthly Occupancy Rate Trend in Lattes
Average Daily Rate (ADR) Airbnb Trends in Lattes (2026)
Effective short term rental pricing strategy in Lattes involves understanding monthly ADR fluctuations. The Average Daily Rate (ADR) for Airbnb in Lattes typically peaks in August and dips lowest during February. Leveraging Airbnb dynamic pricing tools or strategies based on this seasonality can significantly boost revenue. Here's a look at the typical nightly rates achieved:
- Best-in-class properties (Top 10%) command rates of $329+ per night, often due to premium features or locations.
- Strong performing properties (Top 25%) achieve nightly rates of $181 or more.
- Typical properties (Median) charge around $111 per night.
- Entry-level properties (Bottom 25%) earn around $81 per night.
Average Daily Rate (ADR) Trend by Month in Lattes
Get Live Lattes Market Intelligence 👇

Explore Real-time Analytics
Airbnb Seasonality Analysis & Trends in Lattes (2026)
Peak Season (August, July, June)
- Revenue averages $2,854 per month
- Occupancy rates average 53.4%
- Daily rates average $165
Shoulder Season
- Revenue averages $1,492 per month
- Occupancy maintains around 38.1%
- Daily rates hold near $159
Low Season (January, February, April)
- Revenue drops to average $1,148 per month
- Occupancy decreases to average 36.0%
- Daily rates adjust to average $154
Seasonality Insights for Lattes
- The Airbnb seasonality in Lattes shows highly seasonal trends requiring careful strategy. While the sections above show seasonal averages, it's also insightful to look at the extremes:
- During the high season, the absolute peak month showcases Lattes's highest earning potential, with monthly revenues capable of climbing to $3,559, occupancy reaching a high of 64.7%, and ADRs peaking at $168.
- Conversely, the slowest single month of the year, typically falling within the low season, marks the market's lowest point. In this month, revenue might dip to $1,005, occupancy could drop to 27.0%, and ADRs may adjust down to $149.
- Understanding both the seasonal averages and these monthly peaks and troughs in revenue, occupancy, and ADR is crucial for maximizing your Airbnb profit potential in Lattes.
Seasonal Strategies for Maximizing Profit
- Peak Season: Maximize revenue through premium pricing and potentially longer minimum stays. Ensure high availability.
- Low Season: Offer competitive pricing, special promotions (e.g., extended stay discounts), and flexible cancellation policies. Target off-season travelers like remote workers or budget-conscious guests.
- Shoulder Seasons: Implement dynamic pricing that balances peak and low rates. Target weekend travelers or specific events. Offer slightly more flexible terms than peak season.
- Regularly analyze your own performance against these Lattes seasonality benchmarks and adjust your pricing and availability strategy accordingly.
Best Areas for Airbnb Investment in Lattes (2026)
Exploring the top neighborhoods for short-term rentals in Lattes? This section highlights key areas, outlining why they are attractive for hosts and guests, along with notable local attractions. Consider these locations based on your target guest profile and investment strategy.
| Neighborhood / Area | Why Host Here? (Target Guests & Appeal) | Key Attractions & Landmarks |
|---|---|---|
| Lattes Sud | A vibrant neighborhood close to the coast, offering a mix of residential and tourist attractions. Ideal for visitors looking for seaside relaxation and outdoor activities. | Mediterranean beaches, Local seafood restaurants, Beachfront promenade, Water sports facilities, Nature trails |
| Lattes Centre | The historical center of Lattes features charming streets, local shops, and cafés. It's attractive for those who enjoy local culture and access to urban amenities. | Historic church of Saint-Pierre, Local markets, Art galleries, Cafés and restaurants, Cultural festivals |
| Port Ariane | A modern, purpose-built area that attracts a mix of residents and tourists, known for its marina. Suitable for water sports and scenic views. | Marina of Port Ariane, Walking paths by the water, Nearby nature reserves, Boat rentals, Restaurants with waterfront views |
| Lattes East | This area is known for its residential feel but close to parks and nature, good for families and those looking for a peaceful stay. | Parc de la Prairie, Cycling and walking paths, Playgrounds, Picnic areas, Community events |
| Lattes West | Close to the city of Montpellier, this area offers easy access to urban attractions while providing a quieter residential environment. | Parc des Expositions, Cultural exhibitions, Shopping areas, Public transport access to Montpellier, Local dining spots |
| Lattes Nature Reserve | A haven for nature lovers, this area attracts visitors looking to explore natural beauty, wildlife, and eco-friendly activities. | Étang de l'Or, Wildlife observing, Bird watching, Hiking trails, Nature education center |
| Lattes Vendargues | This area offers a more rural experience, perfect for those seeking tranquility and local French village charm. | Local village markets, Traditional French architecture, Nearby vineyards, Cultural heritage sites, Rural walking paths |
| Lattes Aqueduct | Famous for its historic aqueduct, this area is attractive for history enthusiasts and those looking for scenic views and walks. | Historic aqueduct, Picnic areas near the water, Walking trails, Educational tours, Photoshoot spots |
Understanding Airbnb License Requirements & STR Laws in Lattes (2026)
Yes, Lattes, Occitania, France enforces high STR regulations. Obtaining a license and ensuring compliance is almost certainly required according to current 2026 STR laws. Always verify the latest short term rental regulations and Airbnb license requirements directly with local government authorities for Lattes to ensure full compliance before hosting.
(Source: AirROI data, 2026, based on 78% licensed listings)
Top Performing Airbnb Properties in Lattes (2026)
Benchmark your potential! Explore examples of top-performing Airbnb properties in Lattesbased on Trailing Twelve Month (TTM) revenue. Analyze their characteristics, revenue, occupancy rate, and ADR to understand what drives success in this market.
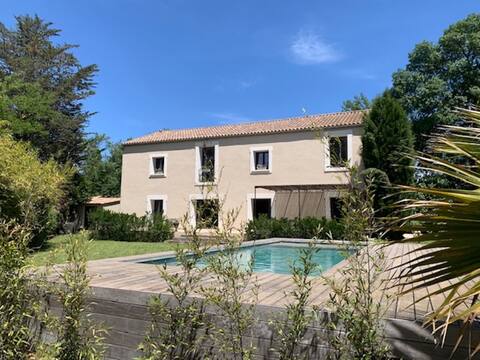
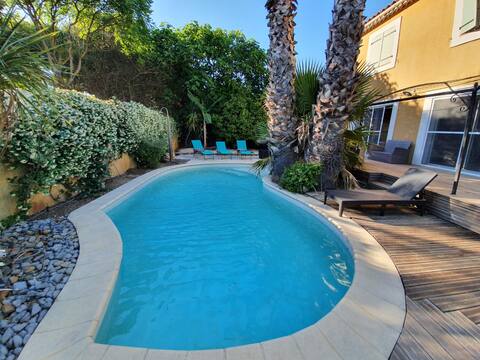
Luxury mas with swimming pool 5 min from beaches
Entire Place • 5 bedrooms

★ Domaine de Gramenet ★ Between Sea and City)
Entire Place • 4 bedrooms

068 - Villa Azul 4 bedrooms, Pool, Air conditioning
Entire Place • 4 bedrooms

Beautiful Villa with Pool at the Foot of the Tramway
Entire Place • 3 bedrooms

Peaceful oasis between Montpellier and the beaches!
Entire Place • 3 bedrooms
Belle villa 12pers 10mn plages clim+piscine+wifi
Entire Place • 6 bedrooms
Note: Performance varies based on location, size, amenities, seasonality, and management quality. Data reflects the past 12 months.
Top Performing Airbnb Hosts in Lattes (2026)
Learn from the best! This table showcases top-performing Airbnb hosts in Lattes based on the number of properties managed and estimated total revenue over the past year. Analyze their scale and performance metrics.
| Host Name | Properties | Grossing Revenue | Stay Reviews | Avg Rating |
|---|---|---|---|---|
| Sophie | 2 | $111,369 | 136 | 4.93/5.0 |
| Rodolphe | 1 | $96,703 | 17 | 4.94/5.0 |
| Florian | 1 | $90,512 | 40 | 4.95/5.0 |
| Appart'Hôtel Evasion | 4 | $84,445 | 1019 | 4.87/5.0 |
| Conciergerie BNB Boost | 1 | $71,422 | 66 | 4.80/5.0 |
| Maurice | 1 | $52,142 | 71 | 4.96/5.0 |
| SAS Gené Mousset | 2 | $49,125 | 306 | 4.83/5.0 |
| Patricia | 4 | $48,669 | 52 | 4.49/5.0 |
| Celine | 1 | $46,744 | 16 | 4.94/5.0 |
| Vanessa | 1 | $46,342 | 21 | 4.24/5.0 |
Analyzing the strategies of top hosts, such as their property selection, pricing, and guest communication, can offer valuable lessons for optimizing your own Airbnb operations in Lattes.
Dive Deeper: Advanced Lattes STR Market Data (2026)
Ready to unlock more insights? AirROI provides access to advanced metrics and comprehensive Airbnb data for Lattes. Explore detailed analytics beyond this report to refine your investment strategy, optimize pricing, and maximize your vacation rental profits.
Explore Advanced MetricsLattes Short-Term Rental Market Composition (2026): Property & Room Types
Room Type Distribution
Property Type Distribution
Market Composition Insights for Lattes
- The Lattes Airbnb market composition is heavily skewed towards Entire Home/Apt listings, which make up 86.6% of the 232 active rentals. This indicates strong guest preference for privacy and space.
- Looking at the property type distribution in Lattes, House properties are the most common (51.7%), reflecting the local real estate landscape.
- Houses represent a significant 51.7% portion, catering likely to families or larger groups.
- Smaller segments like hotel/boutique, outdoor/unique, others (combined 7.3%) offer potential for unique stay experiences.
Lattes Airbnb Room Capacity Analysis (2026): Bedroom Distribution
Distribution of Listings by Number of Bedrooms
Room Capacity Insights for Lattes
- The dominant room capacity in Lattes is 3 bedrooms listings, making up 28.4% of the market. This suggests a strong demand for properties suitable for families or small groups.
- Together, 3 bedrooms and 1 bedroom properties represent 54.7% of the active Airbnb listings in Lattes, indicating a high concentration in these sizes.
- A significant 37.0% of listings offer 3+ bedrooms, catering to larger groups and families seeking more space in Lattes.
Lattes Vacation Rental Guest Capacity Trends (2026)
Distribution of Listings by Guest Capacity
Guest Capacity Insights for Lattes
- The most common guest capacity trend in Lattes vacation rentals is listings accommodating 6 guests (21.1%). This suggests the primary traveler segment is likely larger groups.
- Properties designed for 6 guests and 4 guests dominate the Lattes STR market, accounting for 41.8% of listings.
- 40.9% of properties accommodate 6+ guests, serving the market segment for larger families or group travel in Lattes.
- On average, properties in Lattes are equipped to host 4.4 guests.
Lattes Airbnb Booking Patterns (2026): Available vs. Booked Days
Available Days Distribution
Booked Days Distribution
Booking Pattern Insights for Lattes
- The most common availability pattern in Lattes falls within the 271-366 days range, representing 54.3% of listings. This suggests many properties have significant open periods on their calendars.
- Approximately 87.1% of listings show high availability (181+ days open annually), indicating potential for increased bookings or specific owner usage patterns.
- For booked days, the 91-180 days range is most frequent in Lattes (33.6%), reflecting common guest stay durations or potential owner blocking patterns.
- A notable 13.8% of properties secure long booking periods (181+ days booked per year), highlighting successful long-term rental strategies or significant owner usage.
Lattes Airbnb Minimum Stay Requirements Analysis
Distribution of Listings by Minimum Night Requirement
1 Night
25 listings
10.8% of total
2 Nights
39 listings
16.8% of total
3 Nights
23 listings
9.9% of total
4-6 Nights
44 listings
19% of total
7-29 Nights
12 listings
5.2% of total
30+ Nights
89 listings
38.4% of total
Key Insights
- The most prevalent minimum stay requirement in Lattes is 30+ Nights, adopted by 38.4% of listings. This highlights the market's preference for longer commitments.
- A significant segment (38.4%) caters to monthly stays (30+ nights) in Lattes, pointing to opportunities in the extended-stay market.
Recommendations
- Align with the market by considering a 30+ Nights minimum stay, as 38.4% of Lattes hosts use this setting.
- If feasible, allowing 1-night stays, especially midweek or during low season, could capture last-minute bookings, as only 10.8% currently do.
- Explore offering discounts for stays of 30+ nights to attract the 38.4% of the market seeking extended stays.
- Adjust minimum nights based on seasonality – potentially shorter during low season and longer during peak demand periods in Lattes.
Lattes Airbnb Cancellation Policy Trends Analysis (2026)
Limited
5 listings
2.2% of total
Flexible
70 listings
30.3% of total
Moderate
55 listings
23.8% of total
Firm
76 listings
32.9% of total
Strict
25 listings
10.8% of total
Cancellation Policy Insights for Lattes
- The prevailing Airbnb cancellation policy trend in Lattes is Firm, used by 32.9% of listings.
- There's a relatively balanced mix between guest-friendly (54.1%) and stricter (43.7%) policies, offering choices for different guest needs.
Recommendations for Hosts
- Consider adopting a Firm policy to align with the 32.9% market standard in Lattes.
- Using a Strict policy might deter some guests, as only 10.8% of listings use it. Evaluate if potential revenue protection outweighs possible lower booking rates.
- Regularly review your cancellation policy against competitors and market demand shifts in Lattes.
Lattes STR Booking Lead Time Analysis (2026)
Average Booking Lead Time by Month
Booking Lead Time Insights for Lattes
- The overall average booking lead time for vacation rentals in Lattes is 44 days.
- Guests book furthest in advance for stays during August (average 60 days), likely coinciding with peak travel demand or local events.
- The shortest booking windows occur for stays in November (average 31 days), indicating more last-minute travel plans during this time.
- Seasonally, Summer (55 days avg.) sees the longest lead times, while Winter (36 days avg.) has the shortest, reflecting typical travel planning cycles.
Recommendations for Hosts
- Use the overall average lead time (44 days) as a baseline for your pricing and availability strategy in Lattes.
- For August stays, consider implementing length-of-stay discounts or slightly higher rates for bookings made less than 60 days out to capitalize on advance planning.
- Target marketing efforts for the Summer season well in advance (at least 55 days) to capture early planners.
- Monitor your own booking lead times against these Lattes averages to identify opportunities for dynamic pricing adjustments.
Popular & Essential Airbnb Amenities in Lattes (2026)
Amenity Prevalence
Amenity Insights for Lattes
- Popular amenities like Kitchen, Free parking on premises, Smoke alarm are common but not universal. Offering these can provide a competitive edge.
Recommendations for Hosts
- Consider adding popular differentiators like Kitchen or Free parking on premises to increase appeal.
- Highlight unique or less common amenities you offer (e.g., hot tub, dedicated workspace, EV charger) in your listing description and photos.
- Regularly check competitor amenities in Lattes to stay competitive.
Lattes Airbnb Guest Demographics & Profile Analysis (2026)
Guest Profile Summary for Lattes
- The typical guest profile for Airbnb in Lattes consists of primarily domestic travelers (84%), often arriving from nearby Paris, typically belonging to the Post-2000s (Gen Z/Alpha) group (50%), primarily speaking French or English.
- Domestic travelers account for 84.1% of guests.
- Key international markets include France (84.1%) and Germany (2.1%).
- Top languages spoken are French (43.7%) followed by English (31.8%).
- A significant demographic segment is the Post-2000s (Gen Z/Alpha) group, representing 50% of guests.
Recommendations for Hosts
- Target domestic marketing efforts towards travelers from Paris and Lyon.
- Tailor amenities and listing descriptions to appeal to the dominant Post-2000s (Gen Z/Alpha) demographic (e.g., highlight fast WiFi, smart home features, local guides).
- Highlight unique local experiences or amenities relevant to the primary guest profile.
- Consider seasonal promotions aligned with peak travel times for key origin markets.
Nearby Short-Term Rental Market Comparison
How does the Lattes Airbnb market stack up against its neighbors? Compare key performance metrics like average monthly revenue, ADR, and occupancy rates in surrounding areas to understand the broader regional STR landscape.
| Market | Active Properties | Monthly Revenue | Daily Rate | Avg. Occupancy |
|---|---|---|---|---|
| Cornellà del Terri | 15 | $6,458 | $584.61 | 40% |
| Amer | 11 | $4,949 | $462.57 | 38% |
| Vilanant | 12 | $4,526 | $404.10 | 36% |
| Porqueres | 13 | $4,304 | $512.14 | 31% |
| Sant Ferriol | 18 | $3,987 | $316.31 | 43% |
| Bàscara | 13 | $3,777 | $563.92 | 31% |
| Vilademuls | 21 | $3,518 | $352.52 | 38% |
| Cavillargues | 12 | $3,274 | $342.99 | 43% |
| Eygalières | 82 | $3,206 | $417.97 | 39% |
| les Llosses | 10 | $3,165 | $392.85 | 32% |