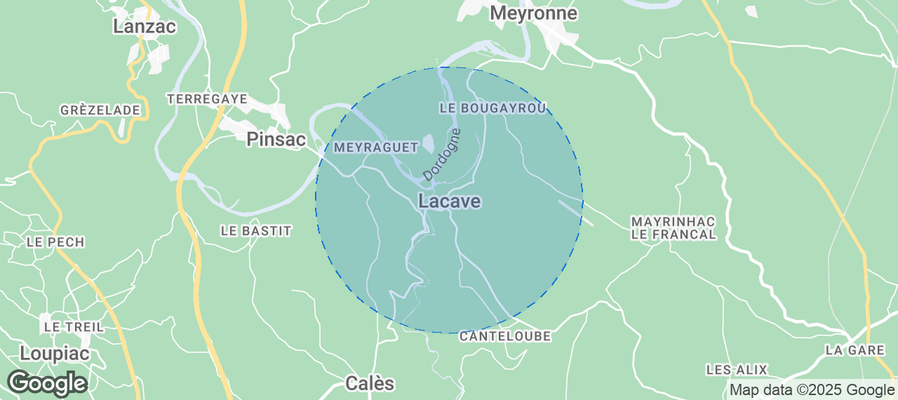
Lacave Airbnb Market Analysis 2025: Short Term Rental Data & Vacation Rental Statistics in Occitania, France
Is Airbnb profitable in Lacave in 2025? Explore comprehensive Airbnb analytics for Lacave, Occitania, France to uncover income potential. This 2025 STR market report for Lacave, based on AirROI data from November 2024 to October 2025, reveals key trends in the niche market of 17 active listings.
Whether you're considering an Airbnb investment in Lacave, optimizing your existing vacation rental, or exploring rental arbitrage opportunities, understanding the Lacave Airbnb data is crucial. Understanding the local regulations is key to maximizing your short term rental income potential. Let's dive into the specifics.
Key Lacave Airbnb Performance Metrics Overview
Monthly Airbnb Revenue Variations & Income Potential in Lacave (2025)
Understanding the monthly revenue variations for Airbnb listings in Lacave is key to maximizing your short term rental income potential. Seasonality significantly impacts earnings. Our analysis, based on data from the past 12 months, shows that the peak revenue month for STRs in Lacave is typically August, while March often presents the lowest earnings, highlighting opportunities for strategic pricing adjustments during shoulder and low seasons. Explore the typical Airbnb income in Lacave across different performance tiers:
- Best-in-class properties (Top 10%) achieve $2,368+ monthly, often utilizing dynamic pricing and superior guest experiences.
- Strong performing properties (Top 25%) earn $1,925 or more, indicating effective management and desirable locations/amenities.
- Typical properties (Median) generate around $1,186 per month, representing the average market performance.
- Entry-level properties (Bottom 25%) see earnings around $783, often with potential for optimization.
Average Monthly Airbnb Earnings Trend in Lacave
Lacave Airbnb Occupancy Rate Trends (2025)
Maximize your bookings by understanding the Lacave STR occupancy trends. Seasonal demand shifts significantly influence how often properties are booked. Typically, Augustsees the highest demand (peak season occupancy), while March experiences the lowest (low season). Effective strategies, like adjusting minimum stays or offering promotions, can boost occupancy during slower periods. Here's how different property tiers perform in Lacave:
- Best-in-class properties (Top 10%) achieve 63%+ occupancy, indicating high desirability and potentially optimized availability.
- Strong performing properties (Top 25%) maintain 51% or higher occupancy, suggesting good market fit and guest satisfaction.
- Typical properties (Median) have an occupancy rate around 31%.
- Entry-level properties (Bottom 25%) average 19% occupancy, potentially facing higher vacancy.
Average Monthly Occupancy Rate Trend in Lacave
Average Daily Rate (ADR) Airbnb Trends in Lacave (2025)
Effective short term rental pricing strategy in Lacave involves understanding monthly ADR fluctuations. The Average Daily Rate (ADR) for Airbnb in Lacave typically peaks in August and dips lowest during October. Leveraging Airbnb dynamic pricing tools or strategies based on this seasonality can significantly boost revenue. Here's a look at the typical nightly rates achieved:
- Best-in-class properties (Top 10%) command rates of $399+ per night, often due to premium features or locations.
- Strong performing properties (Top 25%) achieve nightly rates of $200 or more.
- Typical properties (Median) charge around $120 per night.
- Entry-level properties (Bottom 25%) earn around $95 per night.
Average Daily Rate (ADR) Trend by Month in Lacave
Get Live Lacave Market Intelligence 👇
Explore Real-time Analytics
Airbnb Seasonality Analysis & Trends in Lacave (2025)
Peak Season (August, July, September)
- Revenue averages $2,234 per month
- Occupancy rates average 52.0%
- Daily rates average $199
Shoulder Season
- Revenue averages $1,287 per month
- Occupancy maintains around 35.7%
- Daily rates hold near $194
Low Season (January, February, March)
- Revenue drops to average $546 per month
- Occupancy decreases to average 16.3%
- Daily rates adjust to average $195
Seasonality Insights for Lacave
- The Airbnb seasonality in Lacave shows highly seasonal trends requiring careful strategy. While the sections above show seasonal averages, it's also insightful to look at the extremes:
- During the high season, the absolute peak month showcases Lacave's highest earning potential, with monthly revenues capable of climbing to $2,881, occupancy reaching a high of 66.4%, and ADRs peaking at $203.
- Conversely, the slowest single month of the year, typically falling within the low season, marks the market's lowest point. In this month, revenue might dip to $319, occupancy could drop to 11.0%, and ADRs may adjust down to $189.
- Understanding both the seasonal averages and these monthly peaks and troughs in revenue, occupancy, and ADR is crucial for maximizing your Airbnb profit potential in Lacave.
Seasonal Strategies for Maximizing Profit
- Peak Season: Maximize revenue through premium pricing and potentially longer minimum stays. Ensure high availability.
- Low Season: Offer competitive pricing, special promotions (e.g., extended stay discounts), and flexible cancellation policies. Target off-season travelers like remote workers or budget-conscious guests.
- Shoulder Seasons: Implement dynamic pricing that balances peak and low rates. Target weekend travelers or specific events. Offer slightly more flexible terms than peak season.
- Regularly analyze your own performance against these Lacave seasonality benchmarks and adjust your pricing and availability strategy accordingly.
Best Areas for Airbnb Investment in Lacave (2025)
Exploring the top neighborhoods for short-term rentals in Lacave? This section highlights key areas, outlining why they are attractive for hosts and guests, along with notable local attractions. Consider these locations based on your target guest profile and investment strategy.
| Neighborhood / Area | Why Host Here? (Target Guests & Appeal) | Key Attractions & Landmarks |
|---|---|---|
| Lacave Village | Charming French village with picturesque views and traditional architecture. Ideal for guests looking for a peaceful countryside experience close to nature. | The Cevennes National Park, Lacave Caves, Village Markets, Historical Sites, Local Vineyards |
| Rocamadour | Famous pilgrimage town perched on a cliff, known for its stunning views and historical significance. Attracts religious visitors and tourists alike. | The Sanctuary of Rocamadour, Château de Rocamadour, Monkey Forest, Rocher des Aigles, The Great Site of Rocamadour |
| Sarlat-la-Canéda | Medieval town with beautiful architecture and a vibrant market scene. Popular among tourists seeking culture and history. | Sarlat Market, Cathedral of Saint-Sacerdos, Place de la Liberté, Jardins d'Eyrignac, Historic Streets |
| Dordogne River | Scenic river area great for outdoor activities such as canoeing and hiking. Attracts adventure-seekers and nature lovers. | Canoeing on the Dordogne, Beynac Castle, La Roque-Gageac, Limeuil Village, Castelnaud-la-Chapelle |
| Gouffre de Padirac | Impressive underground river and cave system, attracting tourists interested in geology and natural wonders. | Underground River Tours, Cave Explorations, Mystical Formations, Visitor Center, Geological Exhibits |
| Martel | Historic town known for its medieval architecture and proximity to key tourist attractions in the Lot department. | Martel's Train, Place des Consuls, Historical Tours, Caves of the Lot Valley, Local Festivals |
| Saint-Céré | Quaint town with a rich history, offering cultural events and festivals throughout the year. | Saint-Céré Theater, Historic Sites, Local Markets, Art Galleries, Natural Parks |
| The Causse de Gramat | A unique limestone plateau offering breathtaking landscapes and rich biodiversity, perfect for nature-oriented accommodations. | Hiking Trails, Flora and Fauna, Scenic Views, Natural Reserves, Traditional Farms |
Understanding Airbnb License Requirements & STR Laws in Lacave (2025)
With 12% of listings showing registration in 2025, understanding potential Airbnb license requirements is crucial in Lacave. Always verify the latest short term rental regulations and Airbnb license requirements directly with local government authorities for Lacave to ensure full compliance before hosting.
(Source: AirROI data, 2025, based on 12% licensed listings)
Top Performing Airbnb Properties in Lacave (2025)
Benchmark your potential! Explore examples of top-performing Airbnb properties in Lacavebased on Trailing Twelve Month (TTM) revenue. Analyze their characteristics, revenue, occupancy rate, and ADR to understand what drives success in this market.

Country home with exceptional panoramic views.
Entire Place • 3 bedrooms

Grand gîte 6/14 couchages
Entire Place • 5 bedrooms

"Les clés des champs" vacation rental
Entire Place • 2 bedrooms
Hosted by Guy
Entire Place • 1 bedroom

"La vallée de l'Ouysse" Gite
Entire Place • 2 bedrooms

"La Maison de JuJu Cottage"
Entire Place • 3 bedrooms
Note: Performance varies based on location, size, amenities, seasonality, and management quality. Data reflects the past 12 months.
Top Performing Airbnb Hosts in Lacave (2025)
Learn from the best! This table showcases top-performing Airbnb hosts in Lacave based on the number of properties managed and estimated total revenue over the past year. Analyze their scale and performance metrics.
| Host Name | Properties | Grossing Revenue | Stay Reviews | Avg Rating |
|---|---|---|---|---|
| Celine | 2 | $32,035 | 3 | Not Rated |
| Maud | 2 | $29,308 | 108 | 4.91/5.0 |
| Serge | 1 | $19,606 | 84 | 4.88/5.0 |
| Guy | 1 | $14,617 | 158 | 4.76/5.0 |
| Jacques | 1 | $12,841 | 111 | 4.85/5.0 |
| Cathy | 1 | $10,707 | 506 | 4.87/5.0 |
| LodgingFrance | 3 | $9,538 | 271 | 4.58/5.0 |
| Céline | 1 | $8,684 | 79 | 4.58/5.0 |
| Jean-Jacques | 1 | $5,307 | 2 | Not Rated |
| Fi | 1 | $4,296 | 15 | 4.93/5.0 |
Analyzing the strategies of top hosts, such as their property selection, pricing, and guest communication, can offer valuable lessons for optimizing your own Airbnb operations in Lacave.
Dive Deeper: Advanced Lacave STR Market Data (2025)
Ready to unlock more insights? AirROI provides access to advanced metrics and comprehensive Airbnb data for Lacave. Explore detailed analytics beyond this report to refine your investment strategy, optimize pricing, and maximize your vacation rental profits.
Explore Advanced MetricsLacave Short-Term Rental Market Composition (2025): Property & Room Types
Room Type Distribution
Property Type Distribution
Market Composition Insights for Lacave
- The Lacave Airbnb market composition is heavily skewed towards Entire Home/Apt listings, which make up 70.6% of the 17 active rentals. This indicates strong guest preference for privacy and space.
- Looking at the property type distribution in Lacave, House properties are the most common (70.6%), reflecting the local real estate landscape.
- Houses represent a significant 70.6% portion, catering likely to families or larger groups.
- The presence of 5.9% Hotel/Boutique listings indicates integration with traditional hospitality.
Lacave Airbnb Room Capacity Analysis (2025): Bedroom Distribution
Distribution of Listings by Number of Bedrooms
Room Capacity Insights for Lacave
- The dominant room capacity in Lacave is 1 bedroom listings, making up 35.3% of the market. This suggests a strong demand for properties suitable for couples or solo travelers.
- Together, 1 bedroom and 3 bedrooms properties represent 64.7% of the active Airbnb listings in Lacave, indicating a high concentration in these sizes.
- A significant 41.2% of listings offer 3+ bedrooms, catering to larger groups and families seeking more space in Lacave.
Lacave Vacation Rental Guest Capacity Trends (2025)
Distribution of Listings by Guest Capacity
Guest Capacity Insights for Lacave
- The most common guest capacity trend in Lacave vacation rentals is listings accommodating 6 guests (23.5%). This suggests the primary traveler segment is likely larger groups.
- Properties designed for 6 guests and 5 guests dominate the Lacave STR market, accounting for 41.1% of listings.
- 35.3% of properties accommodate 6+ guests, serving the market segment for larger families or group travel in Lacave.
- On average, properties in Lacave are equipped to host 4.5 guests.
Lacave Airbnb Booking Patterns (2025): Available vs. Booked Days
Available Days Distribution
Booked Days Distribution
Booking Pattern Insights for Lacave
- The most common availability pattern in Lacave falls within the 271-366 days range, representing 64.7% of listings. This suggests many properties have significant open periods on their calendars.
- Approximately 94.1% of listings show high availability (181+ days open annually), indicating potential for increased bookings or specific owner usage patterns.
- For booked days, the 1-30 days range is most frequent in Lacave (41.2%), reflecting common guest stay durations or potential owner blocking patterns.
- A notable 5.9% of properties secure long booking periods (181+ days booked per year), highlighting successful long-term rental strategies or significant owner usage.
Lacave Airbnb Minimum Stay Requirements Analysis
Distribution of Listings by Minimum Night Requirement
1 Night
6 listings
35.3% of total
2 Nights
3 listings
17.6% of total
3 Nights
2 listings
11.8% of total
4-6 Nights
3 listings
17.6% of total
30+ Nights
3 listings
17.6% of total
Key Insights
- The most prevalent minimum stay requirement in Lacave is 1 Night, adopted by 35.3% of listings. This highlights the market's preference for shorter, flexible bookings.
- A significant segment (17.6%) caters to monthly stays (30+ nights) in Lacave, pointing to opportunities in the extended-stay market.
Recommendations
- Align with the market by considering a 1 Night minimum stay, as 35.3% of Lacave hosts use this setting.
- Explore offering discounts for stays of 30+ nights to attract the 17.6% of the market seeking extended stays.
- Adjust minimum nights based on seasonality – potentially shorter during low season and longer during peak demand periods in Lacave.
Lacave Airbnb Cancellation Policy Trends Analysis (2025)
Flexible
1 listings
5.9% of total
Moderate
4 listings
23.5% of total
Firm
7 listings
41.2% of total
Strict
5 listings
29.4% of total
Cancellation Policy Insights for Lacave
- The prevailing Airbnb cancellation policy trend in Lacave is Firm, used by 41.2% of listings.
- A majority (70.6%) of hosts in Lacave utilize Firm or Strict policies, indicating a market where hosts prioritize booking security.
Recommendations for Hosts
- Consider adopting a Firm policy to align with the 41.2% market standard in Lacave.
- Regularly review your cancellation policy against competitors and market demand shifts in Lacave.
Lacave STR Booking Lead Time Analysis (2025)
Average Booking Lead Time by Month
Booking Lead Time Insights for Lacave
- The overall average booking lead time for vacation rentals in Lacave is 69 days.
- Guests book furthest in advance for stays during August (average 108 days), likely coinciding with peak travel demand or local events.
- The shortest booking windows occur for stays in February (average 9 days), indicating more last-minute travel plans during this time.
- Seasonally, Summer (84 days avg.) sees the longest lead times, while Winter (34 days avg.) has the shortest, reflecting typical travel planning cycles.
Recommendations for Hosts
- Use the overall average lead time (69 days) as a baseline for your pricing and availability strategy in Lacave.
- For August stays, consider implementing length-of-stay discounts or slightly higher rates for bookings made less than 108 days out to capitalize on advance planning.
- During February, focus on last-minute booking availability and promotions, as guests book with very short notice (9 days avg.).
- Target marketing efforts for the Summer season well in advance (at least 84 days) to capture early planners.
- Monitor your own booking lead times against these Lacave averages to identify opportunities for dynamic pricing adjustments.
Popular & Essential Airbnb Amenities in Lacave (2025)
Amenity Prevalence
Amenity Insights for Lacave
- Popular amenities like Refrigerator, Backyard, Dishes and silverware are common but not universal. Offering these can provide a competitive edge.
- Warning: Wifi is not universally provided but is considered essential globally. Ensure reliable Wifi is offered.
Recommendations for Hosts
- Consider adding popular differentiators like Refrigerator or Backyard to increase appeal.
- Highlight unique or less common amenities you offer (e.g., hot tub, dedicated workspace, EV charger) in your listing description and photos.
- Regularly check competitor amenities in Lacave to stay competitive.
Lacave Airbnb Guest Demographics & Profile Analysis (2025)
Guest Profile Summary for Lacave
- The typical guest profile for Airbnb in Lacave consists of primarily domestic travelers (87%), often arriving from nearby Paris, typically belonging to the Post-2000s (Gen Z/Alpha) group (50%), primarily speaking French or English.
- Domestic travelers account for 87.2% of guests.
- Key international markets include France (87.2%) and Belgium (3.7%).
- Top languages spoken are French (42.2%) followed by English (34.3%).
- A significant demographic segment is the Post-2000s (Gen Z/Alpha) group, representing 50% of guests.
Recommendations for Hosts
- Target domestic marketing efforts towards travelers from Paris and Bordeaux.
- Tailor amenities and listing descriptions to appeal to the dominant Post-2000s (Gen Z/Alpha) demographic (e.g., highlight fast WiFi, smart home features, local guides).
- Highlight unique local experiences or amenities relevant to the primary guest profile.
- Consider seasonal promotions aligned with peak travel times for key origin markets.
Nearby Short-Term Rental Market Comparison
How does the Lacave Airbnb market stack up against its neighbors? Compare key performance metrics like average monthly revenue, ADR, and occupancy rates in surrounding areas to understand the broader regional STR landscape.
| Market | Active Properties | Monthly Revenue | Daily Rate | Avg. Occupancy |
|---|---|---|---|---|
| Lanta | 10 | $2,995 | $281.26 | 42% |
| Grignols | 13 | $2,761 | $352.18 | 36% |
| Pont-de-Larn | 16 | $2,679 | $253.51 | 33% |
| Bourrou | 10 | $2,589 | $297.35 | 33% |
| Astaffort | 13 | $2,505 | $367.77 | 28% |
| La Magdelaine-sur-Tarn | 10 | $2,471 | $274.52 | 28% |
| Eynesse | 13 | $2,452 | $331.08 | 35% |
| Nizas | 11 | $2,374 | $256.06 | 31% |
| Saint-Pierre-Roche | 14 | $2,256 | $176.21 | 44% |
| Saint-Victor-la-Rivière | 20 | $2,199 | $173.29 | 43% |