Ignaux Airbnb Market Analysis 2026: Short Term Rental Data & Vacation Rental Statistics in Occitania, France
Is Airbnb profitable in Ignaux in 2026? Explore comprehensive Airbnb analytics for Ignaux, Occitania, France to uncover income potential. This 2026 STR market report for Ignaux, based on AirROI data from February 2025 to January 2026, reveals key trends in the niche market of 28 active listings.
Whether you're considering an Airbnb investment in Ignaux, optimizing your existing vacation rental, or exploring rental arbitrage opportunities, understanding the Ignaux Airbnb data is crucial. Understanding the local regulations is key to maximizing your short term rental income potential. Let's dive into the specifics.
Key Ignaux Airbnb Performance Metrics Overview
Monthly Airbnb Revenue Variations & Income Potential in Ignaux (2026)
Understanding the monthly revenue variations for Airbnb listings in Ignaux is key to maximizing your short term rental income potential. Seasonality significantly impacts earnings. Our analysis, based on data from the past 12 months, shows that the peak revenue month for STRs in Ignaux is typically February, while November often presents the lowest earnings, highlighting opportunities for strategic pricing adjustments during shoulder and low seasons. Explore the typical Airbnb income in Ignaux across different performance tiers:
- Best-in-class properties (Top 10%) achieve $3,258+ monthly, often utilizing dynamic pricing and superior guest experiences.
- Strong performing properties (Top 25%) earn $1,876 or more, indicating effective management and desirable locations/amenities.
- Typical properties (Median) generate around $926 per month, representing the average market performance.
- Entry-level properties (Bottom 25%) see earnings around $556, often with potential for optimization.
Average Monthly Airbnb Earnings Trend in Ignaux
Ignaux Airbnb Occupancy Rate Trends (2026)
Maximize your bookings by understanding the Ignaux STR occupancy trends. Seasonal demand shifts significantly influence how often properties are booked. Typically, Februarysees the highest demand (peak season occupancy), while May experiences the lowest (low season). Effective strategies, like adjusting minimum stays or offering promotions, can boost occupancy during slower periods. Here's how different property tiers perform in Ignaux:
- Best-in-class properties (Top 10%) achieve 77%+ occupancy, indicating high desirability and potentially optimized availability.
- Strong performing properties (Top 25%) maintain 48% or higher occupancy, suggesting good market fit and guest satisfaction.
- Typical properties (Median) have an occupancy rate around 30%.
- Entry-level properties (Bottom 25%) average 16% occupancy, potentially facing higher vacancy.
Average Monthly Occupancy Rate Trend in Ignaux
Average Daily Rate (ADR) Airbnb Trends in Ignaux (2026)
Effective short term rental pricing strategy in Ignaux involves understanding monthly ADR fluctuations. The Average Daily Rate (ADR) for Airbnb in Ignaux typically peaks in August and dips lowest during October. Leveraging Airbnb dynamic pricing tools or strategies based on this seasonality can significantly boost revenue. Here's a look at the typical nightly rates achieved:
- Best-in-class properties (Top 10%) command rates of $320+ per night, often due to premium features or locations.
- Strong performing properties (Top 25%) achieve nightly rates of $174 or more.
- Typical properties (Median) charge around $105 per night.
- Entry-level properties (Bottom 25%) earn around $69 per night.
Average Daily Rate (ADR) Trend by Month in Ignaux
Get Live Ignaux Market Intelligence 👇

Explore Real-time Analytics
Airbnb Seasonality Analysis & Trends in Ignaux (2026)
Peak Season (February, August, March)
- Revenue averages $2,327 per month
- Occupancy rates average 52.7%
- Daily rates average $158
Shoulder Season
- Revenue averages $1,346 per month
- Occupancy maintains around 32.8%
- Daily rates hold near $147
Low Season (September, October, November)
- Revenue drops to average $982 per month
- Occupancy decreases to average 28.8%
- Daily rates adjust to average $136
Seasonality Insights for Ignaux
- The Airbnb seasonality in Ignaux shows highly seasonal trends requiring careful strategy. While the sections above show seasonal averages, it's also insightful to look at the extremes:
- During the high season, the absolute peak month showcases Ignaux's highest earning potential, with monthly revenues capable of climbing to $2,598, occupancy reaching a high of 61.3%, and ADRs peaking at $167.
- Conversely, the slowest single month of the year, typically falling within the low season, marks the market's lowest point. In this month, revenue might dip to $813, occupancy could drop to 27.2%, and ADRs may adjust down to $134.
- Understanding both the seasonal averages and these monthly peaks and troughs in revenue, occupancy, and ADR is crucial for maximizing your Airbnb profit potential in Ignaux.
Seasonal Strategies for Maximizing Profit
- Peak Season: Maximize revenue through premium pricing and potentially longer minimum stays. Ensure high availability.
- Low Season: Offer competitive pricing, special promotions (e.g., extended stay discounts), and flexible cancellation policies. Target off-season travelers like remote workers or budget-conscious guests.
- Shoulder Seasons: Implement dynamic pricing that balances peak and low rates. Target weekend travelers or specific events. Offer slightly more flexible terms than peak season.
- Regularly analyze your own performance against these Ignaux seasonality benchmarks and adjust your pricing and availability strategy accordingly.
Best Areas for Airbnb Investment in Ignaux (2026)
Exploring the top neighborhoods for short-term rentals in Ignaux? This section highlights key areas, outlining why they are attractive for hosts and guests, along with notable local attractions. Consider these locations based on your target guest profile and investment strategy.
| Neighborhood / Area | Why Host Here? (Target Guests & Appeal) | Key Attractions & Landmarks |
|---|---|---|
| Carcassonne | Famous for its medieval fortress, Carcassonne attracts history enthusiasts and tourists who want to explore its rich heritage. It's a picturesque location with shops, restaurants, and cultural events throughout the year. | Cité de Carcassonne, Basilica of Saints Nazarius and Celsus, Canal du Midi, Carcassonne Festival, Château Comtal |
| Toulouse | Known as 'La Ville Rose', Toulouse is a vibrant city with a rich aerospace industry, attracting business travelers and tourists alike. It has a lively cultural scene and excellent food options. | Capitole de Toulouse, Basilique Saint-Sernin, Cité de l'espace, Les Abattoirs, Pont Neuf |
| Albi | Albi is renowned for its stunning Gothic architecture and the UNESCO World Heritage site of the Palais de la Berbie. It's a charming town with a relaxed atmosphere, making it popular among visitors looking for authenticity. | Albi Cathedral, Tarn River, Palais de la Berbie, Musée Toulouse-Lautrec, Pont Vieux |
| Montpellier | A dynamic city that blends history with modernity, Montpellier is popular among students and professionals. Its vibrant streets, parks, and cultural offerings make it attractive for short-term rentals. | Place de la Comédie, Montpellier Zoo, Musée Fabre, Promenade du Peyrou, Medieval streets of Écusson |
| Nîmes | Famed for its well-preserved Roman monuments, Nîmes attracts tourists interested in history and culture. It's also a gateway to the beautiful landscapes of the Camargue region. | Arenes de Nîmes, Pont du Gard, Maison Carrée, Jardins de la Fontaine, Temple de Diane |
| Sète | Known for its stunning canals and vibrant seafood culture, Sète is a charming coastal town. It's popular during the summer months and offers a unique atmosphere for visitors. | Mont Saint-Clair, Canals, L'Etang de Thau, Musée Paul Valéry, Vieux Port |
| Cévennes National Park | An exceptional natural area offering outdoor activities and stunning landscapes. Popular among nature lovers and those looking for a peaceful retreat. | Mont Lozère, Gorges du Tarn, Causses, Cévennes, Château de Portes |
| Castres | A historic town with a rich artistic heritage and beautiful waterways. Castres draws visitors interested in art, culture, and nature, making it a desirable Airbnb location. | Goya Museum, Bishop's Palace, Agout River, Castres Old Town, Jean Jaurès Museum |
Understanding Airbnb License Requirements & STR Laws in Ignaux (2026)
With 11% of listings showing registration in 2026, understanding potential Airbnb license requirements is crucial in Ignaux. Always verify the latest short term rental regulations and Airbnb license requirements directly with local government authorities for Ignaux to ensure full compliance before hosting.
(Source: AirROI data, 2026, based on 11% licensed listings)
Top Performing Airbnb Properties in Ignaux (2026)
Benchmark your potential! Explore examples of top-performing Airbnb properties in Ignauxbased on Trailing Twelve Month (TTM) revenue. Analyze their characteristics, revenue, occupancy rate, and ADR to understand what drives success in this market.
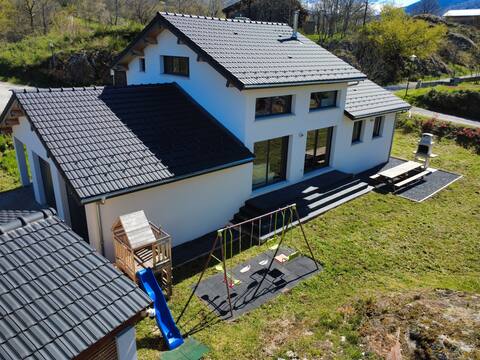
3-star Family House Ignaux 14 people
Entire Place • 4 bedrooms
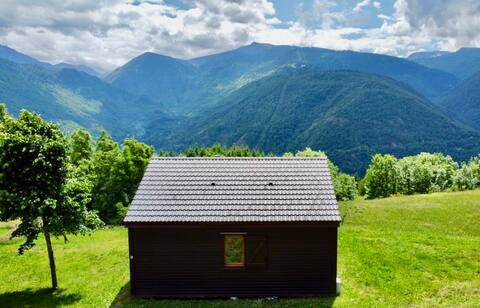
Best view – Le Petit Chalet – Ax-les-Thermes
Entire Place • 2 bedrooms
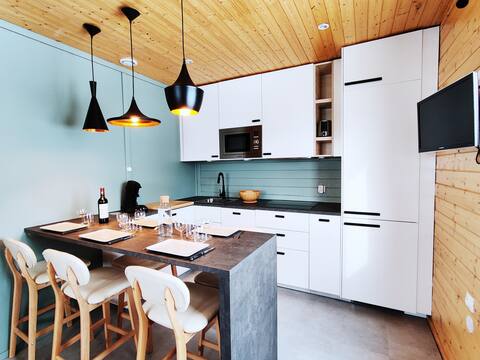
★Chalet★ Ax-les-Thermes View★ Parking★★ Hike★ Ski
Entire Place • 2 bedrooms
Chalet with pool Haute Ariège 9 p
Entire Place • 3 bedrooms
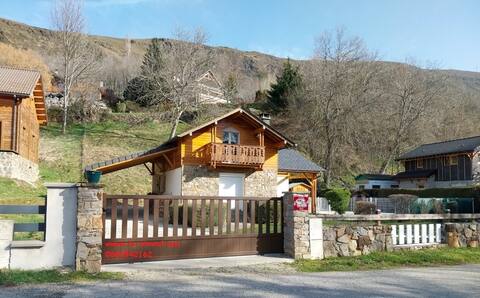
Pretty cottage overlooking Ax Valley
Entire Place • 2 bedrooms
El Xalet Ignaux 6 adults 6 children
Entire Place • 4 bedrooms
Note: Performance varies based on location, size, amenities, seasonality, and management quality. Data reflects the past 12 months.
Top Performing Airbnb Hosts in Ignaux (2026)
Learn from the best! This table showcases top-performing Airbnb hosts in Ignaux based on the number of properties managed and estimated total revenue over the past year. Analyze their scale and performance metrics.
| Host Name | Properties | Grossing Revenue | Stay Reviews | Avg Rating |
|---|---|---|---|---|
| Jérome | 2 | $52,473 | 28 | 4.86/5.0 |
| Émilie | 1 | $34,792 | 306 | 4.87/5.0 |
| Romain | 1 | $30,408 | 373 | 4.91/5.0 |
| Catherine | 1 | $29,695 | 9 | 4.56/5.0 |
| Olivier | 3 | $28,041 | 152 | 4.79/5.0 |
| Patrice | 1 | $20,990 | 60 | 4.92/5.0 |
| Laure Eve | 1 | $19,116 | 12 | 4.92/5.0 |
| Charly | 1 | $15,538 | 28 | 5.00/5.0 |
| Lydia | 1 | $11,885 | 130 | 4.93/5.0 |
| Fanny | 1 | $11,619 | 194 | 4.59/5.0 |
Analyzing the strategies of top hosts, such as their property selection, pricing, and guest communication, can offer valuable lessons for optimizing your own Airbnb operations in Ignaux.
Dive Deeper: Advanced Ignaux STR Market Data (2026)
Ready to unlock more insights? AirROI provides access to advanced metrics and comprehensive Airbnb data for Ignaux. Explore detailed analytics beyond this report to refine your investment strategy, optimize pricing, and maximize your vacation rental profits.
Explore Advanced MetricsIgnaux Short-Term Rental Market Composition (2026): Property & Room Types
Room Type Distribution
Property Type Distribution
Market Composition Insights for Ignaux
- The Ignaux Airbnb market composition is heavily skewed towards Entire Home/Apt listings, which make up 89.3% of the 28 active rentals. This indicates strong guest preference for privacy and space.
- Looking at the property type distribution in Ignaux, House properties are the most common (53.6%), reflecting the local real estate landscape.
- Houses represent a significant 53.6% portion, catering likely to families or larger groups.
- The presence of 10.7% Hotel/Boutique listings indicates integration with traditional hospitality.
Ignaux Airbnb Room Capacity Analysis (2026): Bedroom Distribution
Distribution of Listings by Number of Bedrooms
Room Capacity Insights for Ignaux
- The dominant room capacity in Ignaux is 1 bedroom listings, making up 35.7% of the market. This suggests a strong demand for properties suitable for couples or solo travelers.
- Together, 1 bedroom and 2 bedrooms properties represent 60.7% of the active Airbnb listings in Ignaux, indicating a high concentration in these sizes.
- A significant 28.6% of listings offer 3+ bedrooms, catering to larger groups and families seeking more space in Ignaux.
Ignaux Vacation Rental Guest Capacity Trends (2026)
Distribution of Listings by Guest Capacity
Guest Capacity Insights for Ignaux
- The most common guest capacity trend in Ignaux vacation rentals is listings accommodating 4 guests (35.7%). This suggests the primary traveler segment is likely small families or groups.
- Properties designed for 4 guests and 6 guests dominate the Ignaux STR market, accounting for 57.1% of listings.
- 35.7% of properties accommodate 6+ guests, serving the market segment for larger families or group travel in Ignaux.
- On average, properties in Ignaux are equipped to host 4.7 guests.
Ignaux Airbnb Booking Patterns (2026): Available vs. Booked Days
Available Days Distribution
Booked Days Distribution
Booking Pattern Insights for Ignaux
- The most common availability pattern in Ignaux falls within the 271-366 days range, representing 53.6% of listings. This suggests many properties have significant open periods on their calendars.
- Approximately 85.7% of listings show high availability (181+ days open annually), indicating potential for increased bookings or specific owner usage patterns.
- For booked days, the 31-90 days range is most frequent in Ignaux (46.4%), reflecting common guest stay durations or potential owner blocking patterns.
- A notable 17.8% of properties secure long booking periods (181+ days booked per year), highlighting successful long-term rental strategies or significant owner usage.
Ignaux Airbnb Minimum Stay Requirements Analysis
Distribution of Listings by Minimum Night Requirement
1 Night
5 listings
17.9% of total
2 Nights
3 listings
10.7% of total
3 Nights
5 listings
17.9% of total
4-6 Nights
2 listings
7.1% of total
7-29 Nights
3 listings
10.7% of total
30+ Nights
10 listings
35.7% of total
Key Insights
- The most prevalent minimum stay requirement in Ignaux is 30+ Nights, adopted by 35.7% of listings. This highlights the market's preference for longer commitments.
- A significant segment (35.7%) caters to monthly stays (30+ nights) in Ignaux, pointing to opportunities in the extended-stay market.
Recommendations
- Align with the market by considering a 30+ Nights minimum stay, as 35.7% of Ignaux hosts use this setting.
- If feasible, allowing 1-night stays, especially midweek or during low season, could capture last-minute bookings, as only 17.9% currently do.
- Explore offering discounts for stays of 30+ nights to attract the 35.7% of the market seeking extended stays.
- Adjust minimum nights based on seasonality – potentially shorter during low season and longer during peak demand periods in Ignaux.
Ignaux Airbnb Cancellation Policy Trends Analysis (2026)
Flexible
6 listings
21.4% of total
Moderate
10 listings
35.7% of total
Firm
10 listings
35.7% of total
Strict
2 listings
7.1% of total
Cancellation Policy Insights for Ignaux
- The prevailing Airbnb cancellation policy trend in Ignaux is Moderate, used by 35.7% of listings.
- There's a relatively balanced mix between guest-friendly (57.1%) and stricter (42.8%) policies, offering choices for different guest needs.
- Strict cancellation policies are quite rare (7.1%), potentially making listings with this policy less competitive unless justified by high demand or property type.
Recommendations for Hosts
- Consider adopting a Moderate policy to align with the 35.7% market standard in Ignaux.
- Using a Strict policy might deter some guests, as only 7.1% of listings use it. Evaluate if potential revenue protection outweighs possible lower booking rates.
- Regularly review your cancellation policy against competitors and market demand shifts in Ignaux.
Ignaux STR Booking Lead Time Analysis (2026)
Average Booking Lead Time by Month
Booking Lead Time Insights for Ignaux
- The overall average booking lead time for vacation rentals in Ignaux is 51 days.
- Guests book furthest in advance for stays during August (average 87 days), likely coinciding with peak travel demand or local events.
- The shortest booking windows occur for stays in November (average 9 days), indicating more last-minute travel plans during this time.
- Seasonally, Summer (72 days avg.) sees the longest lead times, while Fall (29 days avg.) has the shortest, reflecting typical travel planning cycles.
Recommendations for Hosts
- Use the overall average lead time (51 days) as a baseline for your pricing and availability strategy in Ignaux.
- For August stays, consider implementing length-of-stay discounts or slightly higher rates for bookings made less than 87 days out to capitalize on advance planning.
- During November, focus on last-minute booking availability and promotions, as guests book with very short notice (9 days avg.).
- Target marketing efforts for the Summer season well in advance (at least 72 days) to capture early planners.
- Monitor your own booking lead times against these Ignaux averages to identify opportunities for dynamic pricing adjustments.
Popular & Essential Airbnb Amenities in Ignaux (2026)
Amenity Prevalence
Amenity Insights for Ignaux
- Essential amenities in Ignaux that guests expect include: Heating, Free parking on premises. Lacking these (any) could significantly impact bookings.
- Popular amenities like Hot water, Hangers, Hair dryer are common but not universal. Offering these can provide a competitive edge.
Recommendations for Hosts
- Ensure your listing includes all essential amenities for Ignaux: Heating, Free parking on premises.
- Prioritize adding missing essentials: Free parking on premises.
- Consider adding popular differentiators like Hot water or Hangers to increase appeal.
- Highlight unique or less common amenities you offer (e.g., hot tub, dedicated workspace, EV charger) in your listing description and photos.
- Regularly check competitor amenities in Ignaux to stay competitive.
Ignaux Airbnb Guest Demographics & Profile Analysis (2026)
Guest Profile Summary for Ignaux
- The typical guest profile for Airbnb in Ignaux consists of primarily domestic travelers (77%), often arriving from nearby Toulouse, typically belonging to the Post-2000s (Gen Z/Alpha) group (50%), primarily speaking French or English.
- Domestic travelers account for 76.7% of guests.
- Key international markets include France (76.7%) and Spain (12.9%).
- Top languages spoken are French (35.3%) followed by English (30.8%).
- A significant demographic segment is the Post-2000s (Gen Z/Alpha) group, representing 50% of guests.
Recommendations for Hosts
- Target domestic marketing efforts towards travelers from Toulouse and Barcelona.
- Tailor amenities and listing descriptions to appeal to the dominant Post-2000s (Gen Z/Alpha) demographic (e.g., highlight fast WiFi, smart home features, local guides).
- Highlight unique local experiences or amenities relevant to the primary guest profile.
- Consider seasonal promotions aligned with peak travel times for key origin markets.
Nearby Short-Term Rental Market Comparison
How does the Ignaux Airbnb market stack up against its neighbors? Compare key performance metrics like average monthly revenue, ADR, and occupancy rates in surrounding areas to understand the broader regional STR landscape.
| Market | Active Properties | Monthly Revenue | Daily Rate | Avg. Occupancy |
|---|---|---|---|---|
| Canyelles | 47 | $7,127 | $1152.36 | 35% |
| Cornellà del Terri | 15 | $6,458 | $584.61 | 40% |
| Vallirana | 10 | $5,639 | $350.46 | 57% |
| Tiana | 15 | $5,135 | $362.37 | 45% |
| Sant Vicenç de Montalt | 40 | $5,005 | $422.72 | 39% |
| Amer | 11 | $4,949 | $462.57 | 38% |
| Sant Andreu de Llavaneres | 45 | $4,931 | $450.05 | 41% |
| Teià | 25 | $4,821 | $394.46 | 40% |
| Premià de Dalt | 31 | $4,548 | $337.99 | 47% |
| Alella | 39 | $4,534 | $496.22 | 47% |