Mérignac Airbnb Market Analysis 2026: Short Term Rental Data & Vacation Rental Statistics in Nouvelle-Aquitaine, France
Is Airbnb profitable in Mérignac in 2026? Explore comprehensive Airbnb analytics for Mérignac, Nouvelle-Aquitaine, France to uncover income potential. This 2026 STR market report for Mérignac, based on AirROI data from February 2025 to January 2026, reveals key trends in the market of 358 active listings.
Whether you're considering an Airbnb investment in Mérignac, optimizing your existing vacation rental, or exploring rental arbitrage opportunities, understanding the Mérignac Airbnb data is crucial. Leveraging the low regulation environment is key to maximizing your short term rental income potential. Let's dive into the specifics.
Key Mérignac Airbnb Performance Metrics Overview
Monthly Airbnb Revenue Variations & Income Potential in Mérignac (2026)
Understanding the monthly revenue variations for Airbnb listings in Mérignac is key to maximizing your short term rental income potential. Seasonality significantly impacts earnings. Our analysis, based on data from the past 12 months, shows that the peak revenue month for STRs in Mérignac is typically August, while January often presents the lowest earnings, highlighting opportunities for strategic pricing adjustments during shoulder and low seasons. Explore the typical Airbnb income in Mérignac across different performance tiers:
- Best-in-class properties (Top 10%) achieve $3,115+ monthly, often utilizing dynamic pricing and superior guest experiences.
- Strong performing properties (Top 25%) earn $1,992 or more, indicating effective management and desirable locations/amenities.
- Typical properties (Median) generate around $1,206 per month, representing the average market performance.
- Entry-level properties (Bottom 25%) see earnings around $616, often with potential for optimization.
Average Monthly Airbnb Earnings Trend in Mérignac
Mérignac Airbnb Occupancy Rate Trends (2026)
Maximize your bookings by understanding the Mérignac STR occupancy trends. Seasonal demand shifts significantly influence how often properties are booked. Typically, Augustsees the highest demand (peak season occupancy), while January experiences the lowest (low season). Effective strategies, like adjusting minimum stays or offering promotions, can boost occupancy during slower periods. Here's how different property tiers perform in Mérignac:
- Best-in-class properties (Top 10%) achieve 85%+ occupancy, indicating high desirability and potentially optimized availability.
- Strong performing properties (Top 25%) maintain 71% or higher occupancy, suggesting good market fit and guest satisfaction.
- Typical properties (Median) have an occupancy rate around 47%.
- Entry-level properties (Bottom 25%) average 23% occupancy, potentially facing higher vacancy.
Average Monthly Occupancy Rate Trend in Mérignac
Average Daily Rate (ADR) Airbnb Trends in Mérignac (2026)
Effective short term rental pricing strategy in Mérignac involves understanding monthly ADR fluctuations. The Average Daily Rate (ADR) for Airbnb in Mérignac typically peaks in September and dips lowest during March. Leveraging Airbnb dynamic pricing tools or strategies based on this seasonality can significantly boost revenue. Here's a look at the typical nightly rates achieved:
- Best-in-class properties (Top 10%) command rates of $227+ per night, often due to premium features or locations.
- Strong performing properties (Top 25%) achieve nightly rates of $124 or more.
- Typical properties (Median) charge around $85 per night.
- Entry-level properties (Bottom 25%) earn around $58 per night.
Average Daily Rate (ADR) Trend by Month in Mérignac
Get Live Mérignac Market Intelligence 👇

Explore Real-time Analytics
Airbnb Seasonality Analysis & Trends in Mérignac (2026)
Peak Season (August, July, June)
- Revenue averages $2,035 per month
- Occupancy rates average 52.2%
- Daily rates average $115
Shoulder Season
- Revenue averages $1,528 per month
- Occupancy maintains around 48.4%
- Daily rates hold near $114
Low Season (January, February, March)
- Revenue drops to average $1,189 per month
- Occupancy decreases to average 42.2%
- Daily rates adjust to average $110
Seasonality Insights for Mérignac
- The Airbnb seasonality in Mérignac shows highly seasonal trends requiring careful strategy. While the sections above show seasonal averages, it's also insightful to look at the extremes:
- During the high season, the absolute peak month showcases Mérignac's highest earning potential, with monthly revenues capable of climbing to $2,284, occupancy reaching a high of 57.4%, and ADRs peaking at $118.
- Conversely, the slowest single month of the year, typically falling within the low season, marks the market's lowest point. In this month, revenue might dip to $1,069, occupancy could drop to 34.8%, and ADRs may adjust down to $107.
- Understanding both the seasonal averages and these monthly peaks and troughs in revenue, occupancy, and ADR is crucial for maximizing your Airbnb profit potential in Mérignac.
Seasonal Strategies for Maximizing Profit
- Peak Season: Maximize revenue through premium pricing and potentially longer minimum stays. Ensure high availability.
- Low Season: Offer competitive pricing, special promotions (e.g., extended stay discounts), and flexible cancellation policies. Target off-season travelers like remote workers or budget-conscious guests.
- Shoulder Seasons: Implement dynamic pricing that balances peak and low rates. Target weekend travelers or specific events. Offer slightly more flexible terms than peak season.
- Regularly analyze your own performance against these Mérignac seasonality benchmarks and adjust your pricing and availability strategy accordingly.
Best Areas for Airbnb Investment in Mérignac (2026)
Exploring the top neighborhoods for short-term rentals in Mérignac? This section highlights key areas, outlining why they are attractive for hosts and guests, along with notable local attractions. Consider these locations based on your target guest profile and investment strategy.
| Neighborhood / Area | Why Host Here? (Target Guests & Appeal) | Key Attractions & Landmarks |
|---|---|---|
| Centre de Mérignac | The heart of Mérignac with easy access to shops, restaurants, and public transport. Ideal for tourists who want to explore the local culture and amenities. | Mérignac Town Hall, Shopping centre Mérignac Soleil, Park Bourran, Local markets, Cultural festivals |
| Mérignac Airport Area | Close to Bordeaux-Mérignac Airport, this area is convenient for travelers looking for short stays. Perfect for business travelers and those with early flights. | Bordeaux-Mérignac Airport, Airpark Bordeaux-Mérignac, Airport lounges, Nearby hotels, Public transport links |
| Parc de Bourran | A beautiful park area that attracts families and nature lovers. Offers a peaceful environment for relaxation. | Parc de Bourran, Walking trails, Playgrounds, Picnic areas, Local wildlife |
| Pessac | A neighboring suburb known for its wine culture and proximity to Bordeaux. Attracts tourists looking to explore wine routes. | Château Pape Clément, Wine estates, Pessac historical center, Local wine tasting, Cultural events |
| Capeyron | A residential area with a vibrant community feel. Great for longer stays and suitable for families. | Local parks, Community centers, Markets, Cafés, Family-friendly attractions |
| Mérignac Technopole | Home to many businesses and startups, ideal for business travelers and tech professionals. Close to modern amenities. | Technopole buildings, Business hubs, Cafe culture, Co-working spaces, Networking events |
| Le Lys | A quiet suburban area with a local charm; great for those seeking a peaceful getaway. | Local markets, Suburban parks, Cafés, Community events, Family homes |
| Centr'All | A dynamic area with shopping and entertainment options, perfect for tourists who enjoy an active lifestyle. | Shopping centres, Restaurants, Leisure activities, Cultural sites, Public transport access |
Understanding Airbnb License Requirements & STR Laws in Mérignac (2026)
While Mérignac, Nouvelle-Aquitaine, France currently shows low STR regulations, specific Airbnb license requirements might still exist or change. Always verify the latest short term rental regulations and Airbnb license requirements directly with local government authorities for Mérignac to ensure full compliance before hosting.
(Source: AirROI data, 2026, based on 7% licensed listings)
Top Performing Airbnb Properties in Mérignac (2026)
Benchmark your potential! Explore examples of top-performing Airbnb properties in Mérignacbased on Trailing Twelve Month (TTM) revenue. Analyze their characteristics, revenue, occupancy rate, and ADR to understand what drives success in this market.

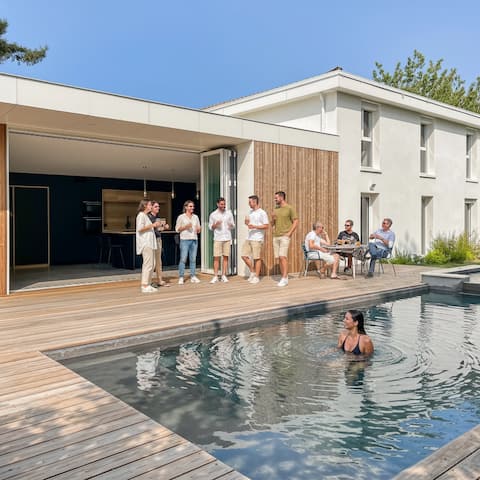
Villa with heated pool, sleeps 10
Entire Place • 5 bedrooms
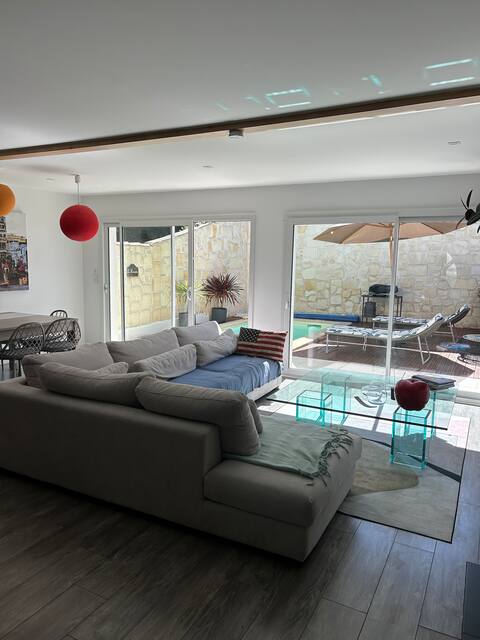
Comfortable and quiet villa in Mérignac
Entire Place • 4 bedrooms
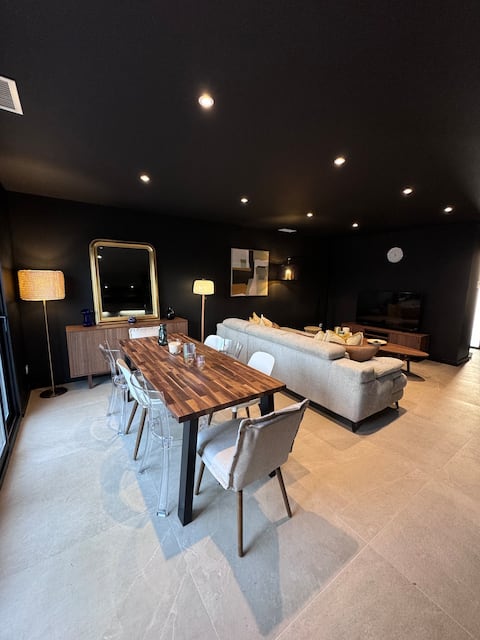
Cozy southern house with landscaped garden
Entire Place • 5 bedrooms
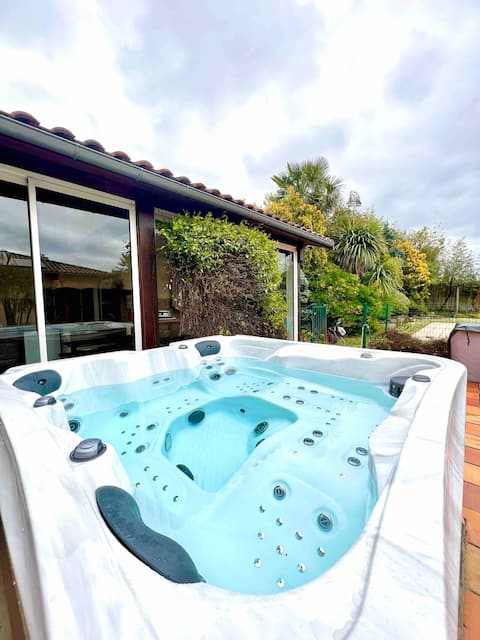
Bordeaux: Pretty 6-person air-conditioned villa with pool
Entire Place • 4 bedrooms

Porte de Bordeaux, 6 bedroom villa, pool.
Entire Place • 6 bedrooms
New house 4 bedrooms/pool
Entire Place • 4 bedrooms
Note: Performance varies based on location, size, amenities, seasonality, and management quality. Data reflects the past 12 months.
Top Performing Airbnb Hosts in Mérignac (2026)
Learn from the best! This table showcases top-performing Airbnb hosts in Mérignac based on the number of properties managed and estimated total revenue over the past year. Analyze their scale and performance metrics.
| Host Name | Properties | Grossing Revenue | Stay Reviews | Avg Rating |
|---|---|---|---|---|
| Elodie | 1 | $132,046 | 20 | 5.00/5.0 |
| Joris | 6 | $129,339 | 958 | 4.80/5.0 |
| Zen Zone Prestige Services | 1 | $88,250 | 49 | 4.90/5.0 |
| Benjamin | 4 | $79,459 | 251 | 4.88/5.0 |
| Infinit'Rooms | 4 | $73,874 | 292 | 4.76/5.0 |
| José | 1 | $70,925 | 83 | 4.70/5.0 |
| Noemie | 1 | $59,974 | 28 | 4.89/5.0 |
| Soraya | 2 | $55,085 | 89 | 4.71/5.0 |
| Eric | 6 | $52,696 | 244 | 4.95/5.0 |
| G | 1 | $52,458 | 127 | 4.83/5.0 |
Analyzing the strategies of top hosts, such as their property selection, pricing, and guest communication, can offer valuable lessons for optimizing your own Airbnb operations in Mérignac.
Dive Deeper: Advanced Mérignac STR Market Data (2026)
Ready to unlock more insights? AirROI provides access to advanced metrics and comprehensive Airbnb data for Mérignac. Explore detailed analytics beyond this report to refine your investment strategy, optimize pricing, and maximize your vacation rental profits.
Explore Advanced MetricsMérignac Short-Term Rental Market Composition (2026): Property & Room Types
Room Type Distribution
Property Type Distribution
Market Composition Insights for Mérignac
- The Mérignac Airbnb market composition is heavily skewed towards Entire Home/Apt listings, which make up 72.9% of the 358 active rentals. This indicates strong guest preference for privacy and space.
- Looking at the property type distribution in Mérignac, Apartment/Condo properties are the most common (49.4%), reflecting the local real estate landscape.
- Houses represent a significant 40.5% portion, catering likely to families or larger groups.
- The presence of 8.4% Hotel/Boutique listings indicates integration with traditional hospitality.
- Smaller segments like outdoor/unique, others (combined 1.6%) offer potential for unique stay experiences.
Mérignac Airbnb Room Capacity Analysis (2026): Bedroom Distribution
Distribution of Listings by Number of Bedrooms
Room Capacity Insights for Mérignac
- The dominant room capacity in Mérignac is 1 bedroom listings, making up 35.5% of the market. This suggests a strong demand for properties suitable for couples or solo travelers.
- Together, 1 bedroom and 2 bedrooms properties represent 51.7% of the active Airbnb listings in Mérignac, indicating a high concentration in these sizes.
Mérignac Vacation Rental Guest Capacity Trends (2026)
Distribution of Listings by Guest Capacity
Guest Capacity Insights for Mérignac
- The most common guest capacity trend in Mérignac vacation rentals is listings accommodating 2 guests (25.7%). This suggests the primary traveler segment is likely couples or solo travelers.
- Properties designed for 2 guests and 4 guests dominate the Mérignac STR market, accounting for 48.0% of listings.
- 18.1% of properties accommodate 6+ guests, serving the market segment for larger families or group travel in Mérignac.
- On average, properties in Mérignac are equipped to host 3.0 guests.
Mérignac Airbnb Booking Patterns (2026): Available vs. Booked Days
Available Days Distribution
Booked Days Distribution
Booking Pattern Insights for Mérignac
- The most common availability pattern in Mérignac falls within the 271-366 days range, representing 47.5% of listings. This suggests many properties have significant open periods on their calendars.
- Approximately 74.9% of listings show high availability (181+ days open annually), indicating potential for increased bookings or specific owner usage patterns.
- For booked days, the 31-90 days range is most frequent in Mérignac (27.7%), reflecting common guest stay durations or potential owner blocking patterns.
- A notable 27.4% of properties secure long booking periods (181+ days booked per year), highlighting successful long-term rental strategies or significant owner usage.
Mérignac Airbnb Minimum Stay Requirements Analysis
Distribution of Listings by Minimum Night Requirement
1 Night
83 listings
23.2% of total
2 Nights
94 listings
26.3% of total
3 Nights
39 listings
10.9% of total
4-6 Nights
37 listings
10.3% of total
7-29 Nights
16 listings
4.5% of total
30+ Nights
89 listings
24.9% of total
Key Insights
- The most prevalent minimum stay requirement in Mérignac is 2 Nights, adopted by 26.3% of listings. This highlights the market's preference for shorter, flexible bookings.
- A significant segment (24.9%) caters to monthly stays (30+ nights) in Mérignac, pointing to opportunities in the extended-stay market.
Recommendations
- Align with the market by considering a 2 Nights minimum stay, as 26.3% of Mérignac hosts use this setting.
- If feasible, allowing 1-night stays, especially midweek or during low season, could capture last-minute bookings, as only 23.2% currently do.
- Explore offering discounts for stays of 30+ nights to attract the 24.9% of the market seeking extended stays.
- Adjust minimum nights based on seasonality – potentially shorter during low season and longer during peak demand periods in Mérignac.
Mérignac Airbnb Cancellation Policy Trends Analysis (2026)
Refundable
1 listings
0.3% of total
Super Strict 30 Days
1 listings
0.3% of total
Limited
1 listings
0.3% of total
Flexible
125 listings
35% of total
Moderate
126 listings
35.3% of total
Firm
78 listings
21.8% of total
Strict
25 listings
7% of total
Cancellation Policy Insights for Mérignac
- The prevailing Airbnb cancellation policy trend in Mérignac is Moderate, used by 35.3% of listings.
- The market strongly favors guest-friendly terms, with 70.3% of listings offering Flexible or Moderate policies. This suggests guests in Mérignac may expect booking flexibility.
- Strict cancellation policies are quite rare (7%), potentially making listings with this policy less competitive unless justified by high demand or property type.
Recommendations for Hosts
- Consider adopting a Moderate policy to align with the 35.3% market standard in Mérignac.
- Using a Strict policy might deter some guests, as only 7% of listings use it. Evaluate if potential revenue protection outweighs possible lower booking rates.
- Regularly review your cancellation policy against competitors and market demand shifts in Mérignac.
Mérignac STR Booking Lead Time Analysis (2026)
Average Booking Lead Time by Month
Booking Lead Time Insights for Mérignac
- The overall average booking lead time for vacation rentals in Mérignac is 37 days.
- Guests book furthest in advance for stays during August (average 49 days), likely coinciding with peak travel demand or local events.
- The shortest booking windows occur for stays in February (average 26 days), indicating more last-minute travel plans during this time.
- Seasonally, Summer (40 days avg.) sees the longest lead times, while Winter (33 days avg.) has the shortest, reflecting typical travel planning cycles.
Recommendations for Hosts
- Use the overall average lead time (37 days) as a baseline for your pricing and availability strategy in Mérignac.
- For August stays, consider implementing length-of-stay discounts or slightly higher rates for bookings made less than 49 days out to capitalize on advance planning.
- Target marketing efforts for the Summer season well in advance (at least 40 days) to capture early planners.
- Monitor your own booking lead times against these Mérignac averages to identify opportunities for dynamic pricing adjustments.
Popular & Essential Airbnb Amenities in Mérignac (2026)
Amenity Prevalence
Amenity Insights for Mérignac
- Essential amenities in Mérignac that guests expect include: Wifi. Lacking these (this) could significantly impact bookings.
- Popular amenities like Kitchen, Heating, TV are common but not universal. Offering these can provide a competitive edge.
Recommendations for Hosts
- Ensure your listing includes all essential amenities for Mérignac: Wifi.
- Prioritize adding missing essentials: Wifi.
- Consider adding popular differentiators like Kitchen or Heating to increase appeal.
- Highlight unique or less common amenities you offer (e.g., hot tub, dedicated workspace, EV charger) in your listing description and photos.
- Regularly check competitor amenities in Mérignac to stay competitive.
Mérignac Airbnb Guest Demographics & Profile Analysis (2026)
Guest Profile Summary for Mérignac
- The typical guest profile for Airbnb in Mérignac consists of primarily domestic travelers (83%), often arriving from nearby Paris, typically belonging to the Post-2000s (Gen Z/Alpha) group (50%), primarily speaking French or English.
- Domestic travelers account for 82.7% of guests.
- Key international markets include France (82.7%) and United Kingdom (3%).
- Top languages spoken are French (42.9%) followed by English (32.1%).
- A significant demographic segment is the Post-2000s (Gen Z/Alpha) group, representing 50% of guests.
Recommendations for Hosts
- Target domestic marketing efforts towards travelers from Paris and Bordeaux.
- Tailor amenities and listing descriptions to appeal to the dominant Post-2000s (Gen Z/Alpha) demographic (e.g., highlight fast WiFi, smart home features, local guides).
- Highlight unique local experiences or amenities relevant to the primary guest profile.
- Consider seasonal promotions aligned with peak travel times for key origin markets.
Nearby Short-Term Rental Market Comparison
How does the Mérignac Airbnb market stack up against its neighbors? Compare key performance metrics like average monthly revenue, ADR, and occupancy rates in surrounding areas to understand the broader regional STR landscape.
| Market | Active Properties | Monthly Revenue | Daily Rate | Avg. Occupancy |
|---|---|---|---|---|
| San Sebastián | 1,382 | $3,844 | $287.28 | 49% |
| Carignan-de-Bordeaux | 34 | $3,140 | $316.66 | 42% |
| Néac | 11 | $3,047 | $441.32 | 38% |
| Bourrou | 10 | $2,788 | $294.83 | 35% |
| Eynesse | 13 | $2,664 | $331.30 | 37% |
| Cénac | 17 | $2,542 | $307.76 | 44% |
| Saint-Seurin-de-Cadourne | 12 | $2,529 | $378.76 | 33% |
| Saint-Laurent-de-Gosse | 17 | $2,519 | $345.09 | 35% |
| Milhac-de-Nontron | 10 | $2,394 | $254.42 | 43% |
| Beautiran | 10 | $2,388 | $244.69 | 35% |