Mimizan Airbnb Market Analysis 2026: Short Term Rental Data & Vacation Rental Statistics in Nouvelle-Aquitaine, France
Is Airbnb profitable in Mimizan in 2026? Explore comprehensive Airbnb analytics for Mimizan, Nouvelle-Aquitaine, France to uncover income potential. This 2026 STR market report for Mimizan, based on AirROI data from February 2025 to January 2026, reveals key trends in the market of 920 active listings.
Whether you're considering an Airbnb investment in Mimizan, optimizing your existing vacation rental, or exploring rental arbitrage opportunities, understanding the Mimizan Airbnb data is crucial. Leveraging the low regulation environment is key to maximizing your short term rental income potential. Let's dive into the specifics.
Key Mimizan Airbnb Performance Metrics Overview
Monthly Airbnb Revenue Variations & Income Potential in Mimizan (2026)
Understanding the monthly revenue variations for Airbnb listings in Mimizan is key to maximizing your short term rental income potential. Seasonality significantly impacts earnings. Our analysis, based on data from the past 12 months, shows that the peak revenue month for STRs in Mimizan is typically August, while January often presents the lowest earnings, highlighting opportunities for strategic pricing adjustments during shoulder and low seasons. Explore the typical Airbnb income in Mimizan across different performance tiers:
- Best-in-class properties (Top 10%) achieve $3,254+ monthly, often utilizing dynamic pricing and superior guest experiences.
- Strong performing properties (Top 25%) earn $2,069 or more, indicating effective management and desirable locations/amenities.
- Typical properties (Median) generate around $1,292 per month, representing the average market performance.
- Entry-level properties (Bottom 25%) see earnings around $698, often with potential for optimization.
Average Monthly Airbnb Earnings Trend in Mimizan
Mimizan Airbnb Occupancy Rate Trends (2026)
Maximize your bookings by understanding the Mimizan STR occupancy trends. Seasonal demand shifts significantly influence how often properties are booked. Typically, Augustsees the highest demand (peak season occupancy), while January experiences the lowest (low season). Effective strategies, like adjusting minimum stays or offering promotions, can boost occupancy during slower periods. Here's how different property tiers perform in Mimizan:
- Best-in-class properties (Top 10%) achieve 71%+ occupancy, indicating high desirability and potentially optimized availability.
- Strong performing properties (Top 25%) maintain 52% or higher occupancy, suggesting good market fit and guest satisfaction.
- Typical properties (Median) have an occupancy rate around 34%.
- Entry-level properties (Bottom 25%) average 18% occupancy, potentially facing higher vacancy.
Average Monthly Occupancy Rate Trend in Mimizan
Average Daily Rate (ADR) Airbnb Trends in Mimizan (2026)
Effective short term rental pricing strategy in Mimizan involves understanding monthly ADR fluctuations. The Average Daily Rate (ADR) for Airbnb in Mimizan typically peaks in July and dips lowest during March. Leveraging Airbnb dynamic pricing tools or strategies based on this seasonality can significantly boost revenue. Here's a look at the typical nightly rates achieved:
- Best-in-class properties (Top 10%) command rates of $265+ per night, often due to premium features or locations.
- Strong performing properties (Top 25%) achieve nightly rates of $177 or more.
- Typical properties (Median) charge around $122 per night.
- Entry-level properties (Bottom 25%) earn around $92 per night.
Average Daily Rate (ADR) Trend by Month in Mimizan
Get Live Mimizan Market Intelligence 👇

Explore Real-time Analytics
Airbnb Seasonality Analysis & Trends in Mimizan (2026)
Peak Season (August, July, June)
- Revenue averages $3,176 per month
- Occupancy rates average 56.3%
- Daily rates average $173
Shoulder Season
- Revenue averages $1,278 per month
- Occupancy maintains around 33.1%
- Daily rates hold near $149
Low Season (January, February, November)
- Revenue drops to average $802 per month
- Occupancy decreases to average 23.8%
- Daily rates adjust to average $148
Seasonality Insights for Mimizan
- The Airbnb seasonality in Mimizan shows highly seasonal trends requiring careful strategy. While the sections above show seasonal averages, it's also insightful to look at the extremes:
- During the high season, the absolute peak month showcases Mimizan's highest earning potential, with monthly revenues capable of climbing to $4,230, occupancy reaching a high of 71.2%, and ADRs peaking at $180.
- Conversely, the slowest single month of the year, typically falling within the low season, marks the market's lowest point. In this month, revenue might dip to $703, occupancy could drop to 17.3%, and ADRs may adjust down to $142.
- Understanding both the seasonal averages and these monthly peaks and troughs in revenue, occupancy, and ADR is crucial for maximizing your Airbnb profit potential in Mimizan.
Seasonal Strategies for Maximizing Profit
- Peak Season: Maximize revenue through premium pricing and potentially longer minimum stays. Ensure high availability.
- Low Season: Offer competitive pricing, special promotions (e.g., extended stay discounts), and flexible cancellation policies. Target off-season travelers like remote workers or budget-conscious guests.
- Shoulder Seasons: Implement dynamic pricing that balances peak and low rates. Target weekend travelers or specific events. Offer slightly more flexible terms than peak season.
- Regularly analyze your own performance against these Mimizan seasonality benchmarks and adjust your pricing and availability strategy accordingly.
Best Areas for Airbnb Investment in Mimizan (2026)
Exploring the top neighborhoods for short-term rentals in Mimizan? This section highlights key areas, outlining why they are attractive for hosts and guests, along with notable local attractions. Consider these locations based on your target guest profile and investment strategy.
| Neighborhood / Area | Why Host Here? (Target Guests & Appeal) | Key Attractions & Landmarks |
|---|---|---|
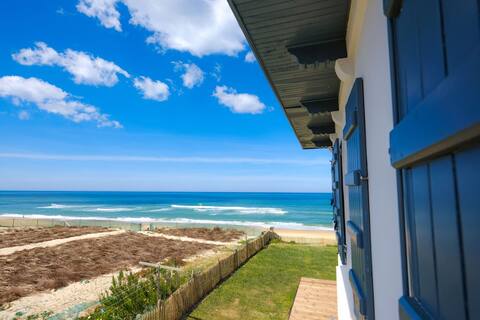
| Mimizan Plage | Mimizan Plage is renowned for its beautiful sandy beaches and surf spots, making it a top destination for beach lovers and water sports enthusiasts. It's a lively area, especially in summer, with numerous restaurants and cafes. | Mimizan Beach, Plage de la Garluche, Surfing Schools, Mimizan Lake, Cycling Routes |
| Mimizan Center | The center of Mimizan offers a charming small-town atmosphere with access to local markets, shops, and restaurants. It is ideal for those looking to experience the local culture and lifestyle. | Mimizan Market, Church of St. Vincent, Local Boutiques, Artisan Shops |
| Contis-Plage | Just south of Mimizan, Contis-Plage is a quieter beach area perfect for families and nature enthusiasts. It is surrounded by pine forests and offers a more laid-back beach experience. | Contis Beach, Nature Reserves, Walking Trails, Local Cafés |
| Lespecier | An ideal residential area for those looking for a peaceful environment. It's popular among families and offers easy access to nearby attractions without the tourist crowds. | Local Parks, Playgrounds, Quiet Streets |
| L'Étang | A natural area surrounding a lake known for outdoor activities such as kayaking, fishing, and hiking. It's a great spot for eco-tourism and those who enjoy nature. | L'Étang de Mimizan, Kayaking, Fishing Spots, Hiking Trails |
| Mimizan Port | A small port area that offers access to various water activities and is known for its seafood restaurants. It's a great area for those who love being near the water and enjoying fresh local cuisine. | Port de Mimizan, Fishing Activities, Seafood Restaurants |
| Hauriet | This area combines proximity to the beach with a more rural feel, providing a balance between nature and beach life. Ideal for those looking for a peaceful retreat close to the bustling beach. | Pine Forests, Cycling Trails, Secluded Beaches |
| Mimizan Golf Course | Ideal for golf enthusiasts, this area offers a beautiful golf course surrounded by nature. It's also a good option for those looking to stay active during their holiday. | Mimizan Golf Course, Clubhouse, Nature Trails |
Understanding Airbnb License Requirements & STR Laws in Mimizan (2026)
While Mimizan, Nouvelle-Aquitaine, France currently shows low STR regulations, specific Airbnb license requirements might still exist or change. Always verify the latest short term rental regulations and Airbnb license requirements directly with local government authorities for Mimizan to ensure full compliance before hosting.
(Source: AirROI data, 2026, based on 8% licensed listings)
Top Performing Airbnb Properties in Mimizan (2026)
Benchmark your potential! Explore examples of top-performing Airbnb properties in Mimizanbased on Trailing Twelve Month (TTM) revenue. Analyze their characteristics, revenue, occupancy rate, and ADR to understand what drives success in this market.
Superb 1st line Ocean villa - Private beach access
Entire Place • 8 bedrooms
large villa with pool, beach to walking distance
Entire Place • 6 bedrooms

Villa Zanzibar - 80 m from the beach with pool
Entire Place • 6 bedrooms

Spacious and comfortable river view villa
Entire Place • 6 bedrooms
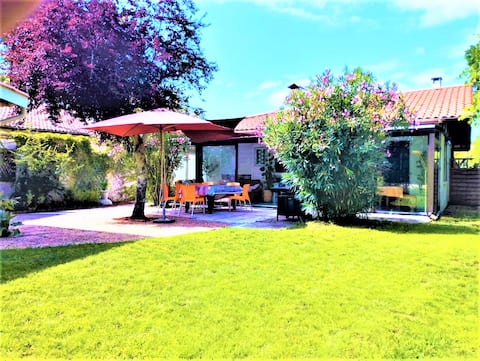
800 m from the beaches. Dogs ok!
Entire Place • 4 bedrooms

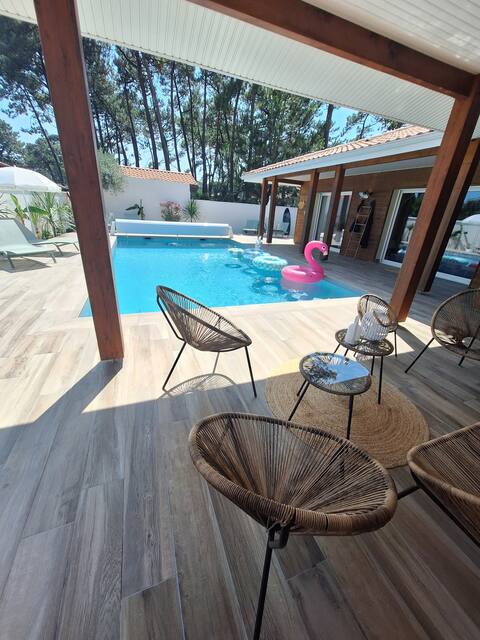
House with heated pool on the beach
Entire Place • 3 bedrooms
Note: Performance varies based on location, size, amenities, seasonality, and management quality. Data reflects the past 12 months.
Top Performing Airbnb Hosts in Mimizan (2026)
Learn from the best! This table showcases top-performing Airbnb hosts in Mimizan based on the number of properties managed and estimated total revenue over the past year. Analyze their scale and performance metrics.
| Host Name | Properties | Grossing Revenue | Stay Reviews | Avg Rating |
|---|---|---|---|---|
| Annabelle - Interhome | 82 | $779,444 | 476 | 4.45/5.0 |
| Thomas | 24 | $377,053 | 301 | 4.66/5.0 |
| Marine | 32 | $344,289 | 456 | 4.79/5.0 |
| Cécile | 4 | $219,640 | 186 | 4.85/5.0 |
| Luis | 9 | $171,852 | 707 | 4.83/5.0 |
| Fabienne | 12 | $140,344 | 76 | 4.56/5.0 |
| Cassandra | 4 | $133,392 | 40 | 4.93/5.0 |
| Agence Guy Hoquet Mimizan | 38 | $124,704 | 263 | 4.29/5.0 |
| Ivona Vacances | 4 | $114,214 | 95 | 4.92/5.0 |
| Dorothée | 1 | $104,442 | 21 | 4.95/5.0 |
Analyzing the strategies of top hosts, such as their property selection, pricing, and guest communication, can offer valuable lessons for optimizing your own Airbnb operations in Mimizan.
Dive Deeper: Advanced Mimizan STR Market Data (2026)
Ready to unlock more insights? AirROI provides access to advanced metrics and comprehensive Airbnb data for Mimizan. Explore detailed analytics beyond this report to refine your investment strategy, optimize pricing, and maximize your vacation rental profits.
Explore Advanced MetricsMimizan Short-Term Rental Market Composition (2026): Property & Room Types
Room Type Distribution
Property Type Distribution
Market Composition Insights for Mimizan
- The Mimizan Airbnb market composition is heavily skewed towards Entire Home/Apt listings, which make up 97.4% of the 920 active rentals. This indicates strong guest preference for privacy and space.
- Looking at the property type distribution in Mimizan, House properties are the most common (51.5%), reflecting the local real estate landscape.
- Houses represent a significant 51.5% portion, catering likely to families or larger groups.
- Smaller segments like outdoor/unique, hotel/boutique, others (combined 5.1%) offer potential for unique stay experiences.
Mimizan Airbnb Room Capacity Analysis (2026): Bedroom Distribution
Distribution of Listings by Number of Bedrooms
Room Capacity Insights for Mimizan
- The dominant room capacity in Mimizan is 2 bedrooms listings, making up 35.5% of the market. This suggests a strong demand for properties suitable for couples or solo travelers.
- Together, 2 bedrooms and 1 bedroom properties represent 60.3% of the active Airbnb listings in Mimizan, indicating a high concentration in these sizes.
- A significant 32.6% of listings offer 3+ bedrooms, catering to larger groups and families seeking more space in Mimizan.
Mimizan Vacation Rental Guest Capacity Trends (2026)
Distribution of Listings by Guest Capacity
Guest Capacity Insights for Mimizan
- The most common guest capacity trend in Mimizan vacation rentals is listings accommodating 4 guests (30.5%). This suggests the primary traveler segment is likely small families or groups.
- Properties designed for 4 guests and 6 guests dominate the Mimizan STR market, accounting for 56.3% of listings.
- 46.1% of properties accommodate 6+ guests, serving the market segment for larger families or group travel in Mimizan.
- On average, properties in Mimizan are equipped to host 5.1 guests.
Mimizan Airbnb Booking Patterns (2026): Available vs. Booked Days
Available Days Distribution
Booked Days Distribution
Booking Pattern Insights for Mimizan
- The most common availability pattern in Mimizan falls within the 271-366 days range, representing 62.4% of listings. This suggests many properties have significant open periods on their calendars.
- Approximately 92.1% of listings show high availability (181+ days open annually), indicating potential for increased bookings or specific owner usage patterns.
- For booked days, the 31-90 days range is most frequent in Mimizan (42.3%), reflecting common guest stay durations or potential owner blocking patterns.
- A notable 8.3% of properties secure long booking periods (181+ days booked per year), highlighting successful long-term rental strategies or significant owner usage.
Mimizan Airbnb Minimum Stay Requirements Analysis
Distribution of Listings by Minimum Night Requirement
1 Night
74 listings
8% of total
2 Nights
72 listings
7.8% of total
3 Nights
38 listings
4.1% of total
4-6 Nights
123 listings
13.4% of total
7-29 Nights
75 listings
8.2% of total
30+ Nights
538 listings
58.5% of total
Key Insights
- The most prevalent minimum stay requirement in Mimizan is 30+ Nights, adopted by 58.5% of listings. This highlights the market's preference for longer commitments.
- Very short stays (1-2 nights) are less common (15.8%), suggesting hosts prefer slightly longer bookings to optimize turnover.
- A significant segment (58.5%) caters to monthly stays (30+ nights) in Mimizan, pointing to opportunities in the extended-stay market.
Recommendations
- Align with the market by considering a 30+ Nights minimum stay, as 58.5% of Mimizan hosts use this setting.
- If feasible, allowing 1-night stays, especially midweek or during low season, could capture last-minute bookings, as only 8% currently do.
- Explore offering discounts for stays of 30+ nights to attract the 58.5% of the market seeking extended stays.
- Adjust minimum nights based on seasonality – potentially shorter during low season and longer during peak demand periods in Mimizan.
Mimizan Airbnb Cancellation Policy Trends Analysis (2026)
Super Strict 30 Days
10 listings
1.1% of total
Limited
4 listings
0.4% of total
Super Strict 60 Days
36 listings
3.9% of total
Flexible
101 listings
11% of total
Moderate
172 listings
18.7% of total
Firm
451 listings
49.1% of total
Strict
144 listings
15.7% of total
Cancellation Policy Insights for Mimizan
- The prevailing Airbnb cancellation policy trend in Mimizan is Firm, used by 49.1% of listings.
- A majority (64.8%) of hosts in Mimizan utilize Firm or Strict policies, indicating a market where hosts prioritize booking security.
Recommendations for Hosts
- Consider adopting a Firm policy to align with the 49.1% market standard in Mimizan.
- Regularly review your cancellation policy against competitors and market demand shifts in Mimizan.
Mimizan STR Booking Lead Time Analysis (2026)
Average Booking Lead Time by Month
Booking Lead Time Insights for Mimizan
- The overall average booking lead time for vacation rentals in Mimizan is 62 days.
- Guests book furthest in advance for stays during August (average 117 days), likely coinciding with peak travel demand or local events.
- The shortest booking windows occur for stays in January (average 21 days), indicating more last-minute travel plans during this time.
- Seasonally, Summer (89 days avg.) sees the longest lead times, while Winter (27 days avg.) has the shortest, reflecting typical travel planning cycles.
Recommendations for Hosts
- Use the overall average lead time (62 days) as a baseline for your pricing and availability strategy in Mimizan.
- For August stays, consider implementing length-of-stay discounts or slightly higher rates for bookings made less than 117 days out to capitalize on advance planning.
- Target marketing efforts for the Summer season well in advance (at least 89 days) to capture early planners.
- Monitor your own booking lead times against these Mimizan averages to identify opportunities for dynamic pricing adjustments.
Popular & Essential Airbnb Amenities in Mimizan (2026)
Amenity Prevalence
Amenity Insights for Mimizan
- Popular amenities like TV, Kitchen, Hot water are common but not universal. Offering these can provide a competitive edge.
Recommendations for Hosts
- Consider adding popular differentiators like TV or Kitchen to increase appeal.
- Highlight unique or less common amenities you offer (e.g., hot tub, dedicated workspace, EV charger) in your listing description and photos.
- Regularly check competitor amenities in Mimizan to stay competitive.
Mimizan Airbnb Guest Demographics & Profile Analysis (2026)
Guest Profile Summary for Mimizan
- The typical guest profile for Airbnb in Mimizan consists of primarily domestic travelers (81%), often arriving from nearby Bordeaux, typically belonging to the Post-2000s (Gen Z/Alpha) group (50%), primarily speaking French or English.
- Domestic travelers account for 81.4% of guests.
- Key international markets include France (81.4%) and Germany (6.7%).
- Top languages spoken are French (40.3%) followed by English (32.7%).
- A significant demographic segment is the Post-2000s (Gen Z/Alpha) group, representing 50% of guests.
Recommendations for Hosts
- Target domestic marketing efforts towards travelers from Bordeaux and Paris.
- Tailor amenities and listing descriptions to appeal to the dominant Post-2000s (Gen Z/Alpha) demographic (e.g., highlight fast WiFi, smart home features, local guides).
- Highlight unique local experiences or amenities relevant to the primary guest profile.
- Consider seasonal promotions aligned with peak travel times for key origin markets.
Nearby Short-Term Rental Market Comparison
How does the Mimizan Airbnb market stack up against its neighbors? Compare key performance metrics like average monthly revenue, ADR, and occupancy rates in surrounding areas to understand the broader regional STR landscape.
| Market | Active Properties | Monthly Revenue | Daily Rate | Avg. Occupancy |
|---|---|---|---|---|
| San Sebastián | 1,382 | $3,844 | $287.28 | 49% |
| Dima | 11 | $3,301 | $331.95 | 52% |
| Carignan-de-Bordeaux | 34 | $3,140 | $316.66 | 42% |
| Néac | 11 | $3,047 | $441.32 | 38% |
| Lasarte-Oria | 19 | $2,656 | $197.35 | 43% |
| Gautegiz Arteaga | 15 | $2,600 | $312.72 | 35% |
| Gatika | 10 | $2,596 | $437.05 | 33% |
| Cénac | 17 | $2,542 | $307.76 | 44% |
| Saint-Seurin-de-Cadourne | 12 | $2,529 | $378.76 | 33% |
| Saint-Laurent-de-Gosse | 17 | $2,519 | $345.09 | 35% |