Limoges Airbnb Market Analysis 2026: Short Term Rental Data & Vacation Rental Statistics in Nouvelle-Aquitaine, France
Is Airbnb profitable in Limoges in 2026? Explore comprehensive Airbnb analytics for Limoges, Nouvelle-Aquitaine, France to uncover income potential. This 2026 STR market report for Limoges, based on AirROI data from February 2025 to January 2026, reveals key trends in the market of 611 active listings.
Whether you're considering an Airbnb investment in Limoges, optimizing your existing vacation rental, or exploring rental arbitrage opportunities, understanding the Limoges Airbnb data is crucial. Leveraging the low regulation environment is key to maximizing your short term rental income potential. Let's dive into the specifics.
Key Limoges Airbnb Performance Metrics Overview
Monthly Airbnb Revenue Variations & Income Potential in Limoges (2026)
Understanding the monthly revenue variations for Airbnb listings in Limoges is key to maximizing your short term rental income potential. Seasonality significantly impacts earnings. Our analysis, based on data from the past 12 months, shows that the peak revenue month for STRs in Limoges is typically August, while January often presents the lowest earnings, highlighting opportunities for strategic pricing adjustments during shoulder and low seasons. Explore the typical Airbnb income in Limoges across different performance tiers:
- Best-in-class properties (Top 10%) achieve $1,789+ monthly, often utilizing dynamic pricing and superior guest experiences.
- Strong performing properties (Top 25%) earn $1,247 or more, indicating effective management and desirable locations/amenities.
- Typical properties (Median) generate around $805 per month, representing the average market performance.
- Entry-level properties (Bottom 25%) see earnings around $433, often with potential for optimization.
Average Monthly Airbnb Earnings Trend in Limoges
Limoges Airbnb Occupancy Rate Trends (2026)
Maximize your bookings by understanding the Limoges STR occupancy trends. Seasonal demand shifts significantly influence how often properties are booked. Typically, Aprilsees the highest demand (peak season occupancy), while January experiences the lowest (low season). Effective strategies, like adjusting minimum stays or offering promotions, can boost occupancy during slower periods. Here's how different property tiers perform in Limoges:
- Best-in-class properties (Top 10%) achieve 80%+ occupancy, indicating high desirability and potentially optimized availability.
- Strong performing properties (Top 25%) maintain 64% or higher occupancy, suggesting good market fit and guest satisfaction.
- Typical properties (Median) have an occupancy rate around 43%.
- Entry-level properties (Bottom 25%) average 22% occupancy, potentially facing higher vacancy.
Average Monthly Occupancy Rate Trend in Limoges
Average Daily Rate (ADR) Airbnb Trends in Limoges (2026)
Effective short term rental pricing strategy in Limoges involves understanding monthly ADR fluctuations. The Average Daily Rate (ADR) for Airbnb in Limoges typically peaks in December and dips lowest during April. Leveraging Airbnb dynamic pricing tools or strategies based on this seasonality can significantly boost revenue. Here's a look at the typical nightly rates achieved:
- Best-in-class properties (Top 10%) command rates of $120+ per night, often due to premium features or locations.
- Strong performing properties (Top 25%) achieve nightly rates of $81 or more.
- Typical properties (Median) charge around $59 per night.
- Entry-level properties (Bottom 25%) earn around $46 per night.
Average Daily Rate (ADR) Trend by Month in Limoges
Get Live Limoges Market Intelligence 👇

Explore Real-time Analytics
Airbnb Seasonality Analysis & Trends in Limoges (2026)
Peak Season (August, September, October)
- Revenue averages $1,111 per month
- Occupancy rates average 45.7%
- Daily rates average $79
Shoulder Season
- Revenue averages $1,008 per month
- Occupancy maintains around 45.0%
- Daily rates hold near $76
Low Season (January, February, May)
- Revenue drops to average $846 per month
- Occupancy decreases to average 40.8%
- Daily rates adjust to average $75
Seasonality Insights for Limoges
- The Airbnb seasonality in Limoges shows moderate seasonality with distinct peak and low periods. While the sections above show seasonal averages, it's also insightful to look at the extremes:
- During the high season, the absolute peak month showcases Limoges's highest earning potential, with monthly revenues capable of climbing to $1,159, occupancy reaching a high of 48.9%, and ADRs peaking at $80.
- Conversely, the slowest single month of the year, typically falling within the low season, marks the market's lowest point. In this month, revenue might dip to $738, occupancy could drop to 32.6%, and ADRs may adjust down to $71.
- Understanding both the seasonal averages and these monthly peaks and troughs in revenue, occupancy, and ADR is crucial for maximizing your Airbnb profit potential in Limoges.
Seasonal Strategies for Maximizing Profit
- Peak Season: Maximize revenue through premium pricing and potentially longer minimum stays. Ensure high availability.
- Low Season: Offer competitive pricing, special promotions (e.g., extended stay discounts), and flexible cancellation policies. Target off-season travelers like remote workers or budget-conscious guests.
- Shoulder Seasons: Implement dynamic pricing that balances peak and low rates. Target weekend travelers or specific events. Offer slightly more flexible terms than peak season.
- Regularly analyze your own performance against these Limoges seasonality benchmarks and adjust your pricing and availability strategy accordingly.
Best Areas for Airbnb Investment in Limoges (2026)
Exploring the top neighborhoods for short-term rentals in Limoges? This section highlights key areas, outlining why they are attractive for hosts and guests, along with notable local attractions. Consider these locations based on your target guest profile and investment strategy.
| Neighborhood / Area | Why Host Here? (Target Guests & Appeal) | Key Attractions & Landmarks |
|---|---|---|
| Cité de l'Image | A vibrant area known for its galleries and history of photography. This attracts art lovers and tourists interested in cultural experiences. | Cité de l'Image, Musée de la laiton, Café de l'Image, Église Saint-Michel, Bourbon Business Center |
| Centre-Ville | The historical city center with charming streets, shops, and cafés. Perfect for tourists wanting to explore Limoges' rich history and local cuisine. | Place de la République, Limoges Cathedral, Rue de la Boucherie, Église Saint-Pierre, Musée des Beaux-Arts |
| Les Halles | A bustling market area rich in local produce, food vendors, and restaurants. Ideal for food enthusiasts and those wanting an authentic local experience. | Les Halles Centrales, Restaurants of Limoges, Local markets, Food tours, Cooking classes |
| Parks and Gardens | Several beautiful parks and gardens, ideal for relaxation and outdoor activities. Great for families and visitors seeking leisure. | Jardin Botanique, Parc Victor-Guily, Parc de l'Auzette, Bois de la Bastide, Les promenades du Pont de l'Evêque |
| Limoges-Benedictins | Home to the stunning Limoges-Benedictins train station, this area has historical significance and architectural beauty, attracting many tourists. | Gare des Bénédictins, Palais des Congrès, Café des Arts, Cité des Métiers, Concert halls |
| Saint-Étienne | A residential area with a mix of local shops and community vibe, ideal for long-term stays and experiencing local life. | Église Saint-Étienne, Local bakeries, Parks, proximité des écoles, Cafés locaux |
| L'Aurence | A peaceful neighborhood offering scenic views and access to nature. Ideal for serenity seekers and those who enjoy outdoor recreation. | L'Aurence River, Hiking trails, Local parks, Picnic areas, Wooded areas |
| Cité des Porcherons | Known for its porcelain, this area attracts businesses and artists. It's perfect for visitors interested in the craft and local art. | Porcelain factories, Artisan workshops, Design shops, Local exhibitions, Cultural festivals |
Understanding Airbnb License Requirements & STR Laws in Limoges (2026)
While Limoges, Nouvelle-Aquitaine, France currently shows low STR regulations, specific Airbnb license requirements might still exist or change. Always verify the latest short term rental regulations and Airbnb license requirements directly with local government authorities for Limoges to ensure full compliance before hosting.
(Source: AirROI data, 2026, based on 6% licensed listings)
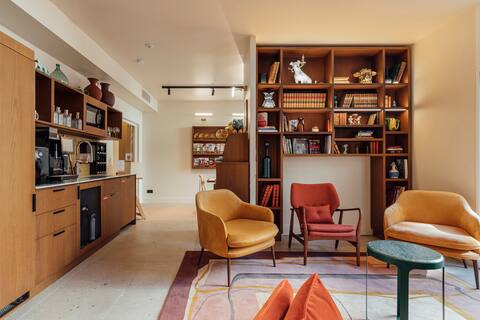
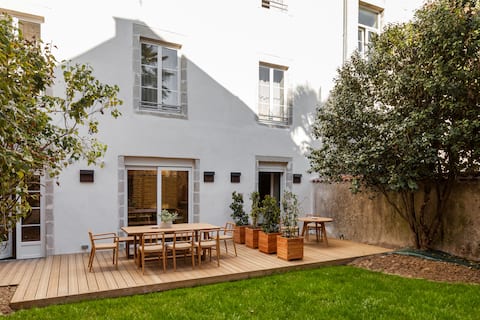
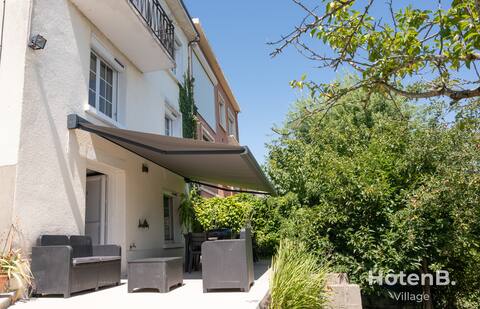
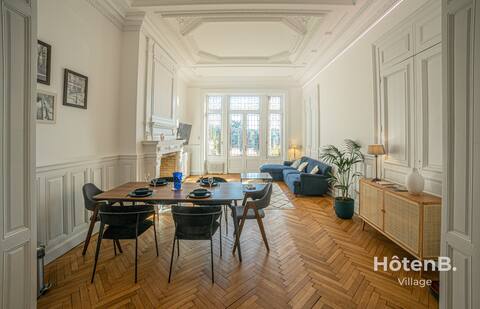
Top Performing Airbnb Properties in Limoges (2026)
Benchmark your potential! Explore examples of top-performing Airbnb properties in Limogesbased on Trailing Twelve Month (TTM) revenue. Analyze their characteristics, revenue, occupancy rate, and ADR to understand what drives success in this market.

House with 11 bedrooms
Entire Place • 11 bedrooms
13 bedroom house with full breakfast, right in the center
Entire Place • 13 bedrooms
Entire house 20 ch with PDJ near city center
Entire Place • 20 bedrooms
Large house close to city center Limoges
Entire Place • 6 bedrooms
The Heritage Heart of Limoges Parking Ac and
Entire Place • 1 bedroom
Apartment with 4 bedrooms and 4 bathrooms
Entire Place • 4 bedrooms
Note: Performance varies based on location, size, amenities, seasonality, and management quality. Data reflects the past 12 months.
Top Performing Airbnb Hosts in Limoges (2026)
Learn from the best! This table showcases top-performing Airbnb hosts in Limoges based on the number of properties managed and estimated total revenue over the past year. Analyze their scale and performance metrics.
| Host Name | Properties | Grossing Revenue | Stay Reviews | Avg Rating |
|---|---|---|---|---|
| Alphino | 58 | $450,726 | 1021 | 4.33/5.0 |
| Alexis | 16 | $357,448 | 399 | 4.74/5.0 |
| Hugo | 13 | $305,002 | 1422 | 4.81/5.0 |
| Maxime | 9 | $215,673 | 33 | 4.64/5.0 |
| Dabnb | 33 | $145,030 | 790 | 4.31/5.0 |
| Pierre | 13 | $104,223 | 1215 | 4.54/5.0 |
| Mickaël | 8 | $96,999 | 1825 | 4.96/5.0 |
| El Conseil | 4 | $92,934 | 148 | 4.85/5.0 |
| La Boite À Clefs | 12 | $70,461 | 434 | 4.49/5.0 |
| Nayer | 7 | $69,776 | 815 | 4.78/5.0 |
Analyzing the strategies of top hosts, such as their property selection, pricing, and guest communication, can offer valuable lessons for optimizing your own Airbnb operations in Limoges.
Dive Deeper: Advanced Limoges STR Market Data (2026)
Ready to unlock more insights? AirROI provides access to advanced metrics and comprehensive Airbnb data for Limoges. Explore detailed analytics beyond this report to refine your investment strategy, optimize pricing, and maximize your vacation rental profits.
Explore Advanced MetricsLimoges Short-Term Rental Market Composition (2026): Property & Room Types
Room Type Distribution
Property Type Distribution
Market Composition Insights for Limoges
- The Limoges Airbnb market composition is heavily skewed towards Entire Home/Apt listings, which make up 90.5% of the 611 active rentals. This indicates strong guest preference for privacy and space.
- Looking at the property type distribution in Limoges, Apartment/Condo properties are the most common (84.1%), reflecting the local real estate landscape.
- Smaller segments like hotel/boutique, others, unique stays (combined 1.7%) offer potential for unique stay experiences.
Limoges Airbnb Room Capacity Analysis (2026): Bedroom Distribution
Distribution of Listings by Number of Bedrooms
Room Capacity Insights for Limoges
- The dominant room capacity in Limoges is 1 bedroom listings, making up 53.7% of the market. This suggests a strong demand for properties suitable for couples or solo travelers.
- Together, 1 bedroom and 2 bedrooms properties represent 69.4% of the active Airbnb listings in Limoges, indicating a high concentration in these sizes.
- With over half the market (53.7%) consisting of studios or 1-bedroom units, Limoges is particularly well-suited for individuals or couples.
- Listings with 3+ bedrooms (9.3%) represent a smaller niche, potentially indicating an underserved market for larger group accommodations in Limoges.
Limoges Vacation Rental Guest Capacity Trends (2026)
Distribution of Listings by Guest Capacity
Guest Capacity Insights for Limoges
- The most common guest capacity trend in Limoges vacation rentals is listings accommodating 2 guests (39.9%). This suggests the primary traveler segment is likely couples or solo travelers.
- Properties designed for 2 guests and 4 guests dominate the Limoges STR market, accounting for 67.7% of listings.
- A significant 41.2% of listings cater specifically to 1-2 guests, highlighting strong demand from couples and solo travelers in Limoges.
- 13.6% of properties accommodate 6+ guests, serving the market segment for larger families or group travel in Limoges.
- On average, properties in Limoges are equipped to host 3.2 guests.
Limoges Airbnb Booking Patterns (2026): Available vs. Booked Days
Available Days Distribution
Booked Days Distribution
Booking Pattern Insights for Limoges
- The most common availability pattern in Limoges falls within the 271-366 days range, representing 41.7% of listings. This suggests many properties have significant open periods on their calendars.
- Approximately 73.3% of listings show high availability (181+ days open annually), indicating potential for increased bookings or specific owner usage patterns.
- For booked days, the 91-180 days range is most frequent in Limoges (32.2%), reflecting common guest stay durations or potential owner blocking patterns.
- A notable 28.7% of properties secure long booking periods (181+ days booked per year), highlighting successful long-term rental strategies or significant owner usage.
Limoges Airbnb Minimum Stay Requirements Analysis
Distribution of Listings by Minimum Night Requirement
1 Night
330 listings
54% of total
2 Nights
113 listings
18.5% of total
3 Nights
27 listings
4.4% of total
4-6 Nights
13 listings
2.1% of total
7-29 Nights
3 listings
0.5% of total
30+ Nights
125 listings
20.5% of total
Key Insights
- The most prevalent minimum stay requirement in Limoges is 1 Night, adopted by 54% of listings. This highlights the market's preference for shorter, flexible bookings.
- A strong majority (72.5%) of the Limoges Airbnb data shows acceptance of very short stays (1-2 nights), indicating a dynamic, high-turnover market.
- A significant segment (20.5%) caters to monthly stays (30+ nights) in Limoges, pointing to opportunities in the extended-stay market.
Recommendations
- Align with the market by considering a 1 Night minimum stay, as 54% of Limoges hosts use this setting.
- Explore offering discounts for stays of 30+ nights to attract the 20.5% of the market seeking extended stays.
- Adjust minimum nights based on seasonality – potentially shorter during low season and longer during peak demand periods in Limoges.
Limoges Airbnb Cancellation Policy Trends Analysis (2026)
Super Strict 60 Days
1 listings
0.2% of total
Limited
1 listings
0.2% of total
Flexible
266 listings
43.6% of total
Moderate
230 listings
37.7% of total
Firm
69 listings
11.3% of total
Strict
43 listings
7% of total
Cancellation Policy Insights for Limoges
- The prevailing Airbnb cancellation policy trend in Limoges is Flexible, used by 43.6% of listings.
- The market strongly favors guest-friendly terms, with 81.3% of listings offering Flexible or Moderate policies. This suggests guests in Limoges may expect booking flexibility.
- Strict cancellation policies are quite rare (7%), potentially making listings with this policy less competitive unless justified by high demand or property type.
Recommendations for Hosts
- Consider adopting a Flexible policy to align with the 43.6% market standard in Limoges.
- Using a Strict policy might deter some guests, as only 7% of listings use it. Evaluate if potential revenue protection outweighs possible lower booking rates.
- Regularly review your cancellation policy against competitors and market demand shifts in Limoges.
Limoges STR Booking Lead Time Analysis (2026)
Average Booking Lead Time by Month
Booking Lead Time Insights for Limoges
- The overall average booking lead time for vacation rentals in Limoges is 28 days.
- Guests book furthest in advance for stays during December (average 40 days), likely coinciding with peak travel demand or local events.
- The shortest booking windows occur for stays in February (average 19 days), indicating more last-minute travel plans during this time.
- Seasonally, Summer (33 days avg.) sees the longest lead times, while Fall (25 days avg.) has the shortest, reflecting typical travel planning cycles.
Recommendations for Hosts
- Use the overall average lead time (28 days) as a baseline for your pricing and availability strategy in Limoges.
- For December stays, consider implementing length-of-stay discounts or slightly higher rates for bookings made less than 40 days out to capitalize on advance planning.
- Target marketing efforts for the Summer season well in advance (at least 33 days) to capture early planners.
- Monitor your own booking lead times against these Limoges averages to identify opportunities for dynamic pricing adjustments.
Popular & Essential Airbnb Amenities in Limoges (2026)
Amenity Prevalence
Amenity Insights for Limoges
- Popular amenities like Kitchen, Heating, Wifi are common but not universal. Offering these can provide a competitive edge.
- Warning: Wifi is not universally provided but is considered essential globally. Ensure reliable Wifi is offered.
Recommendations for Hosts
- Consider adding popular differentiators like Kitchen or Heating to increase appeal.
- Highlight unique or less common amenities you offer (e.g., hot tub, dedicated workspace, EV charger) in your listing description and photos.
- Regularly check competitor amenities in Limoges to stay competitive.
Limoges Airbnb Guest Demographics & Profile Analysis (2026)
Guest Profile Summary for Limoges
- The typical guest profile for Airbnb in Limoges consists of primarily domestic travelers (86%), often arriving from nearby Paris, typically belonging to the Post-2000s (Gen Z/Alpha) group (50%), primarily speaking French or English.
- Domestic travelers account for 86.4% of guests.
- Key international markets include France (86.4%) and United Kingdom (4.3%).
- Top languages spoken are French (44%) followed by English (31.8%).
- A significant demographic segment is the Post-2000s (Gen Z/Alpha) group, representing 50% of guests.
Recommendations for Hosts
- Target domestic marketing efforts towards travelers from Paris and Limoges.
- Tailor amenities and listing descriptions to appeal to the dominant Post-2000s (Gen Z/Alpha) demographic (e.g., highlight fast WiFi, smart home features, local guides).
- Highlight unique local experiences or amenities relevant to the primary guest profile.
- Consider seasonal promotions aligned with peak travel times for key origin markets.
Nearby Short-Term Rental Market Comparison
How does the Limoges Airbnb market stack up against its neighbors? Compare key performance metrics like average monthly revenue, ADR, and occupancy rates in surrounding areas to understand the broader regional STR landscape.
| Market | Active Properties | Monthly Revenue | Daily Rate | Avg. Occupancy |
|---|---|---|---|---|
| Bourrou | 10 | $2,788 | $294.83 | 35% |
| Eynesse | 13 | $2,664 | $331.30 | 37% |
| Chaunay | 10 | $2,409 | $178.56 | 41% |
| La Dornac | 10 | $2,407 | $288.14 | 32% |
| Milhac-de-Nontron | 10 | $2,394 | $254.42 | 43% |
| Saint-Pierre-Roche | 13 | $2,307 | $184.10 | 45% |
| Astaffort | 14 | $2,261 | $331.71 | 28% |
| Grignols | 15 | $2,185 | $313.09 | 39% |
| La Roque-Gageac | 41 | $2,103 | $197.21 | 49% |
| Antonne-et-Trigonant | 10 | $2,101 | $275.48 | 37% |