Floirac Airbnb Market Analysis 2026: Short Term Rental Data & Vacation Rental Statistics in Nouvelle-Aquitaine, France
Is Airbnb profitable in Floirac in 2026? Explore comprehensive Airbnb analytics for Floirac, Nouvelle-Aquitaine, France to uncover income potential. This 2026 STR market report for Floirac, based on AirROI data from February 2025 to January 2026, reveals key trends in the niche market of 107 active listings.
Whether you're considering an Airbnb investment in Floirac, optimizing your existing vacation rental, or exploring rental arbitrage opportunities, understanding the Floirac Airbnb data is crucial. Leveraging the low regulation environment is key to maximizing your short term rental income potential. Let's dive into the specifics.
Key Floirac Airbnb Performance Metrics Overview
Monthly Airbnb Revenue Variations & Income Potential in Floirac (2026)
Understanding the monthly revenue variations for Airbnb listings in Floirac is key to maximizing your short term rental income potential. Seasonality significantly impacts earnings. Our analysis, based on data from the past 12 months, shows that the peak revenue month for STRs in Floirac is typically August, while January often presents the lowest earnings, highlighting opportunities for strategic pricing adjustments during shoulder and low seasons. Explore the typical Airbnb income in Floirac across different performance tiers:
- Best-in-class properties (Top 10%) achieve $3,050+ monthly, often utilizing dynamic pricing and superior guest experiences.
- Strong performing properties (Top 25%) earn $1,908 or more, indicating effective management and desirable locations/amenities.
- Typical properties (Median) generate around $1,208 per month, representing the average market performance.
- Entry-level properties (Bottom 25%) see earnings around $682, often with potential for optimization.
Average Monthly Airbnb Earnings Trend in Floirac
Floirac Airbnb Occupancy Rate Trends (2026)
Maximize your bookings by understanding the Floirac STR occupancy trends. Seasonal demand shifts significantly influence how often properties are booked. Typically, Augustsees the highest demand (peak season occupancy), while January experiences the lowest (low season). Effective strategies, like adjusting minimum stays or offering promotions, can boost occupancy during slower periods. Here's how different property tiers perform in Floirac:
- Best-in-class properties (Top 10%) achieve 84%+ occupancy, indicating high desirability and potentially optimized availability.
- Strong performing properties (Top 25%) maintain 70% or higher occupancy, suggesting good market fit and guest satisfaction.
- Typical properties (Median) have an occupancy rate around 46%.
- Entry-level properties (Bottom 25%) average 24% occupancy, potentially facing higher vacancy.
Average Monthly Occupancy Rate Trend in Floirac
Average Daily Rate (ADR) Airbnb Trends in Floirac (2026)
Effective short term rental pricing strategy in Floirac involves understanding monthly ADR fluctuations. The Average Daily Rate (ADR) for Airbnb in Floirac typically peaks in September and dips lowest during March. Leveraging Airbnb dynamic pricing tools or strategies based on this seasonality can significantly boost revenue. Here's a look at the typical nightly rates achieved:
- Best-in-class properties (Top 10%) command rates of $180+ per night, often due to premium features or locations.
- Strong performing properties (Top 25%) achieve nightly rates of $135 or more.
- Typical properties (Median) charge around $88 per night.
- Entry-level properties (Bottom 25%) earn around $61 per night.
Average Daily Rate (ADR) Trend by Month in Floirac
Get Live Floirac Market Intelligence 👇

Explore Real-time Analytics
Airbnb Seasonality Analysis & Trends in Floirac (2026)
Peak Season (August, July, June)
- Revenue averages $2,279 per month
- Occupancy rates average 53.0%
- Daily rates average $120
Shoulder Season
- Revenue averages $1,551 per month
- Occupancy maintains around 47.7%
- Daily rates hold near $117
Low Season (January, March, November)
- Revenue drops to average $1,108 per month
- Occupancy decreases to average 39.4%
- Daily rates adjust to average $116
Seasonality Insights for Floirac
- The Airbnb seasonality in Floirac shows highly seasonal trends requiring careful strategy. While the sections above show seasonal averages, it's also insightful to look at the extremes:
- During the high season, the absolute peak month showcases Floirac's highest earning potential, with monthly revenues capable of climbing to $2,521, occupancy reaching a high of 59.3%, and ADRs peaking at $124.
- Conversely, the slowest single month of the year, typically falling within the low season, marks the market's lowest point. In this month, revenue might dip to $992, occupancy could drop to 33.3%, and ADRs may adjust down to $111.
- Understanding both the seasonal averages and these monthly peaks and troughs in revenue, occupancy, and ADR is crucial for maximizing your Airbnb profit potential in Floirac.
Seasonal Strategies for Maximizing Profit
- Peak Season: Maximize revenue through premium pricing and potentially longer minimum stays. Ensure high availability.
- Low Season: Offer competitive pricing, special promotions (e.g., extended stay discounts), and flexible cancellation policies. Target off-season travelers like remote workers or budget-conscious guests.
- Shoulder Seasons: Implement dynamic pricing that balances peak and low rates. Target weekend travelers or specific events. Offer slightly more flexible terms than peak season.
- Regularly analyze your own performance against these Floirac seasonality benchmarks and adjust your pricing and availability strategy accordingly.
Best Areas for Airbnb Investment in Floirac (2026)
Exploring the top neighborhoods for short-term rentals in Floirac? This section highlights key areas, outlining why they are attractive for hosts and guests, along with notable local attractions. Consider these locations based on your target guest profile and investment strategy.
| Neighborhood / Area | Why Host Here? (Target Guests & Appeal) | Key Attractions & Landmarks |
|---|---|---|
| Bordeaux City Center | Vibrant heart of Bordeaux known for its historic architecture, shopping, and dining scene. Attracts tourists looking to explore the rich cultural heritage and wine offerings of the region. | Place de la Bourse, La Cité du Vin, Bordeaux National Opera, Rue Sainte-Catherine, Jardin Public |
| La Bastide | Up-and-coming neighborhood across the river from the city center with a mix of modern and historic charm. Offers beautiful waterfront views and parks, appealing to families and young travelers. | Parc aux Angéliques, Pont de Pierre, Botanical Garden, Rue de la Benauge, local cafes |
| Pessac | Family-friendly suburb with a relaxed atmosphere and proximity to vineyards. Attractive to visitors seeking a quieter stay while still close to Bordeaux. | Château Pape Clément, Parc Bordelais, Pessac Market, local wineries, Café du Teich |
| Martignas-sur-Jalle | Charming residential area ideal for nature lovers, featuring parks and green spaces. Great for visitors seeking outdoor activities and a peaceful environment. | Parc de la Jalle, local cycling paths, hiking trails, community events, nature parks |
| Lormont | Affordable neighborhood with emerging potential as a tourist destination. Provides access to scenic riverside parks and local culture, appealing to budget travelers. | Parc Montalivet, Rive Droite, Café des Arts, local art studios, viewing points of Bordeaux |
| Eysines | Suburban area known for its tranquility and family-oriented atmosphere. Close to Bordeaux, making it a convenient base for travelers while enjoying a quieter setting. | Parc de l'Ermitage, Château du Prince Noir, local markets, natural reserves, community parks |
| Bordeaux Maritime | A port area experiencing revitalization with modern apartments and waterfront access, perfect for those seeking a contemporary city experience with leisure activities. | Les Bassins à Flot, Cité numérique, waterfront walks, nearby restaurants, local arts events |
| Gradignan | Picturesque suburb known for its parks and green spaces, offering a perfect blend of tranquility and easy access to the vibrancy of Bordeaux. Great for travelers seeking relaxation after exploring the city. | Parc Bordelais, Château de Thouars, nature walks, local wine shops, community events |
Understanding Airbnb License Requirements & STR Laws in Floirac (2026)
While Floirac, Nouvelle-Aquitaine, France currently shows low STR regulations, specific Airbnb license requirements might still exist or change. Always verify the latest short term rental regulations and Airbnb license requirements directly with local government authorities for Floirac to ensure full compliance before hosting.
(Source: AirROI data, 2026, based on 7% licensed listings)
Top Performing Airbnb Properties in Floirac (2026)
Benchmark your potential! Explore examples of top-performing Airbnb properties in Floiracbased on Trailing Twelve Month (TTM) revenue. Analyze their characteristics, revenue, occupancy rate, and ADR to understand what drives success in this market.

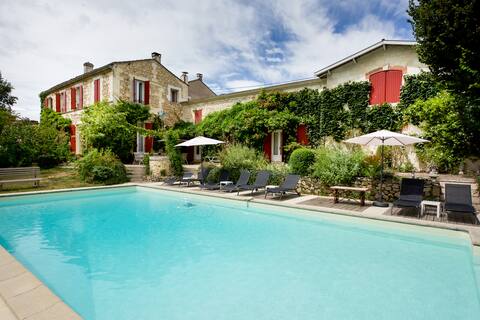
Master house with pool and tennis
Entire Place • 6 bedrooms
Domaine Fonteneau 10 minutes from Bordeaux
Entire Place • 7 bedrooms

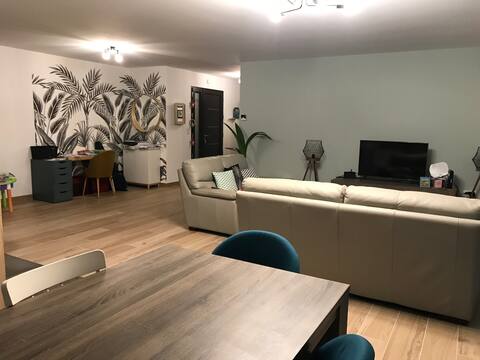
Contemporary house with pool near Bx
Entire Place • 5 bedrooms
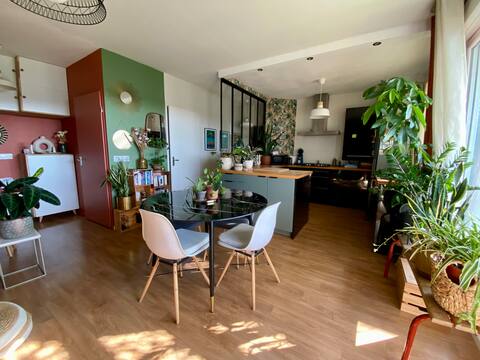
2 bedroom accommodation in Floirac-Arkéa Arena Bordeaux
Entire Place • 2 bedrooms
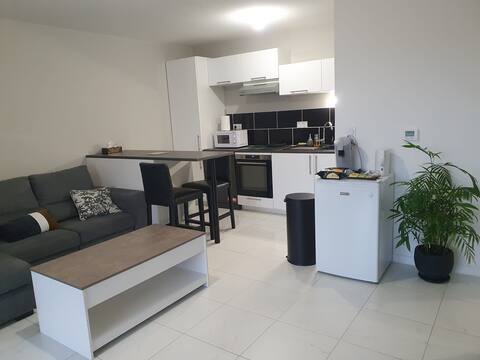
Nice apartment with a terrace.
Entire Place • 2 bedrooms
Modern house in Haut-Floirac near Bordeaux
Entire Place • 4 bedrooms
Note: Performance varies based on location, size, amenities, seasonality, and management quality. Data reflects the past 12 months.
Top Performing Airbnb Hosts in Floirac (2026)
Learn from the best! This table showcases top-performing Airbnb hosts in Floirac based on the number of properties managed and estimated total revenue over the past year. Analyze their scale and performance metrics.
| Host Name | Properties | Grossing Revenue | Stay Reviews | Avg Rating |
|---|---|---|---|---|
| Farid | 1 | $126,419 | 11 | 5.00/5.0 |
| Alain - Didier | 2 | $80,088 | 140 | 4.72/5.0 |
| Alexandre | 4 | $67,015 | 2927 | 4.78/5.0 |
| Emilie | 1 | $53,881 | 22 | 4.82/5.0 |
| Menuet | 1 | $40,075 | 28 | 5.00/5.0 |
| Yoann | 2 | $39,894 | 17 | 4.75/5.0 |
| Thomas | 2 | $37,794 | 1005 | 4.84/5.0 |
| Lysiane | 1 | $36,375 | 23 | 5.00/5.0 |
| Leonard | 1 | $35,407 | 35 | 4.94/5.0 |
| Damien | 1 | $34,893 | 34 | 4.94/5.0 |
Analyzing the strategies of top hosts, such as their property selection, pricing, and guest communication, can offer valuable lessons for optimizing your own Airbnb operations in Floirac.
Dive Deeper: Advanced Floirac STR Market Data (2026)
Ready to unlock more insights? AirROI provides access to advanced metrics and comprehensive Airbnb data for Floirac. Explore detailed analytics beyond this report to refine your investment strategy, optimize pricing, and maximize your vacation rental profits.
Explore Advanced MetricsFloirac Short-Term Rental Market Composition (2026): Property & Room Types
Room Type Distribution
Property Type Distribution
Market Composition Insights for Floirac
- The Floirac Airbnb market composition is heavily skewed towards Entire Home/Apt listings, which make up 80.4% of the 107 active rentals. This indicates strong guest preference for privacy and space.
- Looking at the property type distribution in Floirac, House properties are the most common (51.4%), reflecting the local real estate landscape.
- Houses represent a significant 51.4% portion, catering likely to families or larger groups.
- The presence of 7.5% Hotel/Boutique listings indicates integration with traditional hospitality.
- Smaller segments like others, unique stays (combined 3.7%) offer potential for unique stay experiences.
Floirac Airbnb Room Capacity Analysis (2026): Bedroom Distribution
Distribution of Listings by Number of Bedrooms
Room Capacity Insights for Floirac
- The dominant room capacity in Floirac is 1 bedroom listings, making up 30.8% of the market. This suggests a strong demand for properties suitable for couples or solo travelers.
- Together, 1 bedroom and 2 bedrooms properties represent 59.8% of the active Airbnb listings in Floirac, indicating a high concentration in these sizes.
Floirac Vacation Rental Guest Capacity Trends (2026)
Distribution of Listings by Guest Capacity
Guest Capacity Insights for Floirac
- The most common guest capacity trend in Floirac vacation rentals is listings accommodating 2 guests (24.3%). This suggests the primary traveler segment is likely couples or solo travelers.
- Properties designed for 2 guests and 4 guests dominate the Floirac STR market, accounting for 46.7% of listings.
- 21.5% of properties accommodate 6+ guests, serving the market segment for larger families or group travel in Floirac.
- On average, properties in Floirac are equipped to host 3.4 guests.
Floirac Airbnb Booking Patterns (2026): Available vs. Booked Days
Available Days Distribution
Booked Days Distribution
Booking Pattern Insights for Floirac
- The most common availability pattern in Floirac falls within the 271-366 days range, representing 47.7% of listings. This suggests many properties have significant open periods on their calendars.
- Approximately 77.6% of listings show high availability (181+ days open annually), indicating potential for increased bookings or specific owner usage patterns.
- For booked days, the 91-180 days range is most frequent in Floirac (29%), reflecting common guest stay durations or potential owner blocking patterns.
- A notable 23.3% of properties secure long booking periods (181+ days booked per year), highlighting successful long-term rental strategies or significant owner usage.
Floirac Airbnb Minimum Stay Requirements Analysis
Distribution of Listings by Minimum Night Requirement
1 Night
44 listings
41.1% of total
2 Nights
15 listings
14% of total
3 Nights
7 listings
6.5% of total
4-6 Nights
9 listings
8.4% of total
7-29 Nights
4 listings
3.7% of total
30+ Nights
28 listings
26.2% of total
Key Insights
- The most prevalent minimum stay requirement in Floirac is 1 Night, adopted by 41.1% of listings. This highlights the market's preference for shorter, flexible bookings.
- A significant segment (26.2%) caters to monthly stays (30+ nights) in Floirac, pointing to opportunities in the extended-stay market.
Recommendations
- Align with the market by considering a 1 Night minimum stay, as 41.1% of Floirac hosts use this setting.
- Explore offering discounts for stays of 30+ nights to attract the 26.2% of the market seeking extended stays.
- Adjust minimum nights based on seasonality – potentially shorter during low season and longer during peak demand periods in Floirac.
Floirac Airbnb Cancellation Policy Trends Analysis (2026)
Limited
1 listings
0.9% of total
Flexible
32 listings
29.9% of total
Moderate
42 listings
39.3% of total
Firm
28 listings
26.2% of total
Strict
4 listings
3.7% of total
Cancellation Policy Insights for Floirac
- The prevailing Airbnb cancellation policy trend in Floirac is Moderate, used by 39.3% of listings.
- There's a relatively balanced mix between guest-friendly (69.2%) and stricter (29.9%) policies, offering choices for different guest needs.
- Strict cancellation policies are quite rare (3.7%), potentially making listings with this policy less competitive unless justified by high demand or property type.
Recommendations for Hosts
- Consider adopting a Moderate policy to align with the 39.3% market standard in Floirac.
- Using a Strict policy might deter some guests, as only 3.7% of listings use it. Evaluate if potential revenue protection outweighs possible lower booking rates.
- Regularly review your cancellation policy against competitors and market demand shifts in Floirac.
Floirac STR Booking Lead Time Analysis (2026)
Average Booking Lead Time by Month
Booking Lead Time Insights for Floirac
- The overall average booking lead time for vacation rentals in Floirac is 51 days.
- Guests book furthest in advance for stays during August (average 60 days), likely coinciding with peak travel demand or local events.
- The shortest booking windows occur for stays in February (average 25 days), indicating more last-minute travel plans during this time.
- Seasonally, Spring (52 days avg.) sees the longest lead times, while Winter (34 days avg.) has the shortest, reflecting typical travel planning cycles.
Recommendations for Hosts
- Use the overall average lead time (51 days) as a baseline for your pricing and availability strategy in Floirac.
- Target marketing efforts for the Spring season well in advance (at least 52 days) to capture early planners.
- Monitor your own booking lead times against these Floirac averages to identify opportunities for dynamic pricing adjustments.
Popular & Essential Airbnb Amenities in Floirac (2026)
Amenity Prevalence
Amenity Insights for Floirac
- Popular amenities like Wifi, Hot water, Kitchen are common but not universal. Offering these can provide a competitive edge.
- Warning: Wifi is not universally provided but is considered essential globally. Ensure reliable Wifi is offered.
Recommendations for Hosts
- Consider adding popular differentiators like Wifi or Hot water to increase appeal.
- Highlight unique or less common amenities you offer (e.g., hot tub, dedicated workspace, EV charger) in your listing description and photos.
- Regularly check competitor amenities in Floirac to stay competitive.
Floirac Airbnb Guest Demographics & Profile Analysis (2026)
Guest Profile Summary for Floirac
- The typical guest profile for Airbnb in Floirac consists of primarily domestic travelers (81%), often arriving from nearby Paris, typically belonging to the Post-2000s (Gen Z/Alpha) group (50%), primarily speaking French or English.
- Domestic travelers account for 81.4% of guests.
- Key international markets include France (81.4%) and United Kingdom (4.3%).
- Top languages spoken are French (43.7%) followed by English (32.2%).
- A significant demographic segment is the Post-2000s (Gen Z/Alpha) group, representing 50% of guests.
Recommendations for Hosts
- Target domestic marketing efforts towards travelers from Paris and Toulouse.
- Tailor amenities and listing descriptions to appeal to the dominant Post-2000s (Gen Z/Alpha) demographic (e.g., highlight fast WiFi, smart home features, local guides).
- Highlight unique local experiences or amenities relevant to the primary guest profile.
- Consider seasonal promotions aligned with peak travel times for key origin markets.
Nearby Short-Term Rental Market Comparison
How does the Floirac Airbnb market stack up against its neighbors? Compare key performance metrics like average monthly revenue, ADR, and occupancy rates in surrounding areas to understand the broader regional STR landscape.
| Market | Active Properties | Monthly Revenue | Daily Rate | Avg. Occupancy |
|---|---|---|---|---|
| San Sebastián | 1,382 | $3,844 | $287.28 | 49% |
| Carignan-de-Bordeaux | 34 | $3,140 | $316.66 | 42% |
| Néac | 11 | $3,047 | $441.32 | 38% |
| Bourrou | 10 | $2,788 | $294.83 | 35% |
| Eynesse | 13 | $2,664 | $331.30 | 37% |
| Cénac | 17 | $2,542 | $307.76 | 44% |
| Saint-Seurin-de-Cadourne | 12 | $2,529 | $378.76 | 33% |
| Saint-Laurent-de-Gosse | 17 | $2,519 | $345.09 | 35% |
| Milhac-de-Nontron | 10 | $2,394 | $254.42 | 43% |
| Beautiran | 10 | $2,388 | $244.69 | 35% |