Carcans Airbnb Market Analysis 2026: Short Term Rental Data & Vacation Rental Statistics in Nouvelle-Aquitaine, France
Is Airbnb profitable in Carcans in 2026? Explore comprehensive Airbnb analytics for Carcans, Nouvelle-Aquitaine, France to uncover income potential. This 2026 STR market report for Carcans, based on AirROI data from February 2025 to January 2026, reveals key trends in the market of 383 active listings.
Whether you're considering an Airbnb investment in Carcans, optimizing your existing vacation rental, or exploring rental arbitrage opportunities, understanding the Carcans Airbnb data is crucial. Leveraging the low regulation environment is key to maximizing your short term rental income potential. Let's dive into the specifics.
Key Carcans Airbnb Performance Metrics Overview
Monthly Airbnb Revenue Variations & Income Potential in Carcans (2026)
Understanding the monthly revenue variations for Airbnb listings in Carcans is key to maximizing your short term rental income potential. Seasonality significantly impacts earnings. Our analysis, based on data from the past 12 months, shows that the peak revenue month for STRs in Carcans is typically August, while November often presents the lowest earnings, highlighting opportunities for strategic pricing adjustments during shoulder and low seasons. Explore the typical Airbnb income in Carcans across different performance tiers:
- Best-in-class properties (Top 10%) achieve $2,992+ monthly, often utilizing dynamic pricing and superior guest experiences.
- Strong performing properties (Top 25%) earn $1,832 or more, indicating effective management and desirable locations/amenities.
- Typical properties (Median) generate around $1,047 per month, representing the average market performance.
- Entry-level properties (Bottom 25%) see earnings around $551, often with potential for optimization.
Average Monthly Airbnb Earnings Trend in Carcans
Carcans Airbnb Occupancy Rate Trends (2026)
Maximize your bookings by understanding the Carcans STR occupancy trends. Seasonal demand shifts significantly influence how often properties are booked. Typically, Augustsees the highest demand (peak season occupancy), while January experiences the lowest (low season). Effective strategies, like adjusting minimum stays or offering promotions, can boost occupancy during slower periods. Here's how different property tiers perform in Carcans:
- Best-in-class properties (Top 10%) achieve 65%+ occupancy, indicating high desirability and potentially optimized availability.
- Strong performing properties (Top 25%) maintain 45% or higher occupancy, suggesting good market fit and guest satisfaction.
- Typical properties (Median) have an occupancy rate around 28%.
- Entry-level properties (Bottom 25%) average 14% occupancy, potentially facing higher vacancy.
Average Monthly Occupancy Rate Trend in Carcans
Average Daily Rate (ADR) Airbnb Trends in Carcans (2026)
Effective short term rental pricing strategy in Carcans involves understanding monthly ADR fluctuations. The Average Daily Rate (ADR) for Airbnb in Carcans typically peaks in August and dips lowest during March. Leveraging Airbnb dynamic pricing tools or strategies based on this seasonality can significantly boost revenue. Here's a look at the typical nightly rates achieved:
- Best-in-class properties (Top 10%) command rates of $273+ per night, often due to premium features or locations.
- Strong performing properties (Top 25%) achieve nightly rates of $182 or more.
- Typical properties (Median) charge around $120 per night.
- Entry-level properties (Bottom 25%) earn around $85 per night.
Average Daily Rate (ADR) Trend by Month in Carcans
Get Live Carcans Market Intelligence 👇

Explore Real-time Analytics
Airbnb Seasonality Analysis & Trends in Carcans (2026)
Peak Season (August, July, September)
- Revenue averages $2,724 per month
- Occupancy rates average 53.0%
- Daily rates average $160
Shoulder Season
- Revenue averages $1,140 per month
- Occupancy maintains around 29.0%
- Daily rates hold near $145
Low Season (January, November, December)
- Revenue drops to average $773 per month
- Occupancy decreases to average 19.1%
- Daily rates adjust to average $145
Seasonality Insights for Carcans
- The Airbnb seasonality in Carcans shows highly seasonal trends requiring careful strategy. While the sections above show seasonal averages, it's also insightful to look at the extremes:
- During the high season, the absolute peak month showcases Carcans's highest earning potential, with monthly revenues capable of climbing to $3,703, occupancy reaching a high of 67.0%, and ADRs peaking at $165.
- Conversely, the slowest single month of the year, typically falling within the low season, marks the market's lowest point. In this month, revenue might dip to $747, occupancy could drop to 17.5%, and ADRs may adjust down to $140.
- Understanding both the seasonal averages and these monthly peaks and troughs in revenue, occupancy, and ADR is crucial for maximizing your Airbnb profit potential in Carcans.
Seasonal Strategies for Maximizing Profit
- Peak Season: Maximize revenue through premium pricing and potentially longer minimum stays. Ensure high availability.
- Low Season: Offer competitive pricing, special promotions (e.g., extended stay discounts), and flexible cancellation policies. Target off-season travelers like remote workers or budget-conscious guests.
- Shoulder Seasons: Implement dynamic pricing that balances peak and low rates. Target weekend travelers or specific events. Offer slightly more flexible terms than peak season.
- Regularly analyze your own performance against these Carcans seasonality benchmarks and adjust your pricing and availability strategy accordingly.
Best Areas for Airbnb Investment in Carcans (2026)
Exploring the top neighborhoods for short-term rentals in Carcans? This section highlights key areas, outlining why they are attractive for hosts and guests, along with notable local attractions. Consider these locations based on your target guest profile and investment strategy.
| Neighborhood / Area | Why Host Here? (Target Guests & Appeal) | Key Attractions & Landmarks |
|---|---|---|
| Lac de Carcans | A stunning freshwater lake popular for its beach, water activities, and proximity to pine forests. An ideal spot for families and nature lovers looking for outdoor experiences. | Plage de Maubuisson, Cercle Nautique de Carcans, Cycle paths around the lake, Outdoor sports activities, Natural reserve of the Cousseau |
| Carcans Plage | A beautiful coastal area known for its sandy beaches and surfing spots. It attracts tourists looking for a beach holiday with easy access to local amenities. | Carcans Plage beach, Surf schools, Beachside restaurants, Camping spots, Water sports rentals |
| L’Étang de Cousseau | A protected area with rich biodiversity, perfect for eco-tourism and nature lovers. It offers serene landscapes and opportunities for birdwatching and hiking. | Canoeing, Hiking trails, Birdwatching, Wildlife observatories, Nature tours |
| Bourg de Carcans | The charming village center offers local shops, cafes, and a traditional French atmosphere. It attracts tourists interested in local culture and cuisine. | Local markets, Historic architecture, Cafes, Artisan shops, Village festivals |
| Montalivet | A neighboring seaside resort known for its lively atmosphere and surf culture. It’s popular among younger crowds looking for nightlife and beach fun. | Montalivet beach, Nightclubs and bars, La Fête de la Mère, Surf competitions, Beach markets |
| Hourtin | A nearby town that offers a mix of lakeside and beach experiences, ideal for visitors looking for both relaxation and recreation. | Hourtin Lake, Plage d'Hourtin, Wine tasting tours, Cycling paths, Cultural heritage sites |
| Soulac-sur-Mer | A classic French beach town with a vintage feel, known for its beautiful beaches and family-friendly atmosphere. Great for beach vacations with activities for all ages. | Soulac Beach, Historic villas, Local seafood restaurants, Cultural festivals, Cycling routes |
| Cap Ferret | A bit farther away, but famous for its beautiful landscapes and seafood. A perfect escape for those seeking a more upscale and tranquil beach holiday. | Dune du Pilat, Cap Ferret lighthouse, Local seafood markets, Biking through nature trails, Picturesque villages |
Understanding Airbnb License Requirements & STR Laws in Carcans (2026)
While Carcans, Nouvelle-Aquitaine, France currently shows low STR regulations, specific Airbnb license requirements might still exist or change. Always verify the latest short term rental regulations and Airbnb license requirements directly with local government authorities for Carcans to ensure full compliance before hosting.
(Source: AirROI data, 2026, based on 7% licensed listings)
Top Performing Airbnb Properties in Carcans (2026)
Benchmark your potential! Explore examples of top-performing Airbnb properties in Carcansbased on Trailing Twelve Month (TTM) revenue. Analyze their characteristics, revenue, occupancy rate, and ADR to understand what drives success in this market.

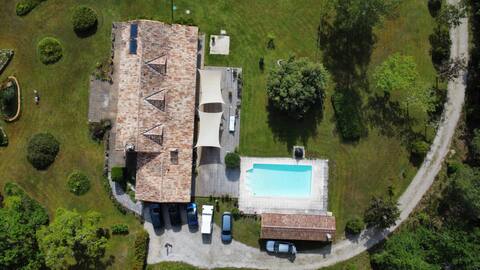
170 m2 family villa, sleeps 9 with air conditioning
Entire Place • 4 bedrooms
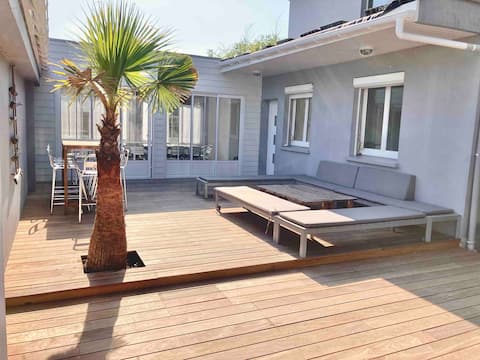
Peaceful haven near the lake.
Entire Place • 6 bedrooms
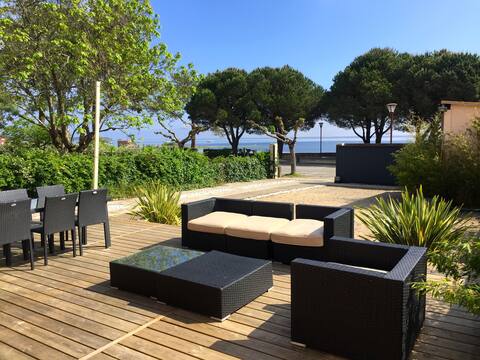
Family house lakeside for up to 15
Entire Place • 5 bedrooms

Hidden paradise in Carcans
Entire Place • 4 bedrooms
Charming house on the waterfront of Lake Carcans
Entire Place • 5 bedrooms

Cosy house swimming pool near Lake Ocean Vineyards
Entire Place • 4 bedrooms
Note: Performance varies based on location, size, amenities, seasonality, and management quality. Data reflects the past 12 months.
Top Performing Airbnb Hosts in Carcans (2026)
Learn from the best! This table showcases top-performing Airbnb hosts in Carcans based on the number of properties managed and estimated total revenue over the past year. Analyze their scale and performance metrics.
| Host Name | Properties | Grossing Revenue | Stay Reviews | Avg Rating |
|---|---|---|---|---|
| Vincent | 17 | $76,633 | 164 | 4.89/5.0 |
| Véronique | 1 | $64,552 | 28 | 4.93/5.0 |
| Paul | 1 | $61,171 | 8 | 4.50/5.0 |
| Thierry | 2 | $56,432 | 30 | 4.86/5.0 |
| Virginie | 1 | $51,222 | 81 | 4.53/5.0 |
| Jean-Charles | 1 | $42,494 | 9 | 4.78/5.0 |
| Sarah - Interhome | 5 | $42,424 | 17 | 4.50/5.0 |
| Carole | 3 | $41,713 | 92 | 4.85/5.0 |
| Karen | 2 | $39,908 | 45 | 4.97/5.0 |
| Karine | 2 | $39,807 | 465 | 4.87/5.0 |
Analyzing the strategies of top hosts, such as their property selection, pricing, and guest communication, can offer valuable lessons for optimizing your own Airbnb operations in Carcans.
Dive Deeper: Advanced Carcans STR Market Data (2026)
Ready to unlock more insights? AirROI provides access to advanced metrics and comprehensive Airbnb data for Carcans. Explore detailed analytics beyond this report to refine your investment strategy, optimize pricing, and maximize your vacation rental profits.
Explore Advanced MetricsCarcans Short-Term Rental Market Composition (2026): Property & Room Types
Room Type Distribution
Property Type Distribution
Market Composition Insights for Carcans
- The Carcans Airbnb market composition is heavily skewed towards Entire Home/Apt listings, which make up 93% of the 383 active rentals. This indicates strong guest preference for privacy and space.
- Looking at the property type distribution in Carcans, House properties are the most common (49.9%), reflecting the local real estate landscape.
- Houses represent a significant 49.9% portion, catering likely to families or larger groups.
- Smaller segments like hotel/boutique, others, unique stays (combined 3.1%) offer potential for unique stay experiences.
Carcans Airbnb Room Capacity Analysis (2026): Bedroom Distribution
Distribution of Listings by Number of Bedrooms
Room Capacity Insights for Carcans
- The dominant room capacity in Carcans is 1 bedroom listings, making up 36.6% of the market. This suggests a strong demand for properties suitable for couples or solo travelers.
- Together, 1 bedroom and 2 bedrooms properties represent 58.8% of the active Airbnb listings in Carcans, indicating a high concentration in these sizes.
- A significant 34.5% of listings offer 3+ bedrooms, catering to larger groups and families seeking more space in Carcans.
Carcans Vacation Rental Guest Capacity Trends (2026)
Distribution of Listings by Guest Capacity
Guest Capacity Insights for Carcans
- The most common guest capacity trend in Carcans vacation rentals is listings accommodating 4 guests (29.2%). This suggests the primary traveler segment is likely small families or groups.
- Properties designed for 4 guests and 6 guests dominate the Carcans STR market, accounting for 50.9% of listings.
- 40.4% of properties accommodate 6+ guests, serving the market segment for larger families or group travel in Carcans.
- On average, properties in Carcans are equipped to host 4.9 guests.
Carcans Airbnb Booking Patterns (2026): Available vs. Booked Days
Available Days Distribution
Booked Days Distribution
Booking Pattern Insights for Carcans
- The most common availability pattern in Carcans falls within the 271-366 days range, representing 69.5% of listings. This suggests many properties have significant open periods on their calendars.
- Approximately 97.2% of listings show high availability (181+ days open annually), indicating potential for increased bookings or specific owner usage patterns.
- For booked days, the 31-90 days range is most frequent in Carcans (46.7%), reflecting common guest stay durations or potential owner blocking patterns.
- A notable 3.1% of properties secure long booking periods (181+ days booked per year), highlighting successful long-term rental strategies or significant owner usage.
Carcans Airbnb Minimum Stay Requirements Analysis
Distribution of Listings by Minimum Night Requirement
1 Night
45 listings
11.7% of total
2 Nights
37 listings
9.7% of total
3 Nights
17 listings
4.4% of total
4-6 Nights
63 listings
16.4% of total
7-29 Nights
50 listings
13.1% of total
30+ Nights
171 listings
44.6% of total
Key Insights
- The most prevalent minimum stay requirement in Carcans is 30+ Nights, adopted by 44.6% of listings. This highlights the market's preference for longer commitments.
- A significant segment (44.6%) caters to monthly stays (30+ nights) in Carcans, pointing to opportunities in the extended-stay market.
Recommendations
- Align with the market by considering a 30+ Nights minimum stay, as 44.6% of Carcans hosts use this setting.
- If feasible, allowing 1-night stays, especially midweek or during low season, could capture last-minute bookings, as only 11.7% currently do.
- Explore offering discounts for stays of 30+ nights to attract the 44.6% of the market seeking extended stays.
- Adjust minimum nights based on seasonality – potentially shorter during low season and longer during peak demand periods in Carcans.
Carcans Airbnb Cancellation Policy Trends Analysis (2026)
Super Strict 60 Days
5 listings
1.3% of total
Flexible
58 listings
15.2% of total
Moderate
47 listings
12.3% of total
Firm
182 listings
47.6% of total
Strict
90 listings
23.6% of total
Cancellation Policy Insights for Carcans
- The prevailing Airbnb cancellation policy trend in Carcans is Firm, used by 47.6% of listings.
- A majority (71.2%) of hosts in Carcans utilize Firm or Strict policies, indicating a market where hosts prioritize booking security.
Recommendations for Hosts
- Consider adopting a Firm policy to align with the 47.6% market standard in Carcans.
- Regularly review your cancellation policy against competitors and market demand shifts in Carcans.
Carcans STR Booking Lead Time Analysis (2026)
Average Booking Lead Time by Month
Booking Lead Time Insights for Carcans
- The overall average booking lead time for vacation rentals in Carcans is 72 days.
- Guests book furthest in advance for stays during May (average 113 days), likely coinciding with peak travel demand or local events.
- The shortest booking windows occur for stays in January (average 21 days), indicating more last-minute travel plans during this time.
- Seasonally, Summer (80 days avg.) sees the longest lead times, while Winter (26 days avg.) has the shortest, reflecting typical travel planning cycles.
Recommendations for Hosts
- Use the overall average lead time (72 days) as a baseline for your pricing and availability strategy in Carcans.
- For May stays, consider implementing length-of-stay discounts or slightly higher rates for bookings made less than 113 days out to capitalize on advance planning.
- Target marketing efforts for the Summer season well in advance (at least 80 days) to capture early planners.
- Monitor your own booking lead times against these Carcans averages to identify opportunities for dynamic pricing adjustments.
Popular & Essential Airbnb Amenities in Carcans (2026)
Amenity Prevalence
Amenity Insights for Carcans
- Popular amenities like Kitchen, Free parking on premises, Dishes and silverware are common but not universal. Offering these can provide a competitive edge.
Recommendations for Hosts
- Consider adding popular differentiators like Kitchen or Free parking on premises to increase appeal.
- Highlight unique or less common amenities you offer (e.g., hot tub, dedicated workspace, EV charger) in your listing description and photos.
- Regularly check competitor amenities in Carcans to stay competitive.
Carcans Airbnb Guest Demographics & Profile Analysis (2026)
Guest Profile Summary for Carcans
- The typical guest profile for Airbnb in Carcans consists of primarily domestic travelers (85%), often arriving from nearby Bordeaux, typically belonging to the Post-2000s (Gen Z/Alpha) group (50%), primarily speaking French or English.
- Domestic travelers account for 84.5% of guests.
- Key international markets include France (84.5%) and Germany (5.8%).
- Top languages spoken are French (40.4%) followed by English (33.7%).
- A significant demographic segment is the Post-2000s (Gen Z/Alpha) group, representing 50% of guests.
Recommendations for Hosts
- Target domestic marketing efforts towards travelers from Bordeaux and Paris.
- Tailor amenities and listing descriptions to appeal to the dominant Post-2000s (Gen Z/Alpha) demographic (e.g., highlight fast WiFi, smart home features, local guides).
- Highlight unique local experiences or amenities relevant to the primary guest profile.
- Consider seasonal promotions aligned with peak travel times for key origin markets.
Nearby Short-Term Rental Market Comparison
How does the Carcans Airbnb market stack up against its neighbors? Compare key performance metrics like average monthly revenue, ADR, and occupancy rates in surrounding areas to understand the broader regional STR landscape.
| Market | Active Properties | Monthly Revenue | Daily Rate | Avg. Occupancy |
|---|---|---|---|---|
| Carignan-de-Bordeaux | 34 | $3,140 | $316.66 | 42% |
| Néac | 11 | $3,047 | $441.32 | 38% |
| Bourneau | 11 | $2,771 | $407.54 | 30% |
| Vouhé | 10 | $2,634 | $316.94 | 34% |
| Cénac | 17 | $2,542 | $307.76 | 44% |
| Croix-Chapeau | 12 | $2,532 | $224.85 | 45% |
| Saint-Seurin-de-Cadourne | 12 | $2,529 | $378.76 | 33% |
| Le Bois-Plage-en-Ré | 321 | $2,457 | $318.28 | 42% |
| Sainte-Florence | 10 | $2,413 | $179.27 | 52% |
| Beautiran | 10 | $2,388 | $244.69 | 35% |