Cabariot Airbnb Market Analysis 2025: Short Term Rental Data & Vacation Rental Statistics in Nouvelle-Aquitaine, France
Is Airbnb profitable in Cabariot in 2025? Explore comprehensive Airbnb analytics for Cabariot, Nouvelle-Aquitaine, France to uncover income potential. This 2025 STR market report for Cabariot, based on AirROI data from August 2024 to July 2025, reveals key trends in the niche market of 18 active listings.
Whether you're considering an Airbnb investment in Cabariot, optimizing your existing vacation rental, or exploring rental arbitrage opportunities, understanding the Cabariot Airbnb data is crucial. Leveraging the low regulation environment is key to maximizing your short term rental income potential. Let's dive into the specifics.
Key Cabariot Airbnb Performance Metrics Overview
Monthly Airbnb Revenue Variations & Income Potential in Cabariot (2025)
Understanding the monthly revenue variations for Airbnb listings in Cabariot is key to maximizing your short term rental income potential. Seasonality significantly impacts earnings. Our analysis, based on data from the past 12 months, shows that the peak revenue month for STRs in Cabariot is typically August, while September often presents the lowest earnings, highlighting opportunities for strategic pricing adjustments during shoulder and low seasons. Explore the typical Airbnb income in Cabariot across different performance tiers:
- Best-in-class properties (Top 10%) achieve $2,835+ monthly, often utilizing dynamic pricing and superior guest experiences.
- Strong performing properties (Top 25%) earn $2,092 or more, indicating effective management and desirable locations/amenities.
- Typical properties (Median) generate around $1,029 per month, representing the average market performance.
- Entry-level properties (Bottom 25%) see earnings around $660, often with potential for optimization.
Average Monthly Airbnb Earnings Trend in Cabariot
Cabariot Airbnb Occupancy Rate Trends (2025)
Maximize your bookings by understanding the Cabariot STR occupancy trends. Seasonal demand shifts significantly influence how often properties are booked. Typically, Augustsees the highest demand (peak season occupancy), while March experiences the lowest (low season). Effective strategies, like adjusting minimum stays or offering promotions, can boost occupancy during slower periods. Here's how different property tiers perform in Cabariot:
- Best-in-class properties (Top 10%) achieve 80%+ occupancy, indicating high desirability and potentially optimized availability.
- Strong performing properties (Top 25%) maintain 57% or higher occupancy, suggesting good market fit and guest satisfaction.
- Typical properties (Median) have an occupancy rate around 30%.
- Entry-level properties (Bottom 25%) average 21% occupancy, potentially facing higher vacancy.
Average Monthly Occupancy Rate Trend in Cabariot
Average Daily Rate (ADR) Airbnb Trends in Cabariot (2025)
Effective short term rental pricing strategy in Cabariot involves understanding monthly ADR fluctuations. The Average Daily Rate (ADR) for Airbnb in Cabariot typically peaks in August and dips lowest during January. Leveraging Airbnb dynamic pricing tools or strategies based on this seasonality can significantly boost revenue. Here's a look at the typical nightly rates achieved:
- Best-in-class properties (Top 10%) command rates of $324+ per night, often due to premium features or locations.
- Strong performing properties (Top 25%) achieve nightly rates of $106 or more.
- Typical properties (Median) charge around $87 per night.
- Entry-level properties (Bottom 25%) earn around $75 per night.
Average Daily Rate (ADR) Trend by Month in Cabariot
Get Live Cabariot Market Intelligence 👇
Explore Real-time Analytics
Airbnb Seasonality Analysis & Trends in Cabariot (2025)
Peak Season (August, July, October)
- Revenue averages $2,090 per month
- Occupancy rates average 50.7%
- Daily rates average $171
Shoulder Season
- Revenue averages $1,296 per month
- Occupancy maintains around 37.8%
- Daily rates hold near $158
Low Season (March, September, November)
- Revenue drops to average $862 per month
- Occupancy decreases to average 27.9%
- Daily rates adjust to average $160
Seasonality Insights for Cabariot
- The Airbnb seasonality in Cabariot shows highly seasonal trends requiring careful strategy. While the sections above show seasonal averages, it's also insightful to look at the extremes:
- During the high season, the absolute peak month showcases Cabariot's highest earning potential, with monthly revenues capable of climbing to $2,748, occupancy reaching a high of 69.2%, and ADRs peaking at $180.
- Conversely, the slowest single month of the year, typically falling within the low season, marks the market's lowest point. In this month, revenue might dip to $800, occupancy could drop to 22.6%, and ADRs may adjust down to $145.
- Understanding both the seasonal averages and these monthly peaks and troughs in revenue, occupancy, and ADR is crucial for maximizing your Airbnb profit potential in Cabariot.
Seasonal Strategies for Maximizing Profit
- Peak Season: Maximize revenue through premium pricing and potentially longer minimum stays. Ensure high availability.
- Low Season: Offer competitive pricing, special promotions (e.g., extended stay discounts), and flexible cancellation policies. Target off-season travelers like remote workers or budget-conscious guests.
- Shoulder Seasons: Implement dynamic pricing that balances peak and low rates. Target weekend travelers or specific events. Offer slightly more flexible terms than peak season.
- Regularly analyze your own performance against these Cabariot seasonality benchmarks and adjust your pricing and availability strategy accordingly.
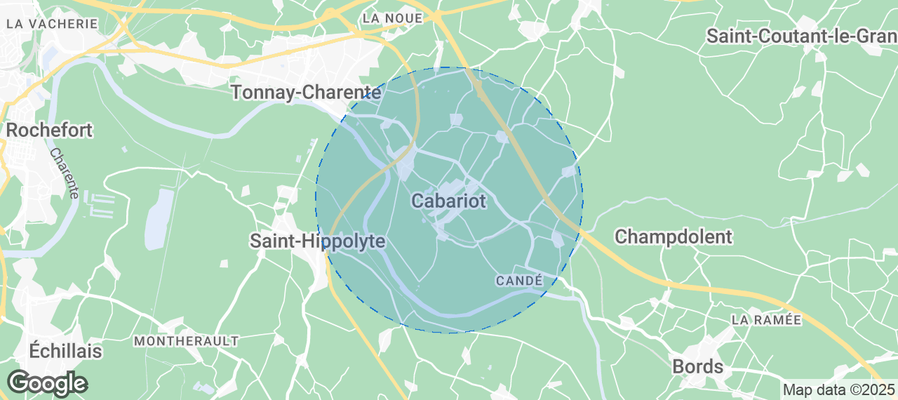
Best Areas for Airbnb Investment in Cabariot (2025)
Exploring the top neighborhoods for short-term rentals in Cabariot? This section highlights key areas, outlining why they are attractive for hosts and guests, along with notable local attractions. Consider these locations based on your target guest profile and investment strategy.
| Neighborhood / Area | Why Host Here? (Target Guests & Appeal) | Key Attractions & Landmarks |
|---|---|---|
| Cabariot Town Center | A quaint French town with historical charm, ideal for visitors looking to experience local culture and cuisine. Close to vineyards and the scenic banks of the Charente River. | Church of Saint-Mary, Local wineries, River Charente, Château de Cabariot, Outdoor markets |
| Île de l'Oléron | A beautiful island off the coast of Nouvelle-Aquitaine known for its stunning beaches and nature reserves. Perfect for families and beach lovers. | Chateau d'Oléron, Plage de la Cotinière, La Grande Plage, Ile d'Oléron National Nature Reserve, Fishing villages |
| Saintes | An ancient city with Roman history and architecture. Popular for historical tourism and cultural events, attracting history buffs and art lovers. | Saint-Pierre Cathedral, Roman Amphitheatre, Arch of Germanicus, Museum of Saintes, Vignoble de Saintonge |
| Rochefort | Known for its naval heritage and picturesque canals, Rochefort offers a unique experience combining history and maritime culture, ideal for tourists. | Corderie Royale, Hermione ship, Rochefort National Museum, River Charente walks, Maritime heritage sites |
| La Rochelle | A vibrant coastal city famous for its old port, maritime history, and lively atmosphere, attracting tourists for its rich culture and seaside attractions. | Old Port, La Rochelle Aquarium, Historic towers, Musee Maritime, La Rochelle market |
| Royan | A popular seaside resort town known for its beautiful beaches and Art Deco architecture. Great for summer tourism and family vacations. | Grande Conche Beach, Royan Planet Exotica, Royan market, Phare de Cordouan, Côte de Beauté |
| Cognac | Famous for its Cognac production and rich history, an attractive destination for foodies and those interested in local spirit tourism. | Cognac distilleries, Cognac Museum, Saint-Léger Church, River Charente, Cognac vineyards |
| Pons | A charming medieval town known for its historical sites and scenic surroundings, appealing to visitors interested in rural tourism and heritage. | Pons Castle, Museum of Pons, Church of Saint-Gens, Les Jardins de la villa de l'Hopital, Cognac vineyards nearby |
Understanding Airbnb License Requirements & STR Laws in Cabariot (2025)
While Cabariot, Nouvelle-Aquitaine, France currently shows low STR regulations, specific Airbnb license requirements might still exist or change. Always verify the latest short term rental regulations and Airbnb license requirements directly with local government authorities for Cabariot to ensure full compliance before hosting.
(Source: AirROI data, 2025, finding no licensed listings among those analyzed)
Top Performing Airbnb Properties in Cabariot (2025)
Benchmark your potential! Explore examples of top-performing Airbnb properties in Cabariotbased on Trailing Twelve Month (TTM) revenue. Analyze their characteristics, revenue, occupancy rate, and ADR to understand what drives success in this market.
Large charming cottage in the countryside, eco-friendly
Private Room • 3 bedrooms
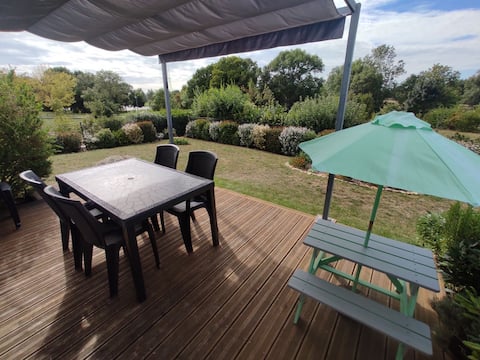
House with garden and terrace overlooking the pond
Entire Place • 3 bedrooms

Country cottage with its own hot tub
Entire Place • 2 bedrooms

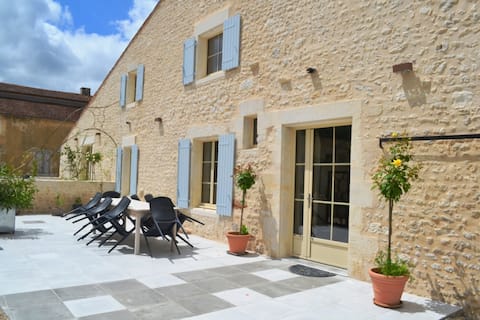
Charming and comfortable house in Charente-Maritime
Entire Place • 3 bedrooms
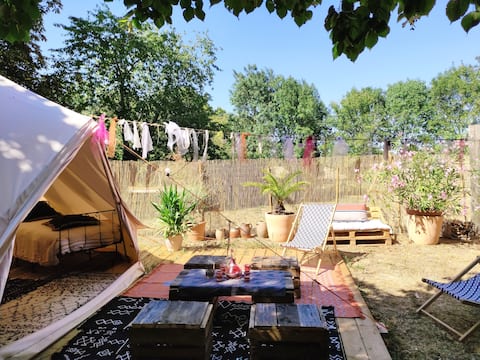
Charming and comfortable bivouac under the stars
Entire Place • 1 bedroom
Maison proche lac
Entire Place • 3 bedrooms
Note: Performance varies based on location, size, amenities, seasonality, and management quality. Data reflects the past 12 months.
Top Performing Airbnb Hosts in Cabariot (2025)
Learn from the best! This table showcases top-performing Airbnb hosts in Cabariot based on the number of properties managed and estimated total revenue over the past year. Analyze their scale and performance metrics.
| Host Name | Properties | Grossing Revenue | Stay Reviews | Avg Rating |
|---|---|---|---|---|
| Stéphanie Et Gaël | 3 | $51,076 | 41 | 4.91/5.0 |
| Sylvie Et Jp | 1 | $25,327 | 187 | 4.98/5.0 |
| Magalie | 1 | $13,696 | 145 | 4.94/5.0 |
| Valérie | 1 | $10,804 | 25 | 4.88/5.0 |
| Alexis | 4 | $7,904 | 31 | 4.87/5.0 |
| Host #112129531 | 1 | $6,970 | 1 | Not Rated |
| Pauline | 1 | $6,256 | 26 | 4.92/5.0 |
| Ghislaine | 2 | $5,885 | 18 | 4.88/5.0 |
| Sebastien | 1 | $5,425 | 16 | 4.94/5.0 |
| Carole | 1 | $4,698 | 12 | 4.83/5.0 |
Analyzing the strategies of top hosts, such as their property selection, pricing, and guest communication, can offer valuable lessons for optimizing your own Airbnb operations in Cabariot.
Dive Deeper: Advanced Cabariot STR Market Data (2025)
Ready to unlock more insights? AirROI provides access to advanced metrics and comprehensive Airbnb data for Cabariot. Explore detailed analytics beyond this report to refine your investment strategy, optimize pricing, and maximize your vacation rental profits.
Explore Advanced MetricsCabariot Short-Term Rental Market Composition (2025): Property & Room Types
Room Type Distribution
Property Type Distribution
Market Composition Insights for Cabariot
- The Cabariot Airbnb market composition is heavily skewed towards Entire Home/Apt listings, which make up 88.9% of the 18 active rentals. This indicates strong guest preference for privacy and space.
- Looking at the property type distribution in Cabariot, House properties are the most common (66.7%), reflecting the local real estate landscape.
- Houses represent a significant 66.7% portion, catering likely to families or larger groups.
- The presence of 5.6% Hotel/Boutique listings indicates integration with traditional hospitality.
Cabariot Airbnb Room Capacity Analysis (2025): Bedroom Distribution
Distribution of Listings by Number of Bedrooms
Room Capacity Insights for Cabariot
- The dominant room capacity in Cabariot is 2 bedrooms listings, making up 38.9% of the market. This suggests a strong demand for properties suitable for couples or solo travelers.
- Together, 2 bedrooms and 3 bedrooms properties represent 66.7% of the active Airbnb listings in Cabariot, indicating a high concentration in these sizes.
- A significant 33.4% of listings offer 3+ bedrooms, catering to larger groups and families seeking more space in Cabariot.
Cabariot Vacation Rental Guest Capacity Trends (2025)
Distribution of Listings by Guest Capacity
Guest Capacity Insights for Cabariot
- The most common guest capacity trend in Cabariot vacation rentals is listings accommodating 4 guests (33.3%). This suggests the primary traveler segment is likely small families or groups.
- Properties designed for 4 guests and 6 guests dominate the Cabariot STR market, accounting for 55.5% of listings.
- 38.9% of properties accommodate 6+ guests, serving the market segment for larger families or group travel in Cabariot.
- On average, properties in Cabariot are equipped to host 4.8 guests.
Cabariot Airbnb Booking Patterns (2025): Available vs. Booked Days
Available Days Distribution
Booked Days Distribution
Booking Pattern Insights for Cabariot
- The most common availability pattern in Cabariot falls within the 271-366 days range, representing 72.2% of listings. This suggests many properties have significant open periods on their calendars.
- Approximately 94.4% of listings show high availability (181+ days open annually), indicating potential for increased bookings or specific owner usage patterns.
- For booked days, the 31-90 days range is most frequent in Cabariot (38.9%), reflecting common guest stay durations or potential owner blocking patterns.
- A notable 5.6% of properties secure long booking periods (181+ days booked per year), highlighting successful long-term rental strategies or significant owner usage.
Cabariot Airbnb Minimum Stay Requirements Analysis
Distribution of Listings by Minimum Night Requirement
1 Night
6 listings
35.3% of total
2 Nights
3 listings
17.6% of total
4-6 Nights
4 listings
23.5% of total
30+ Nights
4 listings
23.5% of total
Key Insights
- The most prevalent minimum stay requirement in Cabariot is 1 Night, adopted by 35.3% of listings. This highlights the market's preference for shorter, flexible bookings.
- A significant segment (23.5%) caters to monthly stays (30+ nights) in Cabariot, pointing to opportunities in the extended-stay market.
Recommendations
- Align with the market by considering a 1 Night minimum stay, as 35.3% of Cabariot hosts use this setting.
- Explore offering discounts for stays of 30+ nights to attract the 23.5% of the market seeking extended stays.
- Adjust minimum nights based on seasonality – potentially shorter during low season and longer during peak demand periods in Cabariot.
Cabariot Airbnb Cancellation Policy Trends Analysis (2025)
Flexible
12 listings
70.6% of total
Moderate
1 listings
5.9% of total
Firm
4 listings
23.5% of total
Cancellation Policy Insights for Cabariot
- The prevailing Airbnb cancellation policy trend in Cabariot is Flexible, used by 70.6% of listings.
- The market strongly favors guest-friendly terms, with 76.5% of listings offering Flexible or Moderate policies. This suggests guests in Cabariot may expect booking flexibility.
Recommendations for Hosts
- Consider adopting a Flexible policy to align with the 70.6% market standard in Cabariot.
- Given the high prevalence of Flexible policies (70.6%), offering this can enhance booking appeal, especially during shoulder seasons.
- Regularly review your cancellation policy against competitors and market demand shifts in Cabariot.
Cabariot STR Booking Lead Time Analysis (2025)
Average Booking Lead Time by Month
Booking Lead Time Insights for Cabariot
- The overall average booking lead time for vacation rentals in Cabariot is 50 days.
- Guests book furthest in advance for stays during October (average 104 days), likely coinciding with peak travel demand or local events.
- The shortest booking windows occur for stays in February (average 14 days), indicating more last-minute travel plans during this time.
- Seasonally, Summer (60 days avg.) sees the longest lead times, while Winter (30 days avg.) has the shortest, reflecting typical travel planning cycles.
Recommendations for Hosts
- Use the overall average lead time (50 days) as a baseline for your pricing and availability strategy in Cabariot.
- For October stays, consider implementing length-of-stay discounts or slightly higher rates for bookings made less than 104 days out to capitalize on advance planning.
- During February, focus on last-minute booking availability and promotions, as guests book with very short notice (14 days avg.).
- Target marketing efforts for the Summer season well in advance (at least 60 days) to capture early planners.
- Monitor your own booking lead times against these Cabariot averages to identify opportunities for dynamic pricing adjustments.
Popular & Essential Airbnb Amenities in Cabariot (2025)
Amenity Prevalence
Amenity Insights for Cabariot
- Essential amenities in Cabariot that guests expect include: Free parking on premises. Lacking these (this) could significantly impact bookings.
- Popular amenities like Kitchen, Heating, Hot water are common but not universal. Offering these can provide a competitive edge.
Recommendations for Hosts
- Ensure your listing includes all essential amenities for Cabariot: Free parking on premises.
- Consider adding popular differentiators like Kitchen or Heating to increase appeal.
- Highlight unique or less common amenities you offer (e.g., hot tub, dedicated workspace, EV charger) in your listing description and photos.
- Regularly check competitor amenities in Cabariot to stay competitive.
Cabariot Airbnb Guest Demographics & Profile Analysis (2025)
Guest Profile Summary for Cabariot
- The typical guest profile for Airbnb in Cabariot consists of primarily domestic travelers (88%), often arriving from nearby Paris, typically belonging to the Post-2000s (Gen Z/Alpha) group (50%), primarily speaking French or English.
- Domestic travelers account for 87.5% of guests.
- Key international markets include France (87.5%) and Netherlands (2.5%).
- Top languages spoken are French (56.1%) followed by English (28.1%).
- A significant demographic segment is the Post-2000s (Gen Z/Alpha) group, representing 50% of guests.
Recommendations for Hosts
- Target domestic marketing efforts towards travelers from Paris and Toulouse.
- Tailor amenities and listing descriptions to appeal to the dominant Post-2000s (Gen Z/Alpha) demographic (e.g., highlight fast WiFi, smart home features, local guides).
- Highlight unique local experiences or amenities relevant to the primary guest profile.
- Consider seasonal promotions aligned with peak travel times for key origin markets.
Nearby Short-Term Rental Market Comparison
How does the Cabariot Airbnb market stack up against its neighbors? Compare key performance metrics like average monthly revenue, ADR, and occupancy rates in surrounding areas to understand the broader regional STR landscape.
| Market | Active Properties | Monthly Revenue | Daily Rate | Avg. Occupancy |
|---|---|---|---|---|
| Saint-Laurent-des-Combes | 10 | $3,280 | $600.36 | 19% |
| Saint-Hippolyte | 10 | $2,783 | $224.37 | 36% |
| Bourneau | 11 | $2,758 | $449.27 | 32% |
| Carignan-de-Bordeaux | 41 | $2,545 | $280.65 | 41% |
| Sainte-Florence | 10 | $2,493 | $167.88 | 54% |
| Bourrou | 10 | $2,432 | $314.51 | 34% |
| Cénac | 18 | $2,426 | $304.14 | 48% |
| Croix-Chapeau | 12 | $2,393 | $226.32 | 40% |
| Nabinaud | 12 | $2,379 | $318.12 | 37% |
| Antonne-et-Trigonant | 12 | $2,339 | $263.09 | 40% |