Audenge Airbnb Market Analysis 2026: Short Term Rental Data & Vacation Rental Statistics in Nouvelle-Aquitaine, France
Is Airbnb profitable in Audenge in 2026? Explore comprehensive Airbnb analytics for Audenge, Nouvelle-Aquitaine, France to uncover income potential. This 2026 STR market report for Audenge, based on AirROI data from February 2025 to January 2026, reveals key trends in the niche market of 176 active listings.
Whether you're considering an Airbnb investment in Audenge, optimizing your existing vacation rental, or exploring rental arbitrage opportunities, understanding the Audenge Airbnb data is crucial. Navigating the high regulation landscape is key to maximizing your short term rental income potential. Let's dive into the specifics.
Key Audenge Airbnb Performance Metrics Overview
Monthly Airbnb Revenue Variations & Income Potential in Audenge (2026)
Understanding the monthly revenue variations for Airbnb listings in Audenge is key to maximizing your short term rental income potential. Seasonality significantly impacts earnings. Our analysis, based on data from the past 12 months, shows that the peak revenue month for STRs in Audenge is typically August, while January often presents the lowest earnings, highlighting opportunities for strategic pricing adjustments during shoulder and low seasons. Explore the typical Airbnb income in Audenge across different performance tiers:
- Best-in-class properties (Top 10%) achieve $3,622+ monthly, often utilizing dynamic pricing and superior guest experiences.
- Strong performing properties (Top 25%) earn $2,332 or more, indicating effective management and desirable locations/amenities.
- Typical properties (Median) generate around $1,380 per month, representing the average market performance.
- Entry-level properties (Bottom 25%) see earnings around $773, often with potential for optimization.
Average Monthly Airbnb Earnings Trend in Audenge
Audenge Airbnb Occupancy Rate Trends (2026)
Maximize your bookings by understanding the Audenge STR occupancy trends. Seasonal demand shifts significantly influence how often properties are booked. Typically, Augustsees the highest demand (peak season occupancy), while January experiences the lowest (low season). Effective strategies, like adjusting minimum stays or offering promotions, can boost occupancy during slower periods. Here's how different property tiers perform in Audenge:
- Best-in-class properties (Top 10%) achieve 75%+ occupancy, indicating high desirability and potentially optimized availability.
- Strong performing properties (Top 25%) maintain 59% or higher occupancy, suggesting good market fit and guest satisfaction.
- Typical properties (Median) have an occupancy rate around 39%.
- Entry-level properties (Bottom 25%) average 22% occupancy, potentially facing higher vacancy.
Average Monthly Occupancy Rate Trend in Audenge
Average Daily Rate (ADR) Airbnb Trends in Audenge (2026)
Effective short term rental pricing strategy in Audenge involves understanding monthly ADR fluctuations. The Average Daily Rate (ADR) for Airbnb in Audenge typically peaks in August and dips lowest during March. Leveraging Airbnb dynamic pricing tools or strategies based on this seasonality can significantly boost revenue. Here's a look at the typical nightly rates achieved:
- Best-in-class properties (Top 10%) command rates of $298+ per night, often due to premium features or locations.
- Strong performing properties (Top 25%) achieve nightly rates of $198 or more.
- Typical properties (Median) charge around $117 per night.
- Entry-level properties (Bottom 25%) earn around $88 per night.
Average Daily Rate (ADR) Trend by Month in Audenge
Get Live Audenge Market Intelligence 👇

Explore Real-time Analytics
Airbnb Seasonality Analysis & Trends in Audenge (2026)
Peak Season (August, July, September)
- Revenue averages $3,207 per month
- Occupancy rates average 59.1%
- Daily rates average $167
Shoulder Season
- Revenue averages $1,473 per month
- Occupancy maintains around 37.8%
- Daily rates hold near $152
Low Season (January, February, November)
- Revenue drops to average $907 per month
- Occupancy decreases to average 28.1%
- Daily rates adjust to average $152
Seasonality Insights for Audenge
- The Airbnb seasonality in Audenge shows highly seasonal trends requiring careful strategy. While the sections above show seasonal averages, it's also insightful to look at the extremes:
- During the high season, the absolute peak month showcases Audenge's highest earning potential, with monthly revenues capable of climbing to $4,026, occupancy reaching a high of 70.2%, and ADRs peaking at $172.
- Conversely, the slowest single month of the year, typically falling within the low season, marks the market's lowest point. In this month, revenue might dip to $645, occupancy could drop to 21.2%, and ADRs may adjust down to $145.
- Understanding both the seasonal averages and these monthly peaks and troughs in revenue, occupancy, and ADR is crucial for maximizing your Airbnb profit potential in Audenge.
Seasonal Strategies for Maximizing Profit
- Peak Season: Maximize revenue through premium pricing and potentially longer minimum stays. Ensure high availability.
- Low Season: Offer competitive pricing, special promotions (e.g., extended stay discounts), and flexible cancellation policies. Target off-season travelers like remote workers or budget-conscious guests.
- Shoulder Seasons: Implement dynamic pricing that balances peak and low rates. Target weekend travelers or specific events. Offer slightly more flexible terms than peak season.
- Regularly analyze your own performance against these Audenge seasonality benchmarks and adjust your pricing and availability strategy accordingly.
Best Areas for Airbnb Investment in Audenge (2026)
Exploring the top neighborhoods for short-term rentals in Audenge? This section highlights key areas, outlining why they are attractive for hosts and guests, along with notable local attractions. Consider these locations based on your target guest profile and investment strategy.
| Neighborhood / Area | Why Host Here? (Target Guests & Appeal) | Key Attractions & Landmarks |
|---|---|---|
| Centre Ville | The heart of Audenge, offering easy access to local shops, cafes, and the beautiful Audenge beach. It's a charming area for tourists who want to experience the local culture and cuisine. | Audenge Beach, Local Markets, Bassin d'Arcachon, Lighthouse of Cap Ferret, Maison de l'Architecture |
| Port d'Audenge | A picturesque port area that attracts families and couples looking for a serene getaway. Ideal for nature enthusiasts and those who enjoy water activities like boating and fishing. | Port d'Audenge, Bassin d'Arcachon, Beach access, Bike trails, Nature reserves |
| Domaine de la Burthe | A tranquil residential area that's close to nature parks, making it perfect for those who want a peaceful retreat while still being near the town's amenities. | Parc de la Burthe, Walking trails, Picnic areas, Local wildlife, Nature observation |
| Le Lion | Known for its historical sites and local architecture, this area provides a glimpse into the rich heritage of Audenge, attracting history buffs and culture seekers. | Historical buildings, Church of Saint Eloi, Cultural festivals, Local galleries, Charming streets |
| Ares Forest | Ideal for eco-tourists and families, this area combines beautiful forest landscapes with access to the coast, perfect for outdoor activities such as hiking and biking. | Ares Beach, Walking trails, Forests and lakes, Wildlife spotting, Cycling paths |
| Cabanes Tchanquées | Unique raised cabins on stilts, offering a distinct vacation experience. Attracts photographers and those looking for an Instagram-worthy location. | Cabanes Tchanquées, Boat tours, Photogenic landscapes, Fishing spots, Nearby eateries |
| Cap Ferret | While slightly outside Audenge, this area is renowned for its stunning beaches, vibrant local markets, and upscale dining, making it a premium destination for tourists. | Cap Ferret Beach, Local seafood markets, Dune du Pilat, Surfing spots, Quaint villages |
| Arcachon Bay | A neighboring area famous for its beautiful bay, offering various water sports, fine dining, and beautiful seaside walks, appealing to a wide range of tourists. | Arcachon Bay, Dune du Pilat, Marine activities, Scenic views, Seaside promenade |
Understanding Airbnb License Requirements & STR Laws in Audenge (2026)
Yes, Audenge, Nouvelle-Aquitaine, France enforces high STR regulations. Obtaining a license and ensuring compliance is almost certainly required according to current 2026 STR laws. Always verify the latest short term rental regulations and Airbnb license requirements directly with local government authorities for Audenge to ensure full compliance before hosting.
(Source: AirROI data, 2026, based on 84% licensed listings)
Top Performing Airbnb Properties in Audenge (2026)
Benchmark your potential! Explore examples of top-performing Airbnb properties in Audengebased on Trailing Twelve Month (TTM) revenue. Analyze their characteristics, revenue, occupancy rate, and ADR to understand what drives success in this market.
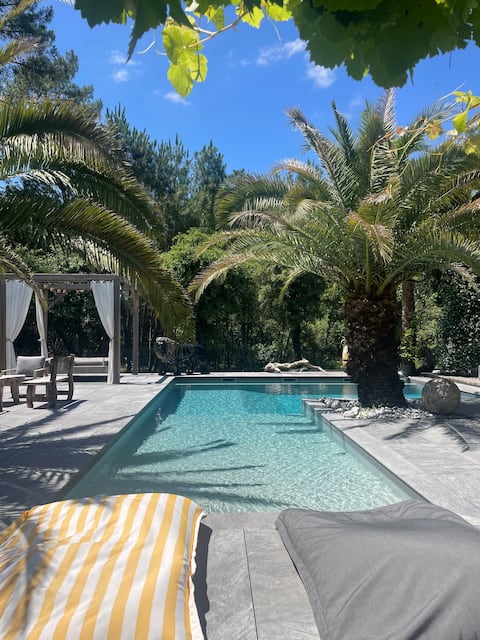
Villa Palmera
Entire Place • 4 bedrooms
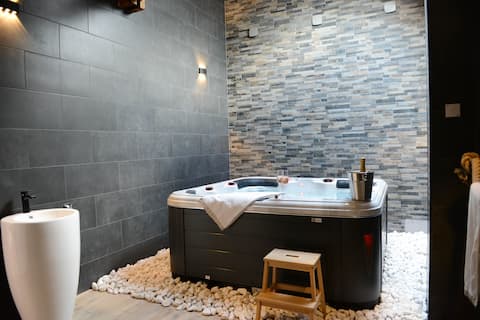
Les 3 Eaux Loft, Heated Pool, Hot Tub and Sauna
Entire Place • 4 bedrooms

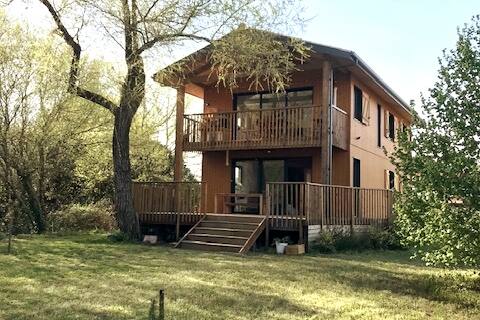
Maison Audenge 5 Bedrooms/11 people
Entire Place • 5 bedrooms
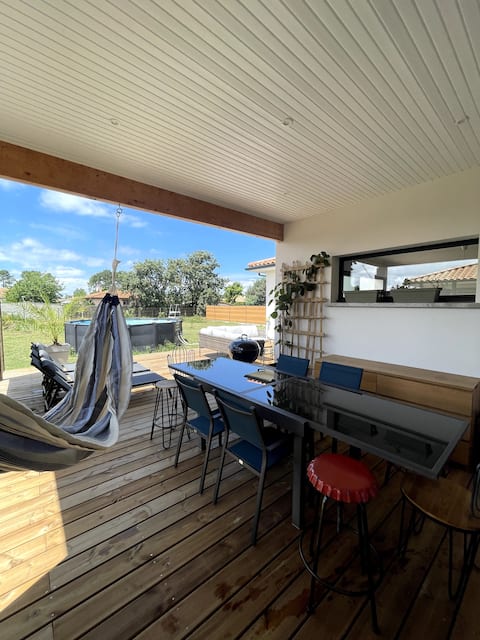
Villa of the Port of Audenge Arcachon Bay, sea side
Entire Place • 4 bedrooms

Small relaxation area
Entire Place • 1 bedroom
Villa Audenge
Entire Place • 4 bedrooms
Note: Performance varies based on location, size, amenities, seasonality, and management quality. Data reflects the past 12 months.
Top Performing Airbnb Hosts in Audenge (2026)
Learn from the best! This table showcases top-performing Airbnb hosts in Audenge based on the number of properties managed and estimated total revenue over the past year. Analyze their scale and performance metrics.
| Host Name | Properties | Grossing Revenue | Stay Reviews | Avg Rating |
|---|---|---|---|---|
| Julien | 1 | $71,001 | 23 | 4.87/5.0 |
| Jerome | 3 | $66,503 | 42 | 4.99/5.0 |
| Sylvain | 1 | $53,993 | 152 | 4.97/5.0 |
| Killian | 2 | $50,211 | 216 | 4.91/5.0 |
| Elvina | 1 | $43,915 | 12 | 4.50/5.0 |
| Pascale | 1 | $43,273 | 41 | 5.00/5.0 |
| Christopher | 1 | $43,103 | 52 | 4.98/5.0 |
| Remi | 1 | $42,844 | 6 | 5.00/5.0 |
| Rachel Et Jean-Baptiste | 1 | $42,746 | 60 | 4.87/5.0 |
| Mathilde Marie | 1 | $41,360 | 27 | 4.96/5.0 |
Analyzing the strategies of top hosts, such as their property selection, pricing, and guest communication, can offer valuable lessons for optimizing your own Airbnb operations in Audenge.
Dive Deeper: Advanced Audenge STR Market Data (2026)
Ready to unlock more insights? AirROI provides access to advanced metrics and comprehensive Airbnb data for Audenge. Explore detailed analytics beyond this report to refine your investment strategy, optimize pricing, and maximize your vacation rental profits.
Explore Advanced MetricsAudenge Short-Term Rental Market Composition (2026): Property & Room Types
Room Type Distribution
Property Type Distribution
Market Composition Insights for Audenge
- The Audenge Airbnb market composition is heavily skewed towards Entire Home/Apt listings, which make up 92% of the 176 active rentals. This indicates strong guest preference for privacy and space.
- Looking at the property type distribution in Audenge, House properties are the most common (67.6%), reflecting the local real estate landscape.
- Houses represent a significant 67.6% portion, catering likely to families or larger groups.
- The presence of 7.4% Hotel/Boutique listings indicates integration with traditional hospitality.
- Smaller segments like outdoor/unique, others (combined 4.0%) offer potential for unique stay experiences.
Audenge Airbnb Room Capacity Analysis (2026): Bedroom Distribution
Distribution of Listings by Number of Bedrooms
Room Capacity Insights for Audenge
- The dominant room capacity in Audenge is 1 bedroom listings, making up 31.8% of the market. This suggests a strong demand for properties suitable for couples or solo travelers.
- Together, 1 bedroom and 2 bedrooms properties represent 56.2% of the active Airbnb listings in Audenge, indicating a high concentration in these sizes.
- A significant 33.0% of listings offer 3+ bedrooms, catering to larger groups and families seeking more space in Audenge.
Audenge Vacation Rental Guest Capacity Trends (2026)
Distribution of Listings by Guest Capacity
Guest Capacity Insights for Audenge
- The most common guest capacity trend in Audenge vacation rentals is listings accommodating 4 guests (25%). This suggests the primary traveler segment is likely small families or groups.
- Properties designed for 4 guests and 2 guests dominate the Audenge STR market, accounting for 47.2% of listings.
- 36.3% of properties accommodate 6+ guests, serving the market segment for larger families or group travel in Audenge.
- On average, properties in Audenge are equipped to host 4.3 guests.
Audenge Airbnb Booking Patterns (2026): Available vs. Booked Days
Available Days Distribution
Booked Days Distribution
Booking Pattern Insights for Audenge
- The most common availability pattern in Audenge falls within the 271-366 days range, representing 50.6% of listings. This suggests many properties have significant open periods on their calendars.
- Approximately 85.8% of listings show high availability (181+ days open annually), indicating potential for increased bookings or specific owner usage patterns.
- For booked days, the 91-180 days range is most frequent in Audenge (36.9%), reflecting common guest stay durations or potential owner blocking patterns.
- A notable 14.2% of properties secure long booking periods (181+ days booked per year), highlighting successful long-term rental strategies or significant owner usage.
Audenge Airbnb Minimum Stay Requirements Analysis
Distribution of Listings by Minimum Night Requirement
1 Night
27 listings
15.3% of total
2 Nights
20 listings
11.4% of total
3 Nights
9 listings
5.1% of total
4-6 Nights
22 listings
12.5% of total
7-29 Nights
15 listings
8.5% of total
30+ Nights
83 listings
47.2% of total
Key Insights
- The most prevalent minimum stay requirement in Audenge is 30+ Nights, adopted by 47.2% of listings. This highlights the market's preference for longer commitments.
- A significant segment (47.2%) caters to monthly stays (30+ nights) in Audenge, pointing to opportunities in the extended-stay market.
Recommendations
- Align with the market by considering a 30+ Nights minimum stay, as 47.2% of Audenge hosts use this setting.
- If feasible, allowing 1-night stays, especially midweek or during low season, could capture last-minute bookings, as only 15.3% currently do.
- Explore offering discounts for stays of 30+ nights to attract the 47.2% of the market seeking extended stays.
- Adjust minimum nights based on seasonality – potentially shorter during low season and longer during peak demand periods in Audenge.
Audenge Airbnb Cancellation Policy Trends Analysis (2026)
Super Strict 60 Days
1 listings
0.6% of total
Flexible
43 listings
24.6% of total
Moderate
36 listings
20.6% of total
Firm
79 listings
45.1% of total
Strict
16 listings
9.1% of total
Cancellation Policy Insights for Audenge
- The prevailing Airbnb cancellation policy trend in Audenge is Firm, used by 45.1% of listings.
- A majority (54.2%) of hosts in Audenge utilize Firm or Strict policies, indicating a market where hosts prioritize booking security.
- Strict cancellation policies are quite rare (9.1%), potentially making listings with this policy less competitive unless justified by high demand or property type.
Recommendations for Hosts
- Consider adopting a Firm policy to align with the 45.1% market standard in Audenge.
- Using a Strict policy might deter some guests, as only 9.1% of listings use it. Evaluate if potential revenue protection outweighs possible lower booking rates.
- Regularly review your cancellation policy against competitors and market demand shifts in Audenge.
Audenge STR Booking Lead Time Analysis (2026)
Average Booking Lead Time by Month
Booking Lead Time Insights for Audenge
- The overall average booking lead time for vacation rentals in Audenge is 57 days.
- Guests book furthest in advance for stays during August (average 84 days), likely coinciding with peak travel demand or local events.
- The shortest booking windows occur for stays in November (average 24 days), indicating more last-minute travel plans during this time.
- Seasonally, Summer (67 days avg.) sees the longest lead times, while Winter (30 days avg.) has the shortest, reflecting typical travel planning cycles.
Recommendations for Hosts
- Use the overall average lead time (57 days) as a baseline for your pricing and availability strategy in Audenge.
- For August stays, consider implementing length-of-stay discounts or slightly higher rates for bookings made less than 84 days out to capitalize on advance planning.
- Target marketing efforts for the Summer season well in advance (at least 67 days) to capture early planners.
- Monitor your own booking lead times against these Audenge averages to identify opportunities for dynamic pricing adjustments.
Popular & Essential Airbnb Amenities in Audenge (2026)
Amenity Prevalence
Amenity Insights for Audenge
- Popular amenities like Kitchen, Coffee maker, Free parking on premises are common but not universal. Offering these can provide a competitive edge.
- Warning: Wifi is not universally provided but is considered essential globally. Ensure reliable Wifi is offered.
Recommendations for Hosts
- Consider adding popular differentiators like Kitchen or Coffee maker to increase appeal.
- Highlight unique or less common amenities you offer (e.g., hot tub, dedicated workspace, EV charger) in your listing description and photos.
- Regularly check competitor amenities in Audenge to stay competitive.
Audenge Airbnb Guest Demographics & Profile Analysis (2026)
Guest Profile Summary for Audenge
- The typical guest profile for Airbnb in Audenge consists of primarily domestic travelers (87%), often arriving from nearby Paris, typically belonging to the Post-2000s (Gen Z/Alpha) group (50%), primarily speaking French or English.
- Domestic travelers account for 87.0% of guests.
- Key international markets include France (87%) and Germany (2.2%).
- Top languages spoken are French (46.3%) followed by English (31.3%).
- A significant demographic segment is the Post-2000s (Gen Z/Alpha) group, representing 50% of guests.
Recommendations for Hosts
- Target domestic marketing efforts towards travelers from Paris and Bordeaux.
- Tailor amenities and listing descriptions to appeal to the dominant Post-2000s (Gen Z/Alpha) demographic (e.g., highlight fast WiFi, smart home features, local guides).
- Highlight unique local experiences or amenities relevant to the primary guest profile.
- Consider seasonal promotions aligned with peak travel times for key origin markets.
Nearby Short-Term Rental Market Comparison
How does the Audenge Airbnb market stack up against its neighbors? Compare key performance metrics like average monthly revenue, ADR, and occupancy rates in surrounding areas to understand the broader regional STR landscape.
| Market | Active Properties | Monthly Revenue | Daily Rate | Avg. Occupancy |
|---|---|---|---|---|
| San Sebastián | 1,382 | $3,844 | $287.28 | 49% |
| Dima | 11 | $3,301 | $331.95 | 52% |
| Carignan-de-Bordeaux | 34 | $3,140 | $316.66 | 42% |
| Néac | 11 | $3,047 | $441.32 | 38% |
| Lasarte-Oria | 19 | $2,656 | $197.35 | 43% |
| Gautegiz Arteaga | 15 | $2,600 | $312.72 | 35% |
| Gatika | 10 | $2,596 | $437.05 | 33% |
| Cénac | 17 | $2,542 | $307.76 | 44% |
| Saint-Seurin-de-Cadourne | 12 | $2,529 | $378.76 | 33% |
| Saint-Laurent-de-Gosse | 17 | $2,519 | $345.09 | 35% |