Anglet Airbnb Market Analysis 2026: Short Term Rental Data & Vacation Rental Statistics in Nouvelle-Aquitaine, France
Is Airbnb profitable in Anglet in 2026? Explore comprehensive Airbnb analytics for Anglet, Nouvelle-Aquitaine, France to uncover income potential. This 2026 STR market report for Anglet, based on AirROI data from February 2025 to January 2026, reveals key trends in the bustling market of 1,042 active listings.
Whether you're considering an Airbnb investment in Anglet, optimizing your existing vacation rental, or exploring rental arbitrage opportunities, understanding the Anglet Airbnb data is crucial. Navigating the high regulation landscape is key to maximizing your short term rental income potential. Let's dive into the specifics.
Key Anglet Airbnb Performance Metrics Overview
Monthly Airbnb Revenue Variations & Income Potential in Anglet (2026)
Understanding the monthly revenue variations for Airbnb listings in Anglet is key to maximizing your short term rental income potential. Seasonality significantly impacts earnings. Our analysis, based on data from the past 12 months, shows that the peak revenue month for STRs in Anglet is typically August, while February often presents the lowest earnings, highlighting opportunities for strategic pricing adjustments during shoulder and low seasons. Explore the typical Airbnb income in Anglet across different performance tiers:
- Best-in-class properties (Top 10%) achieve $4,516+ monthly, often utilizing dynamic pricing and superior guest experiences.
- Strong performing properties (Top 25%) earn $2,720 or more, indicating effective management and desirable locations/amenities.
- Typical properties (Median) generate around $1,608 per month, representing the average market performance.
- Entry-level properties (Bottom 25%) see earnings around $848, often with potential for optimization.
Average Monthly Airbnb Earnings Trend in Anglet
Anglet Airbnb Occupancy Rate Trends (2026)
Maximize your bookings by understanding the Anglet STR occupancy trends. Seasonal demand shifts significantly influence how often properties are booked. Typically, Augustsees the highest demand (peak season occupancy), while January experiences the lowest (low season). Effective strategies, like adjusting minimum stays or offering promotions, can boost occupancy during slower periods. Here's how different property tiers perform in Anglet:
- Best-in-class properties (Top 10%) achieve 81%+ occupancy, indicating high desirability and potentially optimized availability.
- Strong performing properties (Top 25%) maintain 64% or higher occupancy, suggesting good market fit and guest satisfaction.
- Typical properties (Median) have an occupancy rate around 40%.
- Entry-level properties (Bottom 25%) average 22% occupancy, potentially facing higher vacancy.
Average Monthly Occupancy Rate Trend in Anglet
Average Daily Rate (ADR) Airbnb Trends in Anglet (2026)
Effective short term rental pricing strategy in Anglet involves understanding monthly ADR fluctuations. The Average Daily Rate (ADR) for Airbnb in Anglet typically peaks in August and dips lowest during March. Leveraging Airbnb dynamic pricing tools or strategies based on this seasonality can significantly boost revenue. Here's a look at the typical nightly rates achieved:
- Best-in-class properties (Top 10%) command rates of $419+ per night, often due to premium features or locations.
- Strong performing properties (Top 25%) achieve nightly rates of $216 or more.
- Typical properties (Median) charge around $129 per night.
- Entry-level properties (Bottom 25%) earn around $93 per night.
Average Daily Rate (ADR) Trend by Month in Anglet
Get Live Anglet Market Intelligence 👇

Explore Real-time Analytics
Airbnb Seasonality Analysis & Trends in Anglet (2026)
Peak Season (August, July, September)
- Revenue averages $3,712 per month
- Occupancy rates average 59.8%
- Daily rates average $201
Shoulder Season
- Revenue averages $1,877 per month
- Occupancy maintains around 40.6%
- Daily rates hold near $188
Low Season (January, February, November)
- Revenue drops to average $1,259 per month
- Occupancy decreases to average 31.4%
- Daily rates adjust to average $189
Seasonality Insights for Anglet
- The Airbnb seasonality in Anglet shows highly seasonal trends requiring careful strategy. While the sections above show seasonal averages, it's also insightful to look at the extremes:
- During the high season, the absolute peak month showcases Anglet's highest earning potential, with monthly revenues capable of climbing to $4,419, occupancy reaching a high of 69.2%, and ADRs peaking at $203.
- Conversely, the slowest single month of the year, typically falling within the low season, marks the market's lowest point. In this month, revenue might dip to $1,109, occupancy could drop to 26.5%, and ADRs may adjust down to $178.
- Understanding both the seasonal averages and these monthly peaks and troughs in revenue, occupancy, and ADR is crucial for maximizing your Airbnb profit potential in Anglet.
Seasonal Strategies for Maximizing Profit
- Peak Season: Maximize revenue through premium pricing and potentially longer minimum stays. Ensure high availability.
- Low Season: Offer competitive pricing, special promotions (e.g., extended stay discounts), and flexible cancellation policies. Target off-season travelers like remote workers or budget-conscious guests.
- Shoulder Seasons: Implement dynamic pricing that balances peak and low rates. Target weekend travelers or specific events. Offer slightly more flexible terms than peak season.
- Regularly analyze your own performance against these Anglet seasonality benchmarks and adjust your pricing and availability strategy accordingly.
Best Areas for Airbnb Investment in Anglet (2026)
Exploring the top neighborhoods for short-term rentals in Anglet? This section highlights key areas, outlining why they are attractive for hosts and guests, along with notable local attractions. Consider these locations based on your target guest profile and investment strategy.
| Neighborhood / Area | Why Host Here? (Target Guests & Appeal) | Key Attractions & Landmarks |
|---|---|---|
| Chambre d'Amour | A beautiful beach area known for its surfing and stunning coastline. It attracts beach lovers and surfers looking for vibrant nightlife and water sports. | Chambre d'Amour Beach, Anglet Surf School, La Barre Beach, Promenade des Plages, Local surf shops, Restaurants with ocean views |
| Biarritz City Center | Adjacent to Anglet, Biarritz offers a mix of luxury and charm with a high tourist appeal, making it ideal for short-term rentals. | Biarritz Aquarium, Rocher de la Vierge, Musee de la Mer, La Grande Plage, Luxury boutiques, Spa and wellness centers |
| Trotter Beach | An upscale residential area close to the beach that attracts families and vacationers looking for a quieter experience. | Trotter Beach, Coastal walking paths, Local market, Picnic spots, Family-friendly parks, Nearby cafes |
| Anglet Forest | A tranquil area with beautiful forests and trails, perfect for nature lovers looking to escape the city buzz. | Parc écologique Izadia, Cycle paths, Forested trails, Bird watching, Picnic areas, Nature observation spots |
| Les Sables d'Or | Known for its sandy beaches and beach clubs, this area is popular among young adults and families. | Sables d'Or Beach, Beach clubs, Water sports rentals, Beachside restaurants, Children's play areas, Evening beach events |
| Capbreton | A nearby town with a charming harbor and beaches, drawing both surfers and families. It attracts renters looking for a diverse vacation experience. | Capbreton Surf Beach, Port of Capbreton, Markets, Water sports, Coastal trails, Seafood restaurants |
| Anglet City Center | The heart of Anglet filled with shops and cafes, appealing to travelers who want to be in the middle of local life. | Shopping streets, Local eateries, Cultural events, Art galleries, Cafes and bakeries, Public parks |
| Deauville | A bit further out, but a glamorous coastal retreat known for its casinos and luxury experiences, appealing to affluent tourists. | Deauville Beach, Casino Barrière, Deauville Town Center, Luxury hotels, Horse racing events, Film festivals |
Understanding Airbnb License Requirements & STR Laws in Anglet (2026)
Yes, Anglet, Nouvelle-Aquitaine, France enforces high STR regulations. Obtaining a license and ensuring compliance is almost certainly required according to current 2026 STR laws. Always verify the latest short term rental regulations and Airbnb license requirements directly with local government authorities for Anglet to ensure full compliance before hosting.
(Source: AirROI data, 2026, based on 79% licensed listings)
Top Performing Airbnb Properties in Anglet (2026)
Benchmark your potential! Explore examples of top-performing Airbnb properties in Angletbased on Trailing Twelve Month (TTM) revenue. Analyze their characteristics, revenue, occupancy rate, and ADR to understand what drives success in this market.
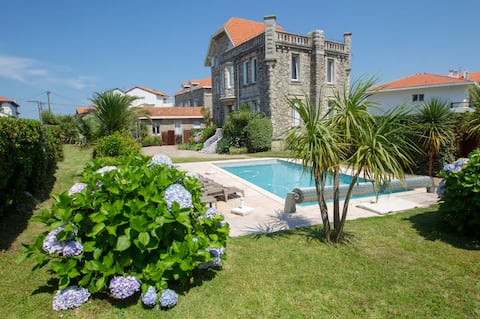
19th century villa/sea view/pool/beach 5 min walk
Entire Place • 4 bedrooms
Merkel Villa: 28 guests, 11 bedrooms, 10 WC, Pool
Entire Place • 11 bedrooms

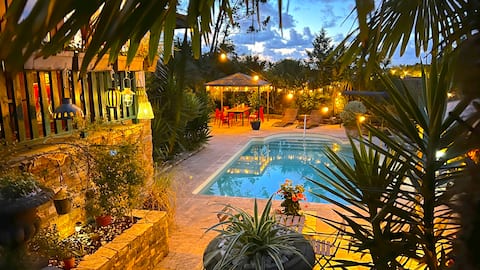
Spring Keyweek - Contemporary villa with pool in
Entire Place • 6 bedrooms
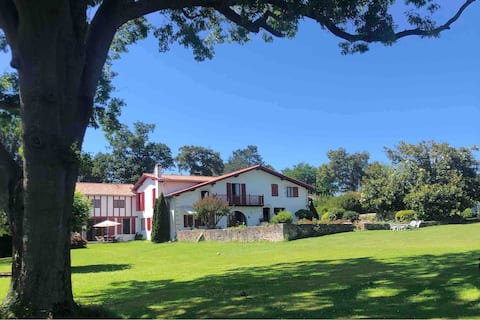
Biarritz-Anglet Listed 18th century Basque Farm
Entire Place • 5 bedrooms
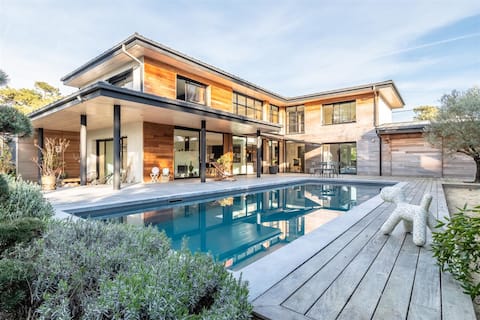
Villa des Pins, design, near the beaches, quiet pool
Entire Place • 4 bedrooms
Beautiful new oceanfront villa
Entire Place • 4 bedrooms
Note: Performance varies based on location, size, amenities, seasonality, and management quality. Data reflects the past 12 months.
Top Performing Airbnb Hosts in Anglet (2026)
Learn from the best! This table showcases top-performing Airbnb hosts in Anglet based on the number of properties managed and estimated total revenue over the past year. Analyze their scale and performance metrics.
| Host Name | Properties | Grossing Revenue | Stay Reviews | Avg Rating |
|---|---|---|---|---|
| Cassy | 12 | $250,061 | 77 | 4.85/5.0 |
| Nicole | 4 | $192,917 | 392 | 4.83/5.0 |
| Nicolas | 2 | $164,903 | 19 | 4.93/5.0 |
| Sandrine | 12 | $155,653 | 800 | 4.88/5.0 |
| Florent | 5 | $129,044 | 1483 | 4.84/5.0 |
| Laurence | 1 | $128,125 | 23 | 4.74/5.0 |
| Welkeys | 6 | $124,687 | 58 | 4.27/5.0 |
| Yaroslava | 1 | $114,687 | 86 | 4.66/5.0 |
| Vanessa | 2 | $110,588 | 131 | 4.99/5.0 |
| Caroline | 1 | $98,261 | 48 | 4.81/5.0 |
Analyzing the strategies of top hosts, such as their property selection, pricing, and guest communication, can offer valuable lessons for optimizing your own Airbnb operations in Anglet.
Dive Deeper: Advanced Anglet STR Market Data (2026)
Ready to unlock more insights? AirROI provides access to advanced metrics and comprehensive Airbnb data for Anglet. Explore detailed analytics beyond this report to refine your investment strategy, optimize pricing, and maximize your vacation rental profits.
Explore Advanced MetricsAnglet Short-Term Rental Market Composition (2026): Property & Room Types
Room Type Distribution
Property Type Distribution
Market Composition Insights for Anglet
- The Anglet Airbnb market composition is heavily skewed towards Entire Home/Apt listings, which make up 89.3% of the 1,042 active rentals. This indicates strong guest preference for privacy and space.
- Looking at the property type distribution in Anglet, Apartment/Condo properties are the most common (65.4%), reflecting the local real estate landscape.
- Houses represent a significant 30.1% portion, catering likely to families or larger groups.
- Smaller segments like hotel/boutique, others, unique stays (combined 4.6%) offer potential for unique stay experiences.
Anglet Airbnb Room Capacity Analysis (2026): Bedroom Distribution
Distribution of Listings by Number of Bedrooms
Room Capacity Insights for Anglet
- The dominant room capacity in Anglet is 1 bedroom listings, making up 34.9% of the market. This suggests a strong demand for properties suitable for couples or solo travelers.
- Together, 1 bedroom and 2 bedrooms properties represent 55.3% of the active Airbnb listings in Anglet, indicating a high concentration in these sizes.
- A significant 23.7% of listings offer 3+ bedrooms, catering to larger groups and families seeking more space in Anglet.
Anglet Vacation Rental Guest Capacity Trends (2026)
Distribution of Listings by Guest Capacity
Guest Capacity Insights for Anglet
- The most common guest capacity trend in Anglet vacation rentals is listings accommodating 4 guests (30.9%). This suggests the primary traveler segment is likely small families or groups.
- Properties designed for 4 guests and 2 guests dominate the Anglet STR market, accounting for 55.2% of listings.
- 25.8% of properties accommodate 6+ guests, serving the market segment for larger families or group travel in Anglet.
- On average, properties in Anglet are equipped to host 3.9 guests.
Anglet Airbnb Booking Patterns (2026): Available vs. Booked Days
Available Days Distribution
Booked Days Distribution
Booking Pattern Insights for Anglet
- The most common availability pattern in Anglet falls within the 271-366 days range, representing 56.9% of listings. This suggests many properties have significant open periods on their calendars.
- Approximately 88.7% of listings show high availability (181+ days open annually), indicating potential for increased bookings or specific owner usage patterns.
- For booked days, the 31-90 days range is most frequent in Anglet (39.9%), reflecting common guest stay durations or potential owner blocking patterns.
- A notable 12.2% of properties secure long booking periods (181+ days booked per year), highlighting successful long-term rental strategies or significant owner usage.
Anglet Airbnb Minimum Stay Requirements Analysis
Distribution of Listings by Minimum Night Requirement
1 Night
72 listings
6.9% of total
2 Nights
95 listings
9.1% of total
3 Nights
61 listings
5.9% of total
4-6 Nights
257 listings
24.7% of total
7-29 Nights
121 listings
11.6% of total
30+ Nights
436 listings
41.8% of total
Key Insights
- The most prevalent minimum stay requirement in Anglet is 30+ Nights, adopted by 41.8% of listings. This highlights the market's preference for longer commitments.
- Very short stays (1-2 nights) are less common (16.0%), suggesting hosts prefer slightly longer bookings to optimize turnover.
- A significant segment (41.8%) caters to monthly stays (30+ nights) in Anglet, pointing to opportunities in the extended-stay market.
Recommendations
- Align with the market by considering a 30+ Nights minimum stay, as 41.8% of Anglet hosts use this setting.
- If feasible, allowing 1-night stays, especially midweek or during low season, could capture last-minute bookings, as only 6.9% currently do.
- Explore offering discounts for stays of 30+ nights to attract the 41.8% of the market seeking extended stays.
- Adjust minimum nights based on seasonality – potentially shorter during low season and longer during peak demand periods in Anglet.
Anglet Airbnb Cancellation Policy Trends Analysis (2026)
Super Strict 30 Days
4 listings
0.4% of total
Limited
5 listings
0.5% of total
Flexible
162 listings
15.6% of total
Moderate
231 listings
22.2% of total
Firm
464 listings
44.6% of total
Strict
174 listings
16.7% of total
Cancellation Policy Insights for Anglet
- The prevailing Airbnb cancellation policy trend in Anglet is Firm, used by 44.6% of listings.
- A majority (61.3%) of hosts in Anglet utilize Firm or Strict policies, indicating a market where hosts prioritize booking security.
Recommendations for Hosts
- Consider adopting a Firm policy to align with the 44.6% market standard in Anglet.
- Regularly review your cancellation policy against competitors and market demand shifts in Anglet.
Anglet STR Booking Lead Time Analysis (2026)
Average Booking Lead Time by Month
Booking Lead Time Insights for Anglet
- The overall average booking lead time for vacation rentals in Anglet is 68 days.
- Guests book furthest in advance for stays during August (average 82 days), likely coinciding with peak travel demand or local events.
- The shortest booking windows occur for stays in February (average 30 days), indicating more last-minute travel plans during this time.
- Seasonally, Summer (73 days avg.) sees the longest lead times, while Winter (34 days avg.) has the shortest, reflecting typical travel planning cycles.
Recommendations for Hosts
- Use the overall average lead time (68 days) as a baseline for your pricing and availability strategy in Anglet.
- For August stays, consider implementing length-of-stay discounts or slightly higher rates for bookings made less than 82 days out to capitalize on advance planning.
- Target marketing efforts for the Summer season well in advance (at least 73 days) to capture early planners.
- Monitor your own booking lead times against these Anglet averages to identify opportunities for dynamic pricing adjustments.
Popular & Essential Airbnb Amenities in Anglet (2026)
Amenity Prevalence
Amenity Insights for Anglet
- Popular amenities like Kitchen, Free parking on premises, Wifi are common but not universal. Offering these can provide a competitive edge.
- Warning: Wifi is not universally provided but is considered essential globally. Ensure reliable Wifi is offered.
Recommendations for Hosts
- Consider adding popular differentiators like Kitchen or Free parking on premises to increase appeal.
- Highlight unique or less common amenities you offer (e.g., hot tub, dedicated workspace, EV charger) in your listing description and photos.
- Regularly check competitor amenities in Anglet to stay competitive.
Anglet Airbnb Guest Demographics & Profile Analysis (2026)
Guest Profile Summary for Anglet
- The typical guest profile for Airbnb in Anglet consists of primarily domestic travelers (78%), often arriving from nearby Paris, typically belonging to the Post-2000s (Gen Z/Alpha) group (50%), primarily speaking French or English.
- Domestic travelers account for 78.2% of guests.
- Key international markets include France (78.2%) and Spain (4.7%).
- Top languages spoken are French (38.3%) followed by English (34.5%).
- A significant demographic segment is the Post-2000s (Gen Z/Alpha) group, representing 50% of guests.
Recommendations for Hosts
- Target domestic marketing efforts towards travelers from Paris and Toulouse.
- Tailor amenities and listing descriptions to appeal to the dominant Post-2000s (Gen Z/Alpha) demographic (e.g., highlight fast WiFi, smart home features, local guides).
- Highlight unique local experiences or amenities relevant to the primary guest profile.
- Consider seasonal promotions aligned with peak travel times for key origin markets.
Nearby Short-Term Rental Market Comparison
How does the Anglet Airbnb market stack up against its neighbors? Compare key performance metrics like average monthly revenue, ADR, and occupancy rates in surrounding areas to understand the broader regional STR landscape.
| Market | Active Properties | Monthly Revenue | Daily Rate | Avg. Occupancy |
|---|---|---|---|---|
| San Sebastián | 1,382 | $3,844 | $287.28 | 49% |
| Dima | 11 | $3,301 | $331.95 | 52% |
| Carignan-de-Bordeaux | 34 | $3,140 | $316.66 | 42% |
| Néac | 11 | $3,047 | $441.32 | 38% |
| Lasarte-Oria | 19 | $2,656 | $197.35 | 43% |
| Gautegiz Arteaga | 15 | $2,600 | $312.72 | 35% |
| Gatika | 10 | $2,596 | $437.05 | 33% |
| Cénac | 17 | $2,542 | $307.76 | 44% |
| Larraun | 17 | $2,530 | $246.29 | 38% |
| Saint-Laurent-de-Gosse | 17 | $2,519 | $345.09 | 35% |