Villainville Airbnb Market Analysis 2025: Short Term Rental Data & Vacation Rental Statistics in Normandy, France
Is Airbnb profitable in Villainville in 2025? Explore comprehensive Airbnb analytics for Villainville, Normandy, France to uncover income potential. This 2025 STR market report for Villainville, based on AirROI data from November 2024 to October 2025, reveals key trends in the niche market of 17 active listings.
Whether you're considering an Airbnb investment in Villainville, optimizing your existing vacation rental, or exploring rental arbitrage opportunities, understanding the Villainville Airbnb data is crucial. Leveraging the low regulation environment is key to maximizing your short term rental income potential. Let's dive into the specifics.
Key Villainville Airbnb Performance Metrics Overview
Monthly Airbnb Revenue Variations & Income Potential in Villainville (2025)
Understanding the monthly revenue variations for Airbnb listings in Villainville is key to maximizing your short term rental income potential. Seasonality significantly impacts earnings. Our analysis, based on data from the past 12 months, shows that the peak revenue month for STRs in Villainville is typically July, while November often presents the lowest earnings, highlighting opportunities for strategic pricing adjustments during shoulder and low seasons. Explore the typical Airbnb income in Villainville across different performance tiers:
- Best-in-class properties (Top 10%) achieve $3,116+ monthly, often utilizing dynamic pricing and superior guest experiences.
- Strong performing properties (Top 25%) earn $1,930 or more, indicating effective management and desirable locations/amenities.
- Typical properties (Median) generate around $1,066 per month, representing the average market performance.
- Entry-level properties (Bottom 25%) see earnings around $653, often with potential for optimization.
Average Monthly Airbnb Earnings Trend in Villainville
Villainville Airbnb Occupancy Rate Trends (2025)
Maximize your bookings by understanding the Villainville STR occupancy trends. Seasonal demand shifts significantly influence how often properties are booked. Typically, Augustsees the highest demand (peak season occupancy), while January experiences the lowest (low season). Effective strategies, like adjusting minimum stays or offering promotions, can boost occupancy during slower periods. Here's how different property tiers perform in Villainville:
- Best-in-class properties (Top 10%) achieve 66%+ occupancy, indicating high desirability and potentially optimized availability.
- Strong performing properties (Top 25%) maintain 51% or higher occupancy, suggesting good market fit and guest satisfaction.
- Typical properties (Median) have an occupancy rate around 31%.
- Entry-level properties (Bottom 25%) average 16% occupancy, potentially facing higher vacancy.
Average Monthly Occupancy Rate Trend in Villainville
Average Daily Rate (ADR) Airbnb Trends in Villainville (2025)
Effective short term rental pricing strategy in Villainville involves understanding monthly ADR fluctuations. The Average Daily Rate (ADR) for Airbnb in Villainville typically peaks in August and dips lowest during March. Leveraging Airbnb dynamic pricing tools or strategies based on this seasonality can significantly boost revenue. Here's a look at the typical nightly rates achieved:
- Best-in-class properties (Top 10%) command rates of $306+ per night, often due to premium features or locations.
- Strong performing properties (Top 25%) achieve nightly rates of $182 or more.
- Typical properties (Median) charge around $109 per night.
- Entry-level properties (Bottom 25%) earn around $89 per night.
Average Daily Rate (ADR) Trend by Month in Villainville
Get Live Villainville Market Intelligence 👇

Explore Real-time Analytics
Airbnb Seasonality Analysis & Trends in Villainville (2025)
Peak Season (July, August, April)
- Revenue averages $2,263 per month
- Occupancy rates average 50.4%
- Daily rates average $162
Shoulder Season
- Revenue averages $1,512 per month
- Occupancy maintains around 30.9%
- Daily rates hold near $154
Low Season (February, March, November)
- Revenue drops to average $843 per month
- Occupancy decreases to average 30.5%
- Daily rates adjust to average $142
Seasonality Insights for Villainville
- The Airbnb seasonality in Villainville shows highly seasonal trends requiring careful strategy. While the sections above show seasonal averages, it's also insightful to look at the extremes:
- During the high season, the absolute peak month showcases Villainville's highest earning potential, with monthly revenues capable of climbing to $2,402, occupancy reaching a high of 57.5%, and ADRs peaking at $172.
- Conversely, the slowest single month of the year, typically falling within the low season, marks the market's lowest point. In this month, revenue might dip to $773, occupancy could drop to 20.7%, and ADRs may adjust down to $139.
- Understanding both the seasonal averages and these monthly peaks and troughs in revenue, occupancy, and ADR is crucial for maximizing your Airbnb profit potential in Villainville.
Seasonal Strategies for Maximizing Profit
- Peak Season: Maximize revenue through premium pricing and potentially longer minimum stays. Ensure high availability.
- Low Season: Offer competitive pricing, special promotions (e.g., extended stay discounts), and flexible cancellation policies. Target off-season travelers like remote workers or budget-conscious guests.
- Shoulder Seasons: Implement dynamic pricing that balances peak and low rates. Target weekend travelers or specific events. Offer slightly more flexible terms than peak season.
- Regularly analyze your own performance against these Villainville seasonality benchmarks and adjust your pricing and availability strategy accordingly.
Best Areas for Airbnb Investment in Villainville (2025)
Exploring the top neighborhoods for short-term rentals in Villainville? This section highlights key areas, outlining why they are attractive for hosts and guests, along with notable local attractions. Consider these locations based on your target guest profile and investment strategy.
| Neighborhood / Area | Why Host Here? (Target Guests & Appeal) | Key Attractions & Landmarks |
|---|---|---|
| Honfleur | Charming coastal town known for its picturesque harbor, historic buildings, and vibrant arts scene. Ideal for tourists looking for a charming getaway and proximity to the Normandy beaches. | Vieux Bassin, Sainte-Catherine Church, Honfleur Museum of Ethnography and the Old Port, Naturospace, Les Maisons Satie |
| Deauville | Famous for its sandy beaches and upscale resorts, Deauville is a glamorous destination for tourists and wealthy visitors. Ideal for luxury vacation rentals and events. | Deauville Beach, La Touques Racecourse, Les Planches, Deauville International Centre, Villa Strassburger |
| Étretat | Known for its stunning cliffs and breathtaking seascapes. A popular destination for nature lovers and photographers looking to explore the dramatic coastline. | Étretat Cliffs, Falaise d'Aval, Chapelle Notre-Dame de la Garde, Les Jardins d'Étretat, Seine-Maritime Museum |
| Rouen | A historic city with a rich history and beautiful architecture. Great for visitors interested in culture, history, and art. | Rouen Cathedral, Gros Horloge, Museum of Fine Arts, Joan of Arc Historial, Palais de Justice |
| Caen | Known for its historical significance in WWII and its beautiful castles, Caen attracts both history buffs and tourists interested in exploring Normandy. | Caen Memorial Museum, Château de Caen, Abbey of Saint-Étienne, Abbey of Sainte-Trinité, Jardin des Plantes |
| Bayeux | Famous for the Bayeux Tapestry and beautiful medieval architecture, Bayeux is a great spot for tourists seeking history and art. | Bayeux Tapestry Museum, Bayeux Cathedral, Museum of the Battle of Normandy, Jardin botanique de Bayeux, Maisons de la Londe |
| Lisieux | A small town with a rich religious history and beautiful basilicas, Lisieux is attractive for pilgrims and tourists looking for a quieter experience. | Basilica of Sainte-Thérèse, Lisieux Cathedral, Musee d'Art et d'Histoire de Lisieux, Castle of Saint-Germain-de-Livet, Parc des Expositions |
| Fécamp | A coastal town known for its beautiful cliffs and maritime heritage. Great for those looking to explore the natural beauty and history of Normandy. | Fécamp Beach, Palais des Ducs de Normandie, Abbey of Fécamp, Les Jardins de la Mer, Cap Fagnet |
Understanding Airbnb License Requirements & STR Laws in Villainville (2025)
While Villainville, Normandy, France currently shows low STR regulations, specific Airbnb license requirements might still exist or change. Always verify the latest short term rental regulations and Airbnb license requirements directly with local government authorities for Villainville to ensure full compliance before hosting.
(Source: AirROI data, 2025, based on 6% licensed listings)
Top Performing Airbnb Properties in Villainville (2025)
Benchmark your potential! Explore examples of top-performing Airbnb properties in Villainvillebased on Trailing Twelve Month (TTM) revenue. Analyze their characteristics, revenue, occupancy rate, and ADR to understand what drives success in this market.
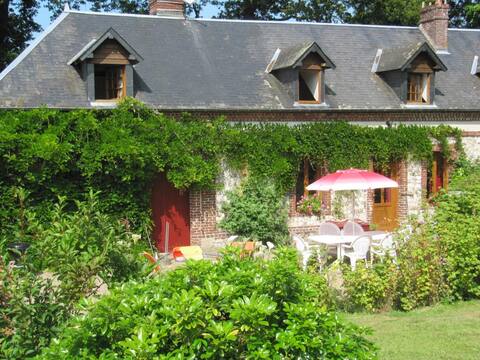
Bucolic & relaxing portrait 13 pers
Entire Place • 6 bedrooms
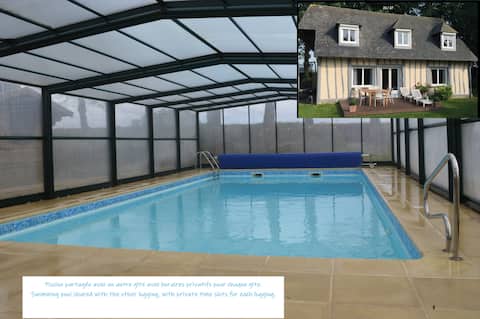
8p gîte near Étretat – Heated pool and sauna
Entire Place • 4 bedrooms

1-bedroom cottage for 4 people
Entire Place • 1 bedroom

Gîte des Prés holiday home 8 km from Étretat
Entire Place • 2 bedrooms

Studio cottage 5 km from Étretat
Entire Place • 1 bedroom

Impressionist painters' gite
Entire Place • 4 bedrooms
Note: Performance varies based on location, size, amenities, seasonality, and management quality. Data reflects the past 12 months.
Top Performing Airbnb Hosts in Villainville (2025)
Learn from the best! This table showcases top-performing Airbnb hosts in Villainville based on the number of properties managed and estimated total revenue over the past year. Analyze their scale and performance metrics.
| Host Name | Properties | Grossing Revenue | Stay Reviews | Avg Rating |
|---|---|---|---|---|
| Rachel | 5 | $78,913 | 106 | 4.49/5.0 |
| Florian | 3 | $57,772 | 766 | 4.86/5.0 |
| Gaëtan | 5 | $47,606 | 39 | 4.64/5.0 |
| Emilie | 2 | $35,482 | 22 | 4.86/5.0 |
| Michel | 1 | $22,231 | 217 | 4.85/5.0 |
| Tatiana | 1 | $5,340 | 64 | 4.91/5.0 |
Analyzing the strategies of top hosts, such as their property selection, pricing, and guest communication, can offer valuable lessons for optimizing your own Airbnb operations in Villainville.
Dive Deeper: Advanced Villainville STR Market Data (2025)
Ready to unlock more insights? AirROI provides access to advanced metrics and comprehensive Airbnb data for Villainville. Explore detailed analytics beyond this report to refine your investment strategy, optimize pricing, and maximize your vacation rental profits.
Explore Advanced MetricsVillainville Short-Term Rental Market Composition (2025): Property & Room Types
Room Type Distribution
Property Type Distribution
Market Composition Insights for Villainville
- The Villainville Airbnb market composition is heavily skewed towards Entire Home/Apt listings, which make up 88.2% of the 17 active rentals. This indicates strong guest preference for privacy and space.
- Looking at the property type distribution in Villainville, House properties are the most common (76.5%), reflecting the local real estate landscape.
- Houses represent a significant 76.5% portion, catering likely to families or larger groups.
- The presence of 5.9% Hotel/Boutique listings indicates integration with traditional hospitality.
Villainville Airbnb Room Capacity Analysis (2025): Bedroom Distribution
Distribution of Listings by Number of Bedrooms
Room Capacity Insights for Villainville
- The dominant room capacity in Villainville is 1 bedroom listings, making up 29.4% of the market. This suggests a strong demand for properties suitable for couples or solo travelers.
- Together, 1 bedroom and 3 bedrooms properties represent 52.9% of the active Airbnb listings in Villainville, indicating a high concentration in these sizes.
- A significant 52.9% of listings offer 3+ bedrooms, catering to larger groups and families seeking more space in Villainville.
Villainville Vacation Rental Guest Capacity Trends (2025)
Distribution of Listings by Guest Capacity
Guest Capacity Insights for Villainville
- The most common guest capacity trend in Villainville vacation rentals is listings accommodating 4 guests (35.3%). This suggests the primary traveler segment is likely small families or groups.
- Properties designed for 4 guests and 8+ guests dominate the Villainville STR market, accounting for 64.7% of listings.
- 47.1% of properties accommodate 6+ guests, serving the market segment for larger families or group travel in Villainville.
- On average, properties in Villainville are equipped to host 5.1 guests.
Villainville Airbnb Booking Patterns (2025): Available vs. Booked Days
Available Days Distribution
Booked Days Distribution
Booking Pattern Insights for Villainville
- The most common availability pattern in Villainville falls within the 271-366 days range, representing 58.8% of listings. This suggests many properties have significant open periods on their calendars.
- Approximately 82.3% of listings show high availability (181+ days open annually), indicating potential for increased bookings or specific owner usage patterns.
- For booked days, the 31-90 days range is most frequent in Villainville (47.1%), reflecting common guest stay durations or potential owner blocking patterns.
- A notable 17.6% of properties secure long booking periods (181+ days booked per year), highlighting successful long-term rental strategies or significant owner usage.
Villainville Airbnb Minimum Stay Requirements Analysis
Distribution of Listings by Minimum Night Requirement
1 Night
2 listings
11.8% of total
2 Nights
9 listings
52.9% of total
30+ Nights
6 listings
35.3% of total
Key Insights
- The most prevalent minimum stay requirement in Villainville is 2 Nights, adopted by 52.9% of listings. This highlights the market's preference for shorter, flexible bookings.
- A strong majority (64.7%) of the Villainville Airbnb data shows acceptance of very short stays (1-2 nights), indicating a dynamic, high-turnover market.
- A significant segment (35.3%) caters to monthly stays (30+ nights) in Villainville, pointing to opportunities in the extended-stay market.
Recommendations
- Align with the market by considering a 2 Nights minimum stay, as 52.9% of Villainville hosts use this setting.
- If feasible, allowing 1-night stays, especially midweek or during low season, could capture last-minute bookings, as only 11.8% currently do.
- A 2-night minimum appears standard (52.9%). Consider this for weekends or peak periods.
- Explore offering discounts for stays of 30+ nights to attract the 35.3% of the market seeking extended stays.
- Adjust minimum nights based on seasonality – potentially shorter during low season and longer during peak demand periods in Villainville.
Villainville Airbnb Cancellation Policy Trends Analysis (2025)
Flexible
1 listings
5.9% of total
Moderate
9 listings
52.9% of total
Firm
5 listings
29.4% of total
Strict
2 listings
11.8% of total
Cancellation Policy Insights for Villainville
- The prevailing Airbnb cancellation policy trend in Villainville is Moderate, used by 52.9% of listings.
- There's a relatively balanced mix between guest-friendly (58.8%) and stricter (41.2%) policies, offering choices for different guest needs.
Recommendations for Hosts
- Consider adopting a Moderate policy to align with the 52.9% market standard in Villainville.
- Using a Strict policy might deter some guests, as only 11.8% of listings use it. Evaluate if potential revenue protection outweighs possible lower booking rates.
- Regularly review your cancellation policy against competitors and market demand shifts in Villainville.
Villainville STR Booking Lead Time Analysis (2025)
Average Booking Lead Time by Month
Booking Lead Time Insights for Villainville
- The overall average booking lead time for vacation rentals in Villainville is 47 days.
- Guests book furthest in advance for stays during August (average 83 days), likely coinciding with peak travel demand or local events.
- The shortest booking windows occur for stays in February (average 10 days), indicating more last-minute travel plans during this time.
- Seasonally, Summer (77 days avg.) sees the longest lead times, while Winter (16 days avg.) has the shortest, reflecting typical travel planning cycles.
Recommendations for Hosts
- Use the overall average lead time (47 days) as a baseline for your pricing and availability strategy in Villainville.
- For August stays, consider implementing length-of-stay discounts or slightly higher rates for bookings made less than 83 days out to capitalize on advance planning.
- During February, focus on last-minute booking availability and promotions, as guests book with very short notice (10 days avg.).
- Target marketing efforts for the Summer season well in advance (at least 77 days) to capture early planners.
- Monitor your own booking lead times against these Villainville averages to identify opportunities for dynamic pricing adjustments.
Popular & Essential Airbnb Amenities in Villainville (2025)
Amenity Prevalence
Amenity Insights for Villainville
- Essential amenities in Villainville that guests expect include: Hot water, Heating, Free parking on premises. Lacking these (any) could significantly impact bookings.
- Popular amenities like Long term stays allowed, Refrigerator, Wifi are common but not universal. Offering these can provide a competitive edge.
- Warning: Wifi is not universally provided but is considered essential globally. Ensure reliable Wifi is offered.
Recommendations for Hosts
- Ensure your listing includes all essential amenities for Villainville: Hot water, Heating, Free parking on premises.
- Consider adding popular differentiators like Long term stays allowed or Refrigerator to increase appeal.
- Highlight unique or less common amenities you offer (e.g., hot tub, dedicated workspace, EV charger) in your listing description and photos.
- Regularly check competitor amenities in Villainville to stay competitive.
Villainville Airbnb Guest Demographics & Profile Analysis (2025)
Guest Profile Summary for Villainville
- The typical guest profile for Airbnb in Villainville consists of primarily domestic travelers (85%), often arriving from nearby Paris, typically belonging to the Post-2000s (Gen Z/Alpha) group (50%), primarily speaking French or English.
- Domestic travelers account for 84.8% of guests.
- Key international markets include France (84.8%) and Belgium (6.1%).
- Top languages spoken are French (43.8%) followed by English (33.9%).
- A significant demographic segment is the Post-2000s (Gen Z/Alpha) group, representing 50% of guests.
Recommendations for Hosts
- Target domestic marketing efforts towards travelers from Paris and Lille.
- Tailor amenities and listing descriptions to appeal to the dominant Post-2000s (Gen Z/Alpha) demographic (e.g., highlight fast WiFi, smart home features, local guides).
- Highlight unique local experiences or amenities relevant to the primary guest profile.
- Consider seasonal promotions aligned with peak travel times for key origin markets.
Nearby Short-Term Rental Market Comparison
How does the Villainville Airbnb market stack up against its neighbors? Compare key performance metrics like average monthly revenue, ADR, and occupancy rates in surrounding areas to understand the broader regional STR landscape.
| Market | Active Properties | Monthly Revenue | Daily Rate | Avg. Occupancy |
|---|---|---|---|---|
| La Couture-Boussey | 11 | $4,496 | $460.91 | 29% |
| La Poterie-Cap-d'Antifer | 15 | $3,950 | $276.53 | 48% |
| Saint-Pierre-du-Val | 15 | $3,722 | $354.69 | 38% |
| Saint-Étienne-la-Thillaye | 24 | $3,611 | $400.19 | 35% |
| Muids | 14 | $3,391 | $409.94 | 35% |
| Roedean | 53 | $3,384 | $278.67 | 44% |
| Mesnils-sur-Iton | 25 | $3,340 | $354.66 | 38% |
| Caumont | 10 | $3,298 | $232.29 | 44% |
| Tourouvre au Perche | 28 | $3,258 | $264.29 | 40% |
| Petiville | 12 | $3,237 | $393.31 | 30% |