Rouen Airbnb Market Analysis 2026: Short Term Rental Data & Vacation Rental Statistics in Normandy, France
Is Airbnb profitable in Rouen in 2026? Explore comprehensive Airbnb analytics for Rouen, Normandy, France to uncover income potential. This 2026 STR market report for Rouen, based on AirROI data from February 2025 to January 2026, reveals key trends in the bustling market of 1,437 active listings.
Whether you're considering an Airbnb investment in Rouen, optimizing your existing vacation rental, or exploring rental arbitrage opportunities, understanding the Rouen Airbnb data is crucial. Understanding the local regulations is key to maximizing your short term rental income potential. Let's dive into the specifics.
Key Rouen Airbnb Performance Metrics Overview
Monthly Airbnb Revenue Variations & Income Potential in Rouen (2026)
Understanding the monthly revenue variations for Airbnb listings in Rouen is key to maximizing your short term rental income potential. Seasonality significantly impacts earnings. Our analysis, based on data from the past 12 months, shows that the peak revenue month for STRs in Rouen is typically August, while January often presents the lowest earnings, highlighting opportunities for strategic pricing adjustments during shoulder and low seasons. Explore the typical Airbnb income in Rouen across different performance tiers:
- Best-in-class properties (Top 10%) achieve $2,360+ monthly, often utilizing dynamic pricing and superior guest experiences.
- Strong performing properties (Top 25%) earn $1,585 or more, indicating effective management and desirable locations/amenities.
- Typical properties (Median) generate around $964 per month, representing the average market performance.
- Entry-level properties (Bottom 25%) see earnings around $486, often with potential for optimization.
Average Monthly Airbnb Earnings Trend in Rouen
Rouen Airbnb Occupancy Rate Trends (2026)
Maximize your bookings by understanding the Rouen STR occupancy trends. Seasonal demand shifts significantly influence how often properties are booked. Typically, Augustsees the highest demand (peak season occupancy), while January experiences the lowest (low season). Effective strategies, like adjusting minimum stays or offering promotions, can boost occupancy during slower periods. Here's how different property tiers perform in Rouen:
- Best-in-class properties (Top 10%) achieve 81%+ occupancy, indicating high desirability and potentially optimized availability.
- Strong performing properties (Top 25%) maintain 65% or higher occupancy, suggesting good market fit and guest satisfaction.
- Typical properties (Median) have an occupancy rate around 42%.
- Entry-level properties (Bottom 25%) average 22% occupancy, potentially facing higher vacancy.
Average Monthly Occupancy Rate Trend in Rouen
Average Daily Rate (ADR) Airbnb Trends in Rouen (2026)
Effective short term rental pricing strategy in Rouen involves understanding monthly ADR fluctuations. The Average Daily Rate (ADR) for Airbnb in Rouen typically peaks in September and dips lowest during March. Leveraging Airbnb dynamic pricing tools or strategies based on this seasonality can significantly boost revenue. Here's a look at the typical nightly rates achieved:
- Best-in-class properties (Top 10%) command rates of $149+ per night, often due to premium features or locations.
- Strong performing properties (Top 25%) achieve nightly rates of $102 or more.
- Typical properties (Median) charge around $72 per night.
- Entry-level properties (Bottom 25%) earn around $54 per night.
Average Daily Rate (ADR) Trend by Month in Rouen
Get Live Rouen Market Intelligence 👇

Explore Real-time Analytics
Airbnb Seasonality Analysis & Trends in Rouen (2026)
Peak Season (August, July, October)
- Revenue averages $1,410 per month
- Occupancy rates average 49.3%
- Daily rates average $94
Shoulder Season
- Revenue averages $1,189 per month
- Occupancy maintains around 44.4%
- Daily rates hold near $92
Low Season (January, February, March)
- Revenue drops to average $929 per month
- Occupancy decreases to average 39.2%
- Daily rates adjust to average $86
Seasonality Insights for Rouen
- The Airbnb seasonality in Rouen shows moderate seasonality with distinct peak and low periods. While the sections above show seasonal averages, it's also insightful to look at the extremes:
- During the high season, the absolute peak month showcases Rouen's highest earning potential, with monthly revenues capable of climbing to $1,499, occupancy reaching a high of 51.7%, and ADRs peaking at $97.
- Conversely, the slowest single month of the year, typically falling within the low season, marks the market's lowest point. In this month, revenue might dip to $864, occupancy could drop to 32.1%, and ADRs may adjust down to $82.
- Understanding both the seasonal averages and these monthly peaks and troughs in revenue, occupancy, and ADR is crucial for maximizing your Airbnb profit potential in Rouen.
Seasonal Strategies for Maximizing Profit
- Peak Season: Maximize revenue through premium pricing and potentially longer minimum stays. Ensure high availability.
- Low Season: Offer competitive pricing, special promotions (e.g., extended stay discounts), and flexible cancellation policies. Target off-season travelers like remote workers or budget-conscious guests.
- Shoulder Seasons: Implement dynamic pricing that balances peak and low rates. Target weekend travelers or specific events. Offer slightly more flexible terms than peak season.
- Regularly analyze your own performance against these Rouen seasonality benchmarks and adjust your pricing and availability strategy accordingly.
Best Areas for Airbnb Investment in Rouen (2026)
Exploring the top neighborhoods for short-term rentals in Rouen? This section highlights key areas, outlining why they are attractive for hosts and guests, along with notable local attractions. Consider these locations based on your target guest profile and investment strategy.
| Neighborhood / Area | Why Host Here? (Target Guests & Appeal) | Key Attractions & Landmarks |
|---|---|---|
| Historic City Center | The heart of Rouen, known for its stunning Gothic architecture and historical significance. It's a top choice for tourists who want to explore ancient streets, museums, and landmarks. | Rouen Cathedral, Gros Horloge, Museum of Fine Arts, Place du Vieux-Marché, Sainte-Jeanne-d'Arc Church |
| Saint-Marc | A peaceful residential area that offers a great blend of local life and proximity to the city center. Attractive to families and longer-stay travelers looking for comfort and convenience. | Parc de la Hêtraie, local markets, Saint-Marc Church, Cultural centers, family-friendly parks |
| Saint-Sever | A vibrant neighborhood with a mix of commercial and residential areas. Ideal for visitors who enjoy shopping and dining and want to experience the local culture. | Saint-Sever Shopping Center, Riverside walks, local cafes, open-air markets, Cultural events |
| Jardin des Plantes | Known for its beautiful botanical gardens and serene environment. Excellent for nature lovers and those wanting a quiet retreat while still being close to city attractions. | Jardin des Plantes, Botanical gardens, natural history museum, walking paths, outdoor art exhibitions |
| Coteaux de Rouen | This hilly area offers stunning views of the city and the Seine River. Popular with visitors who appreciate scenic walks and outdoor activities. | Mont Saint-Catherine, hiking trails, wine tasting at local estates, panoramic city views, nature parks |
| Rouen Rive Droite | A lively area on the right bank of the Seine River, known for its bars, restaurants, and arts scene. Perfect for a younger crowd looking for nightlife and entertainment. | Gare de Rouen, local nightlife, art galleries, streets filled with restaurants, music venues |
| Tourville-la-Rivière | Located just outside Rouen, this suburban area is ideal for families or those looking for quieter accommodations close to the city. Offers a taste of Normandy's charm. | local parks, family-friendly activities, easy access to Rouen, Normandy countryside, village charm |
| Mont-Saint-Aignan | A suburban community with good schools and residential appeal. Attractive to business travelers and families looking for a peaceful stay near Rouen. | La Bouille park, local gastronomy, easy access to city center, cultural activities, sports facilities |
Understanding Airbnb License Requirements & STR Laws in Rouen (2026)
With 14% of listings showing registration in 2026, understanding potential Airbnb license requirements is crucial in Rouen. Always verify the latest short term rental regulations and Airbnb license requirements directly with local government authorities for Rouen to ensure full compliance before hosting.
(Source: AirROI data, 2026, based on 14% licensed listings)
Top Performing Airbnb Properties in Rouen (2026)
Benchmark your potential! Explore examples of top-performing Airbnb properties in Rouenbased on Trailing Twelve Month (TTM) revenue. Analyze their characteristics, revenue, occupancy rate, and ADR to understand what drives success in this market.

Le Loft Rouennais – Pool/Jacuzzi & Sauna 15p
Entire Place • 6 bedrooms
Old stable near the station
Entire Place • 4 bedrooms
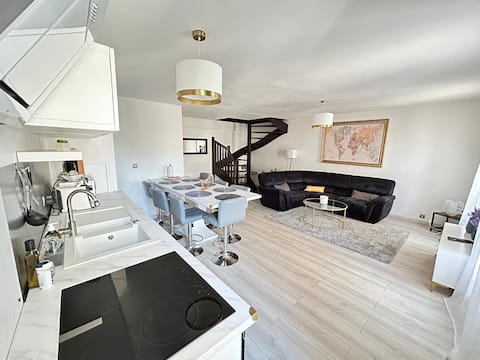
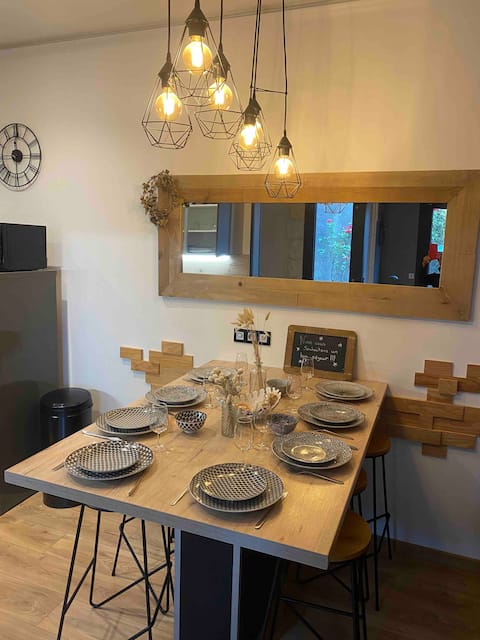
Spacious Duplex in the hyper center Linens Provided
Entire Place • 4 bedrooms
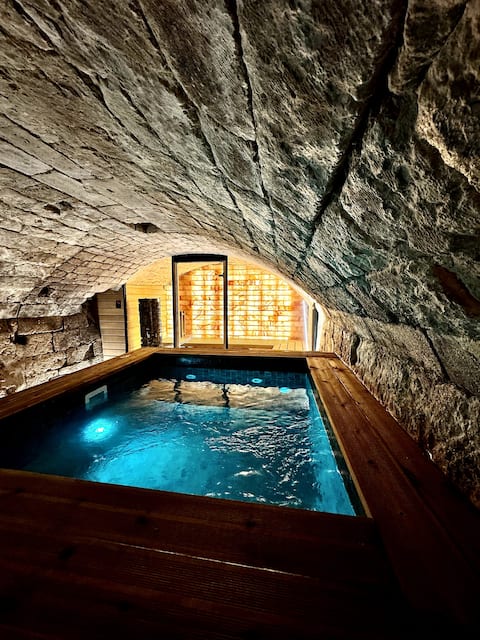
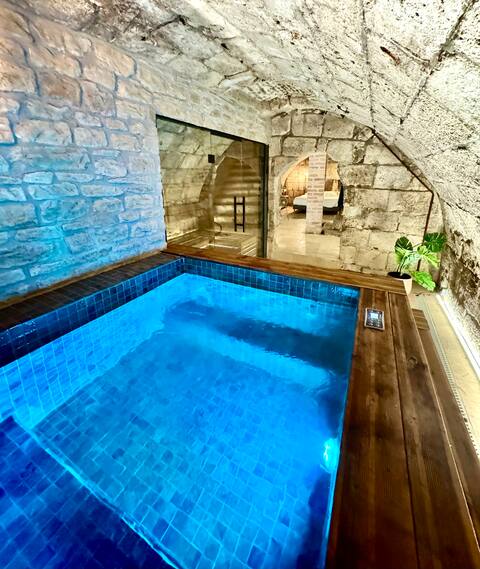
Le Spa Léon – Jacuzzi, private sauna and parking
Entire Place • 1 bedroom
Impressionist Spa – Hot Tub, Sauna
Entire Place • 2 bedrooms
Gaalor Spa***** - Rouen Center 8P Jacuzzi Sauna PK
Entire Place • 2 bedrooms
Note: Performance varies based on location, size, amenities, seasonality, and management quality. Data reflects the past 12 months.
Top Performing Airbnb Hosts in Rouen (2026)
Learn from the best! This table showcases top-performing Airbnb hosts in Rouen based on the number of properties managed and estimated total revenue over the past year. Analyze their scale and performance metrics.
| Host Name | Properties | Grossing Revenue | Stay Reviews | Avg Rating |
|---|---|---|---|---|
| Yann | 64 | $1,014,981 | 3669 | 4.64/5.0 |
| ArchiDuchesse | 89 | $980,740 | 2198 | 4.46/5.0 |
| Rouen Pour Une Nuit | 87 | $513,538 | 1160 | 4.14/5.0 |
| Mathieu | 8 | $295,680 | 874 | 4.69/5.0 |
| Escapade | 26 | $285,925 | 2006 | 4.46/5.0 |
| Julien | 25 | $214,136 | 675 | 4.30/5.0 |
| Nicolas | 20 | $198,522 | 961 | 4.70/5.0 |
| Julien | 23 | $181,231 | 1706 | 4.76/5.0 |
| M&A Conciergerie | 19 | $165,276 | 627 | 4.77/5.0 |
| Sébastien | 7 | $164,416 | 1031 | 4.86/5.0 |
Analyzing the strategies of top hosts, such as their property selection, pricing, and guest communication, can offer valuable lessons for optimizing your own Airbnb operations in Rouen.
Dive Deeper: Advanced Rouen STR Market Data (2026)
Ready to unlock more insights? AirROI provides access to advanced metrics and comprehensive Airbnb data for Rouen. Explore detailed analytics beyond this report to refine your investment strategy, optimize pricing, and maximize your vacation rental profits.
Explore Advanced MetricsRouen Short-Term Rental Market Composition (2026): Property & Room Types
Room Type Distribution
Property Type Distribution
Market Composition Insights for Rouen
- The Rouen Airbnb market composition is heavily skewed towards Entire Home/Apt listings, which make up 92% of the 1,437 active rentals. This indicates strong guest preference for privacy and space.
- Looking at the property type distribution in Rouen, Apartment/Condo properties are the most common (87.5%), reflecting the local real estate landscape.
- Smaller segments like hotel/boutique, outdoor/unique, others (combined 2.3%) offer potential for unique stay experiences.
Rouen Airbnb Room Capacity Analysis (2026): Bedroom Distribution
Distribution of Listings by Number of Bedrooms
Room Capacity Insights for Rouen
- The dominant room capacity in Rouen is 1 bedroom listings, making up 48% of the market. This suggests a strong demand for properties suitable for couples or solo travelers.
- Together, 1 bedroom and 2 bedrooms properties represent 64.6% of the active Airbnb listings in Rouen, indicating a high concentration in these sizes.
- Listings with 3+ bedrooms (9.8%) represent a smaller niche, potentially indicating an underserved market for larger group accommodations in Rouen.
Rouen Vacation Rental Guest Capacity Trends (2026)
Distribution of Listings by Guest Capacity
Guest Capacity Insights for Rouen
- The most common guest capacity trend in Rouen vacation rentals is listings accommodating 2 guests (42.7%). This suggests the primary traveler segment is likely couples or solo travelers.
- Properties designed for 2 guests and 4 guests dominate the Rouen STR market, accounting for 70.3% of listings.
- A significant 43.7% of listings cater specifically to 1-2 guests, highlighting strong demand from couples and solo travelers in Rouen.
- 14.0% of properties accommodate 6+ guests, serving the market segment for larger families or group travel in Rouen.
- On average, properties in Rouen are equipped to host 3.2 guests.
Rouen Airbnb Booking Patterns (2026): Available vs. Booked Days
Available Days Distribution
Booked Days Distribution
Booking Pattern Insights for Rouen
- The most common availability pattern in Rouen falls within the 271-366 days range, representing 44.5% of listings. This suggests many properties have significant open periods on their calendars.
- Approximately 78.9% of listings show high availability (181+ days open annually), indicating potential for increased bookings or specific owner usage patterns.
- For booked days, the 91-180 days range is most frequent in Rouen (34.7%), reflecting common guest stay durations or potential owner blocking patterns.
- A notable 22.7% of properties secure long booking periods (181+ days booked per year), highlighting successful long-term rental strategies or significant owner usage.
Rouen Airbnb Minimum Stay Requirements Analysis
Distribution of Listings by Minimum Night Requirement
1 Night
572 listings
39.8% of total
2 Nights
340 listings
23.7% of total
3 Nights
48 listings
3.3% of total
4-6 Nights
41 listings
2.9% of total
7-29 Nights
36 listings
2.5% of total
30+ Nights
400 listings
27.8% of total
Key Insights
- The most prevalent minimum stay requirement in Rouen is 1 Night, adopted by 39.8% of listings. This highlights the market's preference for shorter, flexible bookings.
- A strong majority (63.5%) of the Rouen Airbnb data shows acceptance of very short stays (1-2 nights), indicating a dynamic, high-turnover market.
- A significant segment (27.8%) caters to monthly stays (30+ nights) in Rouen, pointing to opportunities in the extended-stay market.
Recommendations
- Align with the market by considering a 1 Night minimum stay, as 39.8% of Rouen hosts use this setting.
- Explore offering discounts for stays of 30+ nights to attract the 27.8% of the market seeking extended stays.
- Adjust minimum nights based on seasonality – potentially shorter during low season and longer during peak demand periods in Rouen.
Rouen Airbnb Cancellation Policy Trends Analysis (2026)
Super Strict 30 Days
4 listings
0.3% of total
Super Strict 60 Days
2 listings
0.1% of total
Limited
31 listings
2.2% of total
Flexible
424 listings
29.5% of total
Moderate
584 listings
40.7% of total
Firm
216 listings
15.1% of total
Strict
174 listings
12.1% of total
Cancellation Policy Insights for Rouen
- The prevailing Airbnb cancellation policy trend in Rouen is Moderate, used by 40.7% of listings.
- The market strongly favors guest-friendly terms, with 70.2% of listings offering Flexible or Moderate policies. This suggests guests in Rouen may expect booking flexibility.
Recommendations for Hosts
- Consider adopting a Moderate policy to align with the 40.7% market standard in Rouen.
- Using a Strict policy might deter some guests, as only 12.1% of listings use it. Evaluate if potential revenue protection outweighs possible lower booking rates.
- Regularly review your cancellation policy against competitors and market demand shifts in Rouen.
Rouen STR Booking Lead Time Analysis (2026)
Average Booking Lead Time by Month
Booking Lead Time Insights for Rouen
- The overall average booking lead time for vacation rentals in Rouen is 32 days.
- Guests book furthest in advance for stays during July (average 42 days), likely coinciding with peak travel demand or local events.
- The shortest booking windows occur for stays in February (average 19 days), indicating more last-minute travel plans during this time.
- Seasonally, Summer (39 days avg.) sees the longest lead times, while Winter (24 days avg.) has the shortest, reflecting typical travel planning cycles.
Recommendations for Hosts
- Use the overall average lead time (32 days) as a baseline for your pricing and availability strategy in Rouen.
- Target marketing efforts for the Summer season well in advance (at least 39 days) to capture early planners.
- Monitor your own booking lead times against these Rouen averages to identify opportunities for dynamic pricing adjustments.
Popular & Essential Airbnb Amenities in Rouen (2026)
Amenity Prevalence
Amenity Insights for Rouen
- Essential amenities in Rouen that guests expect include: Kitchen. Lacking these (this) could significantly impact bookings.
- Popular amenities like Heating, Wifi, Smoke alarm are common but not universal. Offering these can provide a competitive edge.
- Warning: Wifi is not universally provided but is considered essential globally. Ensure reliable Wifi is offered.
Recommendations for Hosts
- Ensure your listing includes all essential amenities for Rouen: Kitchen.
- Prioritize adding missing essentials: Kitchen.
- Consider adding popular differentiators like Heating or Wifi to increase appeal.
- Highlight unique or less common amenities you offer (e.g., hot tub, dedicated workspace, EV charger) in your listing description and photos.
- Regularly check competitor amenities in Rouen to stay competitive.
Rouen Airbnb Guest Demographics & Profile Analysis (2026)
Guest Profile Summary for Rouen
- The typical guest profile for Airbnb in Rouen consists of primarily domestic travelers (67%), often arriving from nearby Paris, typically belonging to the Post-2000s (Gen Z/Alpha) group (50%), primarily speaking French or English.
- Domestic travelers account for 67.0% of guests.
- Key international markets include France (67%) and United Kingdom (7.5%).
- Top languages spoken are French (36.9%) followed by English (34.9%).
- A significant demographic segment is the Post-2000s (Gen Z/Alpha) group, representing 50% of guests.
Recommendations for Hosts
- Target domestic marketing efforts towards travelers from Paris and Rouen.
- Tailor amenities and listing descriptions to appeal to the dominant Post-2000s (Gen Z/Alpha) demographic (e.g., highlight fast WiFi, smart home features, local guides).
- Highlight unique local experiences or amenities relevant to the primary guest profile.
- Consider seasonal promotions aligned with peak travel times for key origin markets.
Nearby Short-Term Rental Market Comparison
How does the Rouen Airbnb market stack up against its neighbors? Compare key performance metrics like average monthly revenue, ADR, and occupancy rates in surrounding areas to understand the broader regional STR landscape.
| Market | Active Properties | Monthly Revenue | Daily Rate | Avg. Occupancy |
|---|---|---|---|---|
| Lo-Reninge | 13 | $5,989 | $454.03 | 42% |
| Égreville | 12 | $4,969 | $447.83 | 40% |
| La Couture-Boussey | 11 | $4,086 | $464.04 | 28% |
| La Poterie-Cap-d'Antifer | 15 | $3,878 | $273.66 | 48% |
| Rosoy-en-Multien | 15 | $3,680 | $347.93 | 47% |
| Saint-Étienne-la-Thillaye | 23 | $3,486 | $390.94 | 35% |
| Heuvelland | 56 | $3,348 | $367.19 | 36% |
| Morienval | 12 | $3,308 | $372.82 | 30% |
| Saint-Pierre-du-Val | 15 | $3,257 | $343.84 | 38% |
| Rugles | 11 | $3,164 | $308.65 | 32% |