Benerville-sur-Mer Airbnb Market Analysis 2026: Short Term Rental Data & Vacation Rental Statistics in Normandy, France
Is Airbnb profitable in Benerville-sur-Mer in 2026? Explore comprehensive Airbnb analytics for Benerville-sur-Mer, Normandy, France to uncover income potential. This 2026 STR market report for Benerville-sur-Mer, based on AirROI data from February 2025 to January 2026, reveals key trends in the niche market of 117 active listings.
Whether you're considering an Airbnb investment in Benerville-sur-Mer, optimizing your existing vacation rental, or exploring rental arbitrage opportunities, understanding the Benerville-sur-Mer Airbnb data is crucial. Leveraging the low regulation environment is key to maximizing your short term rental income potential. Let's dive into the specifics.
Key Benerville-sur-Mer Airbnb Performance Metrics Overview
Monthly Airbnb Revenue Variations & Income Potential in Benerville-sur-Mer (2026)
Understanding the monthly revenue variations for Airbnb listings in Benerville-sur-Mer is key to maximizing your short term rental income potential. Seasonality significantly impacts earnings. Our analysis, based on data from the past 12 months, shows that the peak revenue month for STRs in Benerville-sur-Mer is typically August, while January often presents the lowest earnings, highlighting opportunities for strategic pricing adjustments during shoulder and low seasons. Explore the typical Airbnb income in Benerville-sur-Mer across different performance tiers:
- Best-in-class properties (Top 10%) achieve $6,182+ monthly, often utilizing dynamic pricing and superior guest experiences.
- Strong performing properties (Top 25%) earn $3,104 or more, indicating effective management and desirable locations/amenities.
- Typical properties (Median) generate around $1,738 per month, representing the average market performance.
- Entry-level properties (Bottom 25%) see earnings around $851, often with potential for optimization.
Average Monthly Airbnb Earnings Trend in Benerville-sur-Mer
Benerville-sur-Mer Airbnb Occupancy Rate Trends (2026)
Maximize your bookings by understanding the Benerville-sur-Mer STR occupancy trends. Seasonal demand shifts significantly influence how often properties are booked. Typically, Augustsees the highest demand (peak season occupancy), while January experiences the lowest (low season). Effective strategies, like adjusting minimum stays or offering promotions, can boost occupancy during slower periods. Here's how different property tiers perform in Benerville-sur-Mer:
- Best-in-class properties (Top 10%) achieve 62%+ occupancy, indicating high desirability and potentially optimized availability.
- Strong performing properties (Top 25%) maintain 45% or higher occupancy, suggesting good market fit and guest satisfaction.
- Typical properties (Median) have an occupancy rate around 28%.
- Entry-level properties (Bottom 25%) average 16% occupancy, potentially facing higher vacancy.
Average Monthly Occupancy Rate Trend in Benerville-sur-Mer
Average Daily Rate (ADR) Airbnb Trends in Benerville-sur-Mer (2026)
Effective short term rental pricing strategy in Benerville-sur-Mer involves understanding monthly ADR fluctuations. The Average Daily Rate (ADR) for Airbnb in Benerville-sur-Mer typically peaks in August and dips lowest during November. Leveraging Airbnb dynamic pricing tools or strategies based on this seasonality can significantly boost revenue. Here's a look at the typical nightly rates achieved:
- Best-in-class properties (Top 10%) command rates of $607+ per night, often due to premium features or locations.
- Strong performing properties (Top 25%) achieve nightly rates of $318 or more.
- Typical properties (Median) charge around $174 per night.
- Entry-level properties (Bottom 25%) earn around $126 per night.
Average Daily Rate (ADR) Trend by Month in Benerville-sur-Mer
Get Live Benerville-sur-Mer Market Intelligence 👇

Explore Real-time Analytics
Airbnb Seasonality Analysis & Trends in Benerville-sur-Mer (2026)
Peak Season (August, July, June)
- Revenue averages $5,376 per month
- Occupancy rates average 50.9%
- Daily rates average $334
Shoulder Season
- Revenue averages $2,439 per month
- Occupancy maintains around 29.8%
- Daily rates hold near $299
Low Season (January, March, November)
- Revenue drops to average $1,391 per month
- Occupancy decreases to average 19.2%
- Daily rates adjust to average $287
Seasonality Insights for Benerville-sur-Mer
- The Airbnb seasonality in Benerville-sur-Mer shows highly seasonal trends requiring careful strategy. While the sections above show seasonal averages, it's also insightful to look at the extremes:
- During the high season, the absolute peak month showcases Benerville-sur-Mer's highest earning potential, with monthly revenues capable of climbing to $7,133, occupancy reaching a high of 65.5%, and ADRs peaking at $340.
- Conversely, the slowest single month of the year, typically falling within the low season, marks the market's lowest point. In this month, revenue might dip to $1,114, occupancy could drop to 13.2%, and ADRs may adjust down to $286.
- Understanding both the seasonal averages and these monthly peaks and troughs in revenue, occupancy, and ADR is crucial for maximizing your Airbnb profit potential in Benerville-sur-Mer.
Seasonal Strategies for Maximizing Profit
- Peak Season: Maximize revenue through premium pricing and potentially longer minimum stays. Ensure high availability.
- Low Season: Offer competitive pricing, special promotions (e.g., extended stay discounts), and flexible cancellation policies. Target off-season travelers like remote workers or budget-conscious guests.
- Shoulder Seasons: Implement dynamic pricing that balances peak and low rates. Target weekend travelers or specific events. Offer slightly more flexible terms than peak season.
- Regularly analyze your own performance against these Benerville-sur-Mer seasonality benchmarks and adjust your pricing and availability strategy accordingly.
Best Areas for Airbnb Investment in Benerville-sur-Mer (2026)
Exploring the top neighborhoods for short-term rentals in Benerville-sur-Mer? This section highlights key areas, outlining why they are attractive for hosts and guests, along with notable local attractions. Consider these locations based on your target guest profile and investment strategy.
| Neighborhood / Area | Why Host Here? (Target Guests & Appeal) | Key Attractions & Landmarks |
|---|---|---|
| Plage de Benerville | Beautiful sandy beach that is perfect for sunbathing and water activities. A popular spot for both tourists and locals looking for a seaside experience with restaurants and beach bars nearby. | Beachfront cafes, Water sports rentals, Walking paths along the coast, Tennis courts, Local markets |
| Village de Benerville | Charming village atmosphere with beautiful traditional Normandy architecture. Family-friendly and quiet, making it ideal for guests seeking a peaceful retreat while still being close to the beach. | Local bakeries, Village church, Charming streets, Artisan shops, Parks for picnics |
| Deauville | Famous nearby city known for its luxury, casinos, and horse racing. Attracts high-end tourists and offers plenty of entertainment options. | Deauville Beach, American Film Festival, Casino Barrière, Thalasso Deauville by Algotherm, Polo Club |
| Trouville-sur-Mer | Vibrant seaside town just across the river, known for its market and seafood restaurants. Ideal for guests looking to explore two towns in one stay. | Trouville Beach, Fish market, La Touques River, Seaside promenade, Casino de Trouville |
| Cabourg | Charming Belle Époque-style resort town known for its long sandy beach and romantic boardwalk. Popular for weekend getaways and family vacations. | Cabourg Beach, Promenade Marcel Proust, Grand Hotel Cabourg, Casino de Cabourg, Local festivals |
| Houlgate | Another picturesque coastal town, known for its beautiful villas and tranquil beach. Attracts families and couples looking for a serene escape. | Houlgate Beach, Villas Belle Époque, Local markets, Cycle paths, Seaside cafés |
| Été de Villers-sur-Mer | A small, less crowded beach that is perfect for a quiet day by the sea. Popular among families and those looking to avoid the hustle and bustle. | Villers-sur-Mer Beach, Seabirds Park, Gastronomic restaurants, Coastal nature trails, Bicycle rentals |
| Normandy countryside | Beautiful countryside surrounding Benerville, perfect for guests wanting to explore the historic Normandy region, vineyards, and rural landscapes. | Historical monuments, Cider houses, Walking and biking trails, Scenic drives, Local farms |
Understanding Airbnb License Requirements & STR Laws in Benerville-sur-Mer (2026)
While Benerville-sur-Mer, Normandy, France currently shows low STR regulations, specific Airbnb license requirements might still exist or change. Always verify the latest short term rental regulations and Airbnb license requirements directly with local government authorities for Benerville-sur-Mer to ensure full compliance before hosting.
(Source: AirROI data, 2026, based on 3% licensed listings)
Top Performing Airbnb Properties in Benerville-sur-Mer (2026)
Benchmark your potential! Explore examples of top-performing Airbnb properties in Benerville-sur-Merbased on Trailing Twelve Month (TTM) revenue. Analyze their characteristics, revenue, occupancy rate, and ADR to understand what drives success in this market.

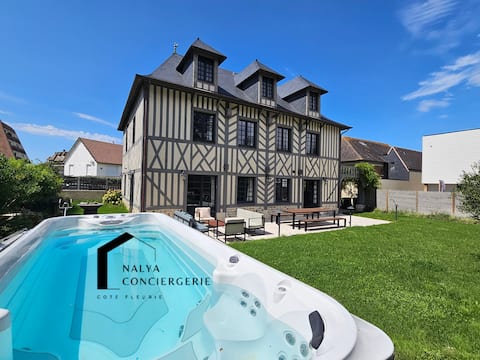
Renovated house with a view
Entire Place • 5 bedrooms
Exceptional villa, 5 bedrooms, 20 m from the beach, spa.
Entire Place • 5 bedrooms
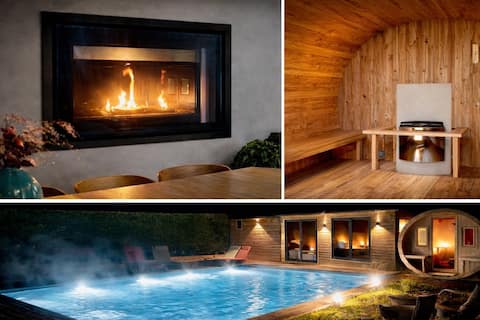
Beautiful Villa, Heated Pool & Sauna, by the sea.
Entire Place • 5 bedrooms
Large beach house 5 minutes from Deauville
Entire Place ��• 8 bedrooms
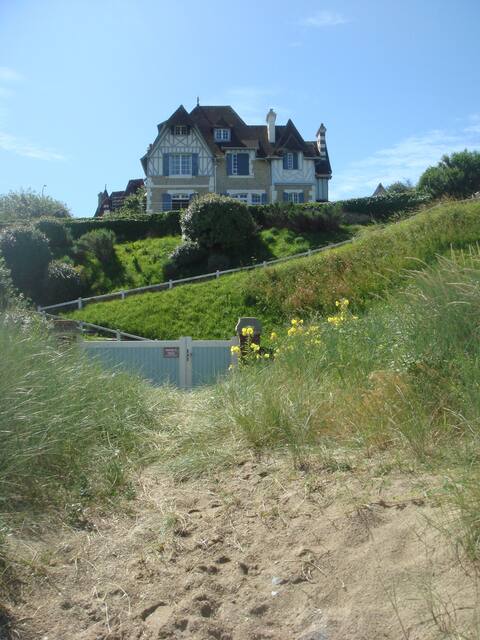
Beautiful Villa with sea view near Deauville
Entire Place • 7 bedrooms

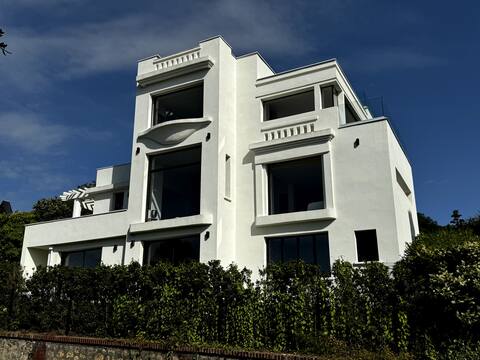
Beachfront, sea view, garden – Deauville
Entire Place • 4 bedrooms
Note: Performance varies based on location, size, amenities, seasonality, and management quality. Data reflects the past 12 months.
Top Performing Airbnb Hosts in Benerville-sur-Mer (2026)
Learn from the best! This table showcases top-performing Airbnb hosts in Benerville-sur-Mer based on the number of properties managed and estimated total revenue over the past year. Analyze their scale and performance metrics.
| Host Name | Properties | Grossing Revenue | Stay Reviews | Avg Rating |
|---|---|---|---|---|
| Corinne | 1 | $179,299 | 1 | Not Rated |
| Denis | 1 | $161,911 | 19 | 5.00/5.0 |
| Michael | 1 | $139,732 | 87 | 4.91/5.0 |
| Veronique | 1 | $127,561 | 9 | 5.00/5.0 |
| Arnaud Nicolas | 1 | $125,823 | 21 | 4.62/5.0 |
| Anael | 1 | $124,734 | 85 | 4.65/5.0 |
| Grégoire | 6 | $100,190 | 114 | 4.60/5.0 |
| Jonathan | 1 | $86,922 | 12 | 4.92/5.0 |
| Christian | 1 | $86,544 | 17 | 4.94/5.0 |
| Véronique | 2 | $83,162 | 108 | 4.91/5.0 |
Analyzing the strategies of top hosts, such as their property selection, pricing, and guest communication, can offer valuable lessons for optimizing your own Airbnb operations in Benerville-sur-Mer.
Dive Deeper: Advanced Benerville-sur-Mer STR Market Data (2026)
Ready to unlock more insights? AirROI provides access to advanced metrics and comprehensive Airbnb data for Benerville-sur-Mer. Explore detailed analytics beyond this report to refine your investment strategy, optimize pricing, and maximize your vacation rental profits.
Explore Advanced MetricsBenerville-sur-Mer Short-Term Rental Market Composition (2026): Property & Room Types
Room Type Distribution
Property Type Distribution
Market Composition Insights for Benerville-sur-Mer
- The Benerville-sur-Mer Airbnb market composition is heavily skewed towards Entire Home/Apt listings, which make up 100% of the 117 active rentals. This indicates strong guest preference for privacy and space.
- Looking at the property type distribution in Benerville-sur-Mer, Apartment/Condo properties are the most common (65%), reflecting the local real estate landscape.
- Houses represent a significant 34.2% portion, catering likely to families or larger groups.
- Smaller segments like others (combined 0.9%) offer potential for unique stay experiences.
Benerville-sur-Mer Airbnb Room Capacity Analysis (2026): Bedroom Distribution
Distribution of Listings by Number of Bedrooms
Room Capacity Insights for Benerville-sur-Mer
- The dominant room capacity in Benerville-sur-Mer is 1 bedroom listings, making up 32.5% of the market. This suggests a strong demand for properties suitable for couples or solo travelers.
- Together, 1 bedroom and 2 bedrooms properties represent 65.0% of the active Airbnb listings in Benerville-sur-Mer, indicating a high concentration in these sizes.
- A significant 29.9% of listings offer 3+ bedrooms, catering to larger groups and families seeking more space in Benerville-sur-Mer.
Benerville-sur-Mer Vacation Rental Guest Capacity Trends (2026)
Distribution of Listings by Guest Capacity
Guest Capacity Insights for Benerville-sur-Mer
- The most common guest capacity trend in Benerville-sur-Mer vacation rentals is listings accommodating 4 guests (41%). This suggests the primary traveler segment is likely small families or groups.
- Properties designed for 4 guests and 8+ guests dominate the Benerville-sur-Mer STR market, accounting for 59.8% of listings.
- 32.5% of properties accommodate 6+ guests, serving the market segment for larger families or group travel in Benerville-sur-Mer.
- On average, properties in Benerville-sur-Mer are equipped to host 4.7 guests.
Benerville-sur-Mer Airbnb Booking Patterns (2026): Available vs. Booked Days
Available Days Distribution
Booked Days Distribution
Booking Pattern Insights for Benerville-sur-Mer
- The most common availability pattern in Benerville-sur-Mer falls within the 271-366 days range, representing 62.4% of listings. This suggests many properties have significant open periods on their calendars.
- Approximately 94.9% of listings show high availability (181+ days open annually), indicating potential for increased bookings or specific owner usage patterns.
- For booked days, the 31-90 days range is most frequent in Benerville-sur-Mer (40.2%), reflecting common guest stay durations or potential owner blocking patterns.
- A notable 5.1% of properties secure long booking periods (181+ days booked per year), highlighting successful long-term rental strategies or significant owner usage.
Benerville-sur-Mer Airbnb Minimum Stay Requirements Analysis
Distribution of Listings by Minimum Night Requirement
1 Night
2 listings
1.7% of total
2 Nights
26 listings
22.2% of total
3 Nights
6 listings
5.1% of total
4-6 Nights
9 listings
7.7% of total
7-29 Nights
3 listings
2.6% of total
30+ Nights
71 listings
60.7% of total
Key Insights
- The most prevalent minimum stay requirement in Benerville-sur-Mer is 30+ Nights, adopted by 60.7% of listings. This highlights the market's preference for longer commitments.
- A significant segment (60.7%) caters to monthly stays (30+ nights) in Benerville-sur-Mer, pointing to opportunities in the extended-stay market.
Recommendations
- Align with the market by considering a 30+ Nights minimum stay, as 60.7% of Benerville-sur-Mer hosts use this setting.
- If feasible, allowing 1-night stays, especially midweek or during low season, could capture last-minute bookings, as only 1.7% currently do.
- Explore offering discounts for stays of 30+ nights to attract the 60.7% of the market seeking extended stays.
- Adjust minimum nights based on seasonality – potentially shorter during low season and longer during peak demand periods in Benerville-sur-Mer.
Benerville-sur-Mer Airbnb Cancellation Policy Trends Analysis (2026)
Super Strict 60 Days
1 listings
0.9% of total
Limited
3 listings
2.6% of total
Flexible
17 listings
14.5% of total
Moderate
33 listings
28.2% of total
Firm
48 listings
41% of total
Strict
15 listings
12.8% of total
Cancellation Policy Insights for Benerville-sur-Mer
- The prevailing Airbnb cancellation policy trend in Benerville-sur-Mer is Firm, used by 41% of listings.
- A majority (53.8%) of hosts in Benerville-sur-Mer utilize Firm or Strict policies, indicating a market where hosts prioritize booking security.
Recommendations for Hosts
- Consider adopting a Firm policy to align with the 41% market standard in Benerville-sur-Mer.
- Using a Strict policy might deter some guests, as only 12.8% of listings use it. Evaluate if potential revenue protection outweighs possible lower booking rates.
- Regularly review your cancellation policy against competitors and market demand shifts in Benerville-sur-Mer.
Benerville-sur-Mer STR Booking Lead Time Analysis (2026)
Average Booking Lead Time by Month
Booking Lead Time Insights for Benerville-sur-Mer
- The overall average booking lead time for vacation rentals in Benerville-sur-Mer is 48 days.
- Guests book furthest in advance for stays during August (average 88 days), likely coinciding with peak travel demand or local events.
- The shortest booking windows occur for stays in January (average 13 days), indicating more last-minute travel plans during this time.
- Seasonally, Summer (68 days avg.) sees the longest lead times, while Winter (28 days avg.) has the shortest, reflecting typical travel planning cycles.
Recommendations for Hosts
- Use the overall average lead time (48 days) as a baseline for your pricing and availability strategy in Benerville-sur-Mer.
- For August stays, consider implementing length-of-stay discounts or slightly higher rates for bookings made less than 88 days out to capitalize on advance planning.
- During January, focus on last-minute booking availability and promotions, as guests book with very short notice (13 days avg.).
- Target marketing efforts for the Summer season well in advance (at least 68 days) to capture early planners.
- Monitor your own booking lead times against these Benerville-sur-Mer averages to identify opportunities for dynamic pricing adjustments.
Popular & Essential Airbnb Amenities in Benerville-sur-Mer (2026)
Amenity Prevalence
Amenity Insights for Benerville-sur-Mer
- Essential amenities in Benerville-sur-Mer that guests expect include: Kitchen, Heating. Lacking these (any) could significantly impact bookings.
- Popular amenities like TV, Hot water, Cooking basics are common but not universal. Offering these can provide a competitive edge.
- Warning: Wifi is not universally provided but is considered essential globally. Ensure reliable Wifi is offered.
Recommendations for Hosts
- Ensure your listing includes all essential amenities for Benerville-sur-Mer: Kitchen, Heating.
- Prioritize adding missing essentials: Kitchen, Heating.
- Consider adding popular differentiators like TV or Hot water to increase appeal.
- Highlight unique or less common amenities you offer (e.g., hot tub, dedicated workspace, EV charger) in your listing description and photos.
- Regularly check competitor amenities in Benerville-sur-Mer to stay competitive.
Benerville-sur-Mer Airbnb Guest Demographics & Profile Analysis (2026)
Guest Profile Summary for Benerville-sur-Mer
- The typical guest profile for Airbnb in Benerville-sur-Mer consists of primarily domestic travelers (70%), often arriving from nearby Paris, typically belonging to the Post-2000s (Gen Z/Alpha) group (50%), primarily speaking French or English.
- Domestic travelers account for 69.8% of guests.
- Key international markets include France (69.8%) and Germany (7.2%).
- Top languages spoken are French (36.6%) followed by English (35.5%).
- A significant demographic segment is the Post-2000s (Gen Z/Alpha) group, representing 50% of guests.
Recommendations for Hosts
- Target domestic marketing efforts towards travelers from Paris and London.
- Tailor amenities and listing descriptions to appeal to the dominant Post-2000s (Gen Z/Alpha) demographic (e.g., highlight fast WiFi, smart home features, local guides).
- Highlight unique local experiences or amenities relevant to the primary guest profile.
- Consider seasonal promotions aligned with peak travel times for key origin markets.
Nearby Short-Term Rental Market Comparison
How does the Benerville-sur-Mer Airbnb market stack up against its neighbors? Compare key performance metrics like average monthly revenue, ADR, and occupancy rates in surrounding areas to understand the broader regional STR landscape.
| Market | Active Properties | Monthly Revenue | Daily Rate | Avg. Occupancy |
|---|---|---|---|---|
| La Couture-Boussey | 11 | $4,086 | $464.04 | 28% |
| La Poterie-Cap-d'Antifer | 15 | $3,878 | $273.66 | 48% |
| Saint-Étienne-la-Thillaye | 23 | $3,486 | $390.94 | 35% |
| Roedean | 52 | $3,379 | $273.40 | 45% |
| Saint-Pierre-du-Val | 15 | $3,257 | $343.84 | 38% |
| Petiville | 13 | $3,232 | $379.66 | 33% |
| Rugles | 11 | $3,164 | $308.65 | 32% |
| Mesnils-sur-Iton | 24 | $3,099 | $348.65 | 41% |
| Charencey | 11 | $3,030 | $245.41 | 41% |
| Tourouvre au Perche | 31 | $3,003 | $254.65 | 39% |