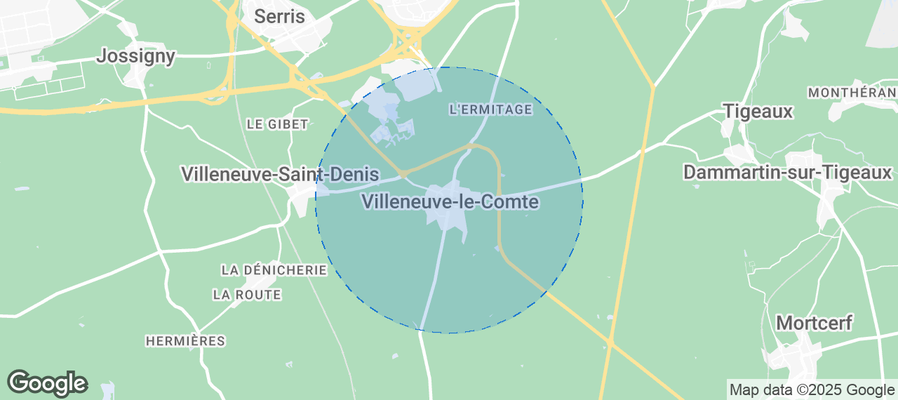
Villeneuve-le-Comte Airbnb Market Analysis 2025: Short Term Rental Data & Vacation Rental Statistics in Ile-de-France, France
Is Airbnb profitable in Villeneuve-le-Comte in 2025? Explore comprehensive Airbnb analytics for Villeneuve-le-Comte, Ile-de-France, France to uncover income potential. This 2025 STR market report for Villeneuve-le-Comte, based on AirROI data from November 2024 to October 2025, reveals key trends in the niche market of 17 active listings.
Whether you're considering an Airbnb investment in Villeneuve-le-Comte, optimizing your existing vacation rental, or exploring rental arbitrage opportunities, understanding the Villeneuve-le-Comte Airbnb data is crucial. Navigating the high regulation landscape is key to maximizing your short term rental income potential. Let's dive into the specifics.
Key Villeneuve-le-Comte Airbnb Performance Metrics Overview
Monthly Airbnb Revenue Variations & Income Potential in Villeneuve-le-Comte (2025)
Understanding the monthly revenue variations for Airbnb listings in Villeneuve-le-Comte is key to maximizing your short term rental income potential. Seasonality significantly impacts earnings. Our analysis, based on data from the past 12 months, shows that the peak revenue month for STRs in Villeneuve-le-Comte is typically August, while November often presents the lowest earnings, highlighting opportunities for strategic pricing adjustments during shoulder and low seasons. Explore the typical Airbnb income in Villeneuve-le-Comte across different performance tiers:
- Best-in-class properties (Top 10%) achieve $6,956+ monthly, often utilizing dynamic pricing and superior guest experiences.
- Strong performing properties (Top 25%) earn $2,776 or more, indicating effective management and desirable locations/amenities.
- Typical properties (Median) generate around $1,219 per month, representing the average market performance.
- Entry-level properties (Bottom 25%) see earnings around $732, often with potential for optimization.
Average Monthly Airbnb Earnings Trend in Villeneuve-le-Comte
Villeneuve-le-Comte Airbnb Occupancy Rate Trends (2025)
Maximize your bookings by understanding the Villeneuve-le-Comte STR occupancy trends. Seasonal demand shifts significantly influence how often properties are booked. Typically, Augustsees the highest demand (peak season occupancy), while November experiences the lowest (low season). Effective strategies, like adjusting minimum stays or offering promotions, can boost occupancy during slower periods. Here's how different property tiers perform in Villeneuve-le-Comte:
- Best-in-class properties (Top 10%) achieve 88%+ occupancy, indicating high desirability and potentially optimized availability.
- Strong performing properties (Top 25%) maintain 64% or higher occupancy, suggesting good market fit and guest satisfaction.
- Typical properties (Median) have an occupancy rate around 42%.
- Entry-level properties (Bottom 25%) average 19% occupancy, potentially facing higher vacancy.
Average Monthly Occupancy Rate Trend in Villeneuve-le-Comte
Average Daily Rate (ADR) Airbnb Trends in Villeneuve-le-Comte (2025)
Effective short term rental pricing strategy in Villeneuve-le-Comte involves understanding monthly ADR fluctuations. The Average Daily Rate (ADR) for Airbnb in Villeneuve-le-Comte typically peaks in July and dips lowest during March. Leveraging Airbnb dynamic pricing tools or strategies based on this seasonality can significantly boost revenue. Here's a look at the typical nightly rates achieved:
- Best-in-class properties (Top 10%) command rates of $388+ per night, often due to premium features or locations.
- Strong performing properties (Top 25%) achieve nightly rates of $196 or more.
- Typical properties (Median) charge around $97 per night.
- Entry-level properties (Bottom 25%) earn around $74 per night.
Average Daily Rate (ADR) Trend by Month in Villeneuve-le-Comte
Get Live Villeneuve-le-Comte Market Intelligence 👇
Explore Real-time Analytics
Airbnb Seasonality Analysis & Trends in Villeneuve-le-Comte (2025)
Peak Season (August, June, December)
- Revenue averages $3,962 per month
- Occupancy rates average 55.8%
- Daily rates average $211
Shoulder Season
- Revenue averages $3,124 per month
- Occupancy maintains around 45.6%
- Daily rates hold near $197
Low Season (January, May, November)
- Revenue drops to average $2,509 per month
- Occupancy decreases to average 37.8%
- Daily rates adjust to average $192
Seasonality Insights for Villeneuve-le-Comte
- The Airbnb seasonality in Villeneuve-le-Comte shows highly seasonal trends requiring careful strategy. While the sections above show seasonal averages, it's also insightful to look at the extremes:
- During the high season, the absolute peak month showcases Villeneuve-le-Comte's highest earning potential, with monthly revenues capable of climbing to $4,605, occupancy reaching a high of 62.4%, and ADRs peaking at $221.
- Conversely, the slowest single month of the year, typically falling within the low season, marks the market's lowest point. In this month, revenue might dip to $2,243, occupancy could drop to 31.2%, and ADRs may adjust down to $177.
- Understanding both the seasonal averages and these monthly peaks and troughs in revenue, occupancy, and ADR is crucial for maximizing your Airbnb profit potential in Villeneuve-le-Comte.
Seasonal Strategies for Maximizing Profit
- Peak Season: Maximize revenue through premium pricing and potentially longer minimum stays. Ensure high availability.
- Low Season: Offer competitive pricing, special promotions (e.g., extended stay discounts), and flexible cancellation policies. Target off-season travelers like remote workers or budget-conscious guests.
- Shoulder Seasons: Implement dynamic pricing that balances peak and low rates. Target weekend travelers or specific events. Offer slightly more flexible terms than peak season.
- Regularly analyze your own performance against these Villeneuve-le-Comte seasonality benchmarks and adjust your pricing and availability strategy accordingly.
Best Areas for Airbnb Investment in Villeneuve-le-Comte (2025)
Exploring the top neighborhoods for short-term rentals in Villeneuve-le-Comte? This section highlights key areas, outlining why they are attractive for hosts and guests, along with notable local attractions. Consider these locations based on your target guest profile and investment strategy.
| Neighborhood / Area | Why Host Here? (Target Guests & Appeal) | Key Attractions & Landmarks |
|---|---|---|
| Village Center | Charming area with a mix of historical architecture and modern amenities. Ideal for families and couples visiting to explore cultural sites and enjoy local dining. | Eglise Saint-George, Château de Montargis, Local markets, Parks and green spaces, Cafes and bistros |
| Nature Reserve | Proximity to natural parks and outdoor activities, great for eco-tourists and families looking for a peaceful retreat. | Parc Naturel Régional de la Brie, Hiking trails, Picnic areas, Wildlife observation spots |
| Shopping District | Central hub for shopping and dining, appealing to tourists looking to immerse themselves in local commerce and cuisine. | Local boutiques, Restaurants, Markets, Cafes |
| Cultural Quarter | Rich in history and culture, this area attracts those interested in museums, galleries, and local heritage events. | Musee de la Brie, Art galleries, Cultural events, Historic buildings |
| Family Friendly Zone | This area is ideal for families with kids due to its safe environment and proximity to parks and entertainment. | Playgrounds, Family restaurants, Aquatic centers, Community events |
| Garden Area | Known for its beautiful gardens and landscape, perfect for visitors wanting a tranquil environment to relax. | Botanical gardens, Walking paths, Picnic areas, Seasonal flower displays |
| Historical District | A beautiful area with well-preserved historical buildings that attract history enthusiasts and tourists alike. | Historical architecture, Guided tours, Local history museums, Art studios |
| Culinary Hub | Famous for its local delicacies and restaurant scene, drawing food lovers from all over. | Gourmet restaurants, Local specialties, Cooking classes, Food festivals |
Understanding Airbnb License Requirements & STR Laws in Villeneuve-le-Comte (2025)
Yes, Villeneuve-le-Comte, Ile-de-France, France enforces high STR regulations. Obtaining a license and ensuring compliance is almost certainly required according to current 2025 STR laws. Always verify the latest short term rental regulations and Airbnb license requirements directly with local government authorities for Villeneuve-le-Comte to ensure full compliance before hosting.
(Source: AirROI data, 2025, based on 47% licensed listings)
Top Performing Airbnb Properties in Villeneuve-le-Comte (2025)
Benchmark your potential! Explore examples of top-performing Airbnb properties in Villeneuve-le-Comtebased on Trailing Twelve Month (TTM) revenue. Analyze their characteristics, revenue, occupancy rate, and ADR to understand what drives success in this market.
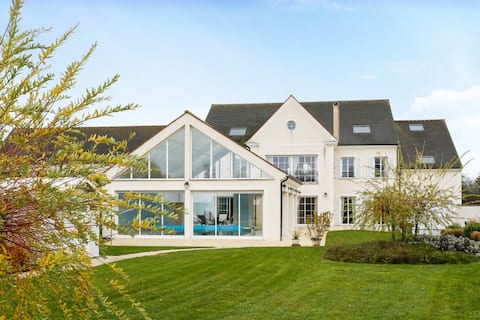
Prestigious House at the gates of DisneyLAND PARIS
Entire Place • 7 bedrooms

MickeyRelax House Spa Sauna next Disneyland Paris
Entire Place • 3 bedrooms
Dreamland House - Near Disney
Entire Place • 6 bedrooms

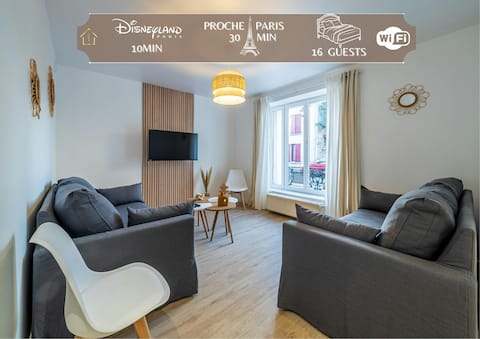
The Disneyland Paris Playhouse
Entire Place • 1 bedroom

Nice Disneyland house, quiet and comfortable
Entire Place • 1 bedroom

Family! Disney! 9 min! Halloween!
Entire Place • 2 bedrooms
Note: Performance varies based on location, size, amenities, seasonality, and management quality. Data reflects the past 12 months.
Top Performing Airbnb Hosts in Villeneuve-le-Comte (2025)
Learn from the best! This table showcases top-performing Airbnb hosts in Villeneuve-le-Comte based on the number of properties managed and estimated total revenue over the past year. Analyze their scale and performance metrics.
| Host Name | Properties | Grossing Revenue | Stay Reviews | Avg Rating |
|---|---|---|---|---|
| Simon | 1 | $228,340 | 21 | 4.81/5.0 |
| Hugo Manuel | 2 | $63,901 | 34 | 4.97/5.0 |
| Khady | 1 | $62,761 | 78 | 4.67/5.0 |
| Mathieu | 4 | $57,099 | 344 | 4.91/5.0 |
| Karine | 2 | $25,426 | 131 | 4.99/5.0 |
| Lionel | 1 | $24,407 | 90 | 4.96/5.0 |
| Brigitte | 2 | $23,776 | 187 | 4.93/5.0 |
| Alexandre | 3 | $15,631 | 66 | 4.80/5.0 |
| Kaïs | 1 | $12,530 | 6 | 4.33/5.0 |
Analyzing the strategies of top hosts, such as their property selection, pricing, and guest communication, can offer valuable lessons for optimizing your own Airbnb operations in Villeneuve-le-Comte.
Dive Deeper: Advanced Villeneuve-le-Comte STR Market Data (2025)
Ready to unlock more insights? AirROI provides access to advanced metrics and comprehensive Airbnb data for Villeneuve-le-Comte. Explore detailed analytics beyond this report to refine your investment strategy, optimize pricing, and maximize your vacation rental profits.
Explore Advanced MetricsVilleneuve-le-Comte Short-Term Rental Market Composition (2025): Property & Room Types
Room Type Distribution
Property Type Distribution
Market Composition Insights for Villeneuve-le-Comte
- The Villeneuve-le-Comte Airbnb market composition is heavily skewed towards Entire Home/Apt listings, which make up 58.8% of the 17 active rentals. This indicates strong guest preference for privacy and space.
- However, a notable 41.2% share for Private Rooms suggests opportunities for budget-conscious travelers or hosts renting out spare rooms.
- Looking at the property type distribution in Villeneuve-le-Comte, House properties are the most common (70.6%), reflecting the local real estate landscape.
- Houses represent a significant 70.6% portion, catering likely to families or larger groups.
- The presence of 5.9% Hotel/Boutique listings indicates integration with traditional hospitality.
Villeneuve-le-Comte Airbnb Room Capacity Analysis (2025): Bedroom Distribution
Distribution of Listings by Number of Bedrooms
Room Capacity Insights for Villeneuve-le-Comte
- The dominant room capacity in Villeneuve-le-Comte is 1 bedroom listings, making up 23.5% of the market. This suggests a strong demand for properties suitable for couples or solo travelers.
- Together, 1 bedroom and 2 bedrooms properties represent 35.3% of the active Airbnb listings in Villeneuve-le-Comte, indicating a high concentration in these sizes.
- A significant 23.6% of listings offer 3+ bedrooms, catering to larger groups and families seeking more space in Villeneuve-le-Comte.
Villeneuve-le-Comte Vacation Rental Guest Capacity Trends (2025)
Distribution of Listings by Guest Capacity
Guest Capacity Insights for Villeneuve-le-Comte
- The most common guest capacity trend in Villeneuve-le-Comte vacation rentals is listings accommodating 8+ guests (17.6%). This suggests the primary traveler segment is likely larger groups.
- Properties designed for 8+ guests and 6 guests dominate the Villeneuve-le-Comte STR market, accounting for 35.2% of listings.
- 35.2% of properties accommodate 6+ guests, serving the market segment for larger families or group travel in Villeneuve-le-Comte.
- On average, properties in Villeneuve-le-Comte are equipped to host 3.4 guests.
Villeneuve-le-Comte Airbnb Booking Patterns (2025): Available vs. Booked Days
Available Days Distribution
Booked Days Distribution
Booking Pattern Insights for Villeneuve-le-Comte
- The most common availability pattern in Villeneuve-le-Comte falls within the 181-270 days range, representing 35.3% of listings. This suggests many properties have significant open periods on their calendars.
- Approximately 70.6% of listings show high availability (181+ days open annually), indicating potential for increased bookings or specific owner usage patterns.
- For booked days, the 31-90 days range is most frequent in Villeneuve-le-Comte (35.3%), reflecting common guest stay durations or potential owner blocking patterns.
- A notable 29.4% of properties secure long booking periods (181+ days booked per year), highlighting successful long-term rental strategies or significant owner usage.
Villeneuve-le-Comte Airbnb Minimum Stay Requirements Analysis
Distribution of Listings by Minimum Night Requirement
1 Night
5 listings
29.4% of total
2 Nights
4 listings
23.5% of total
3 Nights
1 listings
5.9% of total
30+ Nights
7 listings
41.2% of total
Key Insights
- The most prevalent minimum stay requirement in Villeneuve-le-Comte is 30+ Nights, adopted by 41.2% of listings. This highlights the market's preference for longer commitments.
- A significant segment (41.2%) caters to monthly stays (30+ nights) in Villeneuve-le-Comte, pointing to opportunities in the extended-stay market.
Recommendations
- Align with the market by considering a 30+ Nights minimum stay, as 41.2% of Villeneuve-le-Comte hosts use this setting.
- If feasible, allowing 1-night stays, especially midweek or during low season, could capture last-minute bookings, as only 29.4% currently do.
- Explore offering discounts for stays of 30+ nights to attract the 41.2% of the market seeking extended stays.
- Adjust minimum nights based on seasonality – potentially shorter during low season and longer during peak demand periods in Villeneuve-le-Comte.
Villeneuve-le-Comte Airbnb Cancellation Policy Trends Analysis (2025)
Flexible
6 listings
35.3% of total
Moderate
9 listings
52.9% of total
Firm
2 listings
11.8% of total
Cancellation Policy Insights for Villeneuve-le-Comte
- The prevailing Airbnb cancellation policy trend in Villeneuve-le-Comte is Moderate, used by 52.9% of listings.
- The market strongly favors guest-friendly terms, with 88.2% of listings offering Flexible or Moderate policies. This suggests guests in Villeneuve-le-Comte may expect booking flexibility.
Recommendations for Hosts
- Consider adopting a Moderate policy to align with the 52.9% market standard in Villeneuve-le-Comte.
- Regularly review your cancellation policy against competitors and market demand shifts in Villeneuve-le-Comte.
Villeneuve-le-Comte STR Booking Lead Time Analysis (2025)
Average Booking Lead Time by Month
Booking Lead Time Insights for Villeneuve-le-Comte
- The overall average booking lead time for vacation rentals in Villeneuve-le-Comte is 52 days.
- Guests book furthest in advance for stays during May (average 87 days), likely coinciding with peak travel demand or local events.
- The shortest booking windows occur for stays in February (average 30 days), indicating more last-minute travel plans during this time.
- Seasonally, Spring (62 days avg.) sees the longest lead times, while Winter (36 days avg.) has the shortest, reflecting typical travel planning cycles.
Recommendations for Hosts
- Use the overall average lead time (52 days) as a baseline for your pricing and availability strategy in Villeneuve-le-Comte.
- For May stays, consider implementing length-of-stay discounts or slightly higher rates for bookings made less than 87 days out to capitalize on advance planning.
- Target marketing efforts for the Spring season well in advance (at least 62 days) to capture early planners.
- Monitor your own booking lead times against these Villeneuve-le-Comte averages to identify opportunities for dynamic pricing adjustments.
Popular & Essential Airbnb Amenities in Villeneuve-le-Comte (2025)
Amenity Prevalence
Amenity Insights for Villeneuve-le-Comte
- Essential amenities in Villeneuve-le-Comte that guests expect include: Heating, Kitchen. Lacking these (any) could significantly impact bookings.
- Popular amenities like TV, Hot water, Wifi are common but not universal. Offering these can provide a competitive edge.
- Warning: Wifi is not universally provided but is considered essential globally. Ensure reliable Wifi is offered.
Recommendations for Hosts
- Ensure your listing includes all essential amenities for Villeneuve-le-Comte: Heating, Kitchen.
- Consider adding popular differentiators like TV or Hot water to increase appeal.
- Highlight unique or less common amenities you offer (e.g., hot tub, dedicated workspace, EV charger) in your listing description and photos.
- Regularly check competitor amenities in Villeneuve-le-Comte to stay competitive.
Villeneuve-le-Comte Airbnb Guest Demographics & Profile Analysis (2025)
Guest Profile Summary for Villeneuve-le-Comte
- The typical guest profile for Airbnb in Villeneuve-le-Comte consists of a mix of domestic (61%) and international guests, often arriving from nearby Paris, typically belonging to the Post-2000s (Gen Z/Alpha) group (50%), primarily speaking French or English.
- Domestic travelers account for 60.9% of guests.
- Key international markets include France (60.9%) and United Kingdom (10.9%).
- Top languages spoken are French (36.3%) followed by English (30%).
- A significant demographic segment is the Post-2000s (Gen Z/Alpha) group, representing 50% of guests.
Recommendations for Hosts
- Target domestic marketing efforts towards travelers from Paris and London.
- Tailor amenities and listing descriptions to appeal to the dominant Post-2000s (Gen Z/Alpha) demographic (e.g., highlight fast WiFi, smart home features, local guides).
- Highlight unique local experiences or amenities relevant to the primary guest profile.
- Consider seasonal promotions aligned with peak travel times for key origin markets.
Nearby Short-Term Rental Market Comparison
How does the Villeneuve-le-Comte Airbnb market stack up against its neighbors? Compare key performance metrics like average monthly revenue, ADR, and occupancy rates in surrounding areas to understand the broader regional STR landscape.
| Market | Active Properties | Monthly Revenue | Daily Rate | Avg. Occupancy |
|---|---|---|---|---|
| Égreville | 10 | $4,906 | $517.56 | 41% |
| La Couture-Boussey | 11 | $4,496 | $460.91 | 29% |
| Morienval | 12 | $4,489 | $387.24 | 31% |
| Dizy | 11 | $3,991 | $254.19 | 48% |
| Rosoy-en-Multien | 15 | $3,605 | $365.25 | 48% |
| Muids | 14 | $3,391 | $409.94 | 35% |
| Mesnils-sur-Iton | 25 | $3,340 | $354.66 | 38% |
| Montrieux-en-Sologne | 13 | $3,286 | $464.19 | 31% |
| Maslives | 17 | $3,178 | $315.08 | 40% |
| Trélou-sur-Marne | 10 | $3,170 | $213.51 | 50% |