Drancy Airbnb Market Analysis 2026: Short Term Rental Data & Vacation Rental Statistics in Ile-de-France, France
Is Airbnb profitable in Drancy in 2026? Explore comprehensive Airbnb analytics for Drancy, Ile-de-France, France to uncover income potential. This 2026 STR market report for Drancy, based on AirROI data from February 2025 to January 2026, reveals key trends in the niche market of 134 active listings.
Whether you're considering an Airbnb investment in Drancy, optimizing your existing vacation rental, or exploring rental arbitrage opportunities, understanding the Drancy Airbnb data is crucial. Leveraging the low regulation environment is key to maximizing your short term rental income potential. Let's dive into the specifics.
Key Drancy Airbnb Performance Metrics Overview
Monthly Airbnb Revenue Variations & Income Potential in Drancy (2026)
Understanding the monthly revenue variations for Airbnb listings in Drancy is key to maximizing your short term rental income potential. Seasonality significantly impacts earnings. Our analysis, based on data from the past 12 months, shows that the peak revenue month for STRs in Drancy is typically June, while January often presents the lowest earnings, highlighting opportunities for strategic pricing adjustments during shoulder and low seasons. Explore the typical Airbnb income in Drancy across different performance tiers:
- Best-in-class properties (Top 10%) achieve $3,192+ monthly, often utilizing dynamic pricing and superior guest experiences.
- Strong performing properties (Top 25%) earn $1,895 or more, indicating effective management and desirable locations/amenities.
- Typical properties (Median) generate around $1,171 per month, representing the average market performance.
- Entry-level properties (Bottom 25%) see earnings around $557, often with potential for optimization.
Average Monthly Airbnb Earnings Trend in Drancy
Drancy Airbnb Occupancy Rate Trends (2026)
Maximize your bookings by understanding the Drancy STR occupancy trends. Seasonal demand shifts significantly influence how often properties are booked. Typically, Junesees the highest demand (peak season occupancy), while January experiences the lowest (low season). Effective strategies, like adjusting minimum stays or offering promotions, can boost occupancy during slower periods. Here's how different property tiers perform in Drancy:
- Best-in-class properties (Top 10%) achieve 83%+ occupancy, indicating high desirability and potentially optimized availability.
- Strong performing properties (Top 25%) maintain 66% or higher occupancy, suggesting good market fit and guest satisfaction.
- Typical properties (Median) have an occupancy rate around 41%.
- Entry-level properties (Bottom 25%) average 20% occupancy, potentially facing higher vacancy.
Average Monthly Occupancy Rate Trend in Drancy
Average Daily Rate (ADR) Airbnb Trends in Drancy (2026)
Effective short term rental pricing strategy in Drancy involves understanding monthly ADR fluctuations. The Average Daily Rate (ADR) for Airbnb in Drancy typically peaks in September and dips lowest during March. Leveraging Airbnb dynamic pricing tools or strategies based on this seasonality can significantly boost revenue. Here's a look at the typical nightly rates achieved:
- Best-in-class properties (Top 10%) command rates of $193+ per night, often due to premium features or locations.
- Strong performing properties (Top 25%) achieve nightly rates of $131 or more.
- Typical properties (Median) charge around $86 per night.
- Entry-level properties (Bottom 25%) earn around $64 per night.
Average Daily Rate (ADR) Trend by Month in Drancy
Get Live Drancy Market Intelligence 👇

Explore Real-time Analytics
Airbnb Seasonality Analysis & Trends in Drancy (2026)
Peak Season (June, September, October)
- Revenue averages $1,815 per month
- Occupancy rates average 51.0%
- Daily rates average $114
Shoulder Season
- Revenue averages $1,521 per month
- Occupancy maintains around 44.6%
- Daily rates hold near $110
Low Season (January, February, March)
- Revenue drops to average $1,013 per month
- Occupancy decreases to average 36.0%
- Daily rates adjust to average $105
Seasonality Insights for Drancy
- The Airbnb seasonality in Drancy shows moderate seasonality with distinct peak and low periods. While the sections above show seasonal averages, it's also insightful to look at the extremes:
- During the high season, the absolute peak month showcases Drancy's highest earning potential, with monthly revenues capable of climbing to $1,864, occupancy reaching a high of 55.9%, and ADRs peaking at $120.
- Conversely, the slowest single month of the year, typically falling within the low season, marks the market's lowest point. In this month, revenue might dip to $983, occupancy could drop to 26.9%, and ADRs may adjust down to $102.
- Understanding both the seasonal averages and these monthly peaks and troughs in revenue, occupancy, and ADR is crucial for maximizing your Airbnb profit potential in Drancy.
Seasonal Strategies for Maximizing Profit
- Peak Season: Maximize revenue through premium pricing and potentially longer minimum stays. Ensure high availability.
- Low Season: Offer competitive pricing, special promotions (e.g., extended stay discounts), and flexible cancellation policies. Target off-season travelers like remote workers or budget-conscious guests.
- Shoulder Seasons: Implement dynamic pricing that balances peak and low rates. Target weekend travelers or specific events. Offer slightly more flexible terms than peak season.
- Regularly analyze your own performance against these Drancy seasonality benchmarks and adjust your pricing and availability strategy accordingly.
Best Areas for Airbnb Investment in Drancy (2026)
Exploring the top neighborhoods for short-term rentals in Drancy? This section highlights key areas, outlining why they are attractive for hosts and guests, along with notable local attractions. Consider these locations based on your target guest profile and investment strategy.
| Neighborhood / Area | Why Host Here? (Target Guests & Appeal) | Key Attractions & Landmarks |
|---|---|---|
| Centre Ville | The bustling downtown area with shops, restaurants, and easy access to public transport. A prime location for tourists who want to explore Paris nearby. | Marché de Drancy, Église Saint-Jean-Baptiste, Parc de la mairie, Cinema Le Trianon, Local dining spots |
| Parc de la Courneuve | A serene area with expansive parks and recreational opportunities, appealing to families and nature lovers looking for a quiet stay. | Parc de la Courneuve, Cité des Sciences et de l'Industrie, Parc Georges-Valbon, Musee de l'Air et de l'Espace |
| Drancy’s Historical District | Rich in history with charming architecture and cultural sites, perfect for those interested in heritage tourism. | Château de Ladoucette, Memorial de la Shoah, Parc des Right of Man, Cultural festivals |
| Porte de la Villette | Nearby access to Paris and the Villette Park, ideal for travelers wanting city access with a more relaxed environment. | Parc de la Villette, Cite des Sciences et de l'Industrie, Philharmonie de Paris |
| Le Bourget | A neighboring town known for its airport and air show, great for business travelers or aviation enthusiasts. | Le Bourget Airport, Museum of Air and Space, Parc de la Légion d'Honneur |
| Bondy | A suburban area that offers close proximity to both nature and the city's attractions, suitable for families and longer stays. | City Park, Local markets, Historical buildings |
| Bobigny | A multicultural area with diverse shops and restaurants, attracting a variety of guests; a real taste of local life. | Bobigny Cathedral, Aquarium la Géode, Cultural hubs |
| Aulnay-sous-Bois | A well-connected suburban town that is affordable and great for families or groups looking to explore Paris without being right in the tourist hub. | Parc de la Noue, Local parks and recreation areas, Shopping centers |
Understanding Airbnb License Requirements & STR Laws in Drancy (2026)
While Drancy, Ile-de-France, France currently shows low STR regulations, specific Airbnb license requirements might still exist or change. Always verify the latest short term rental regulations and Airbnb license requirements directly with local government authorities for Drancy to ensure full compliance before hosting.
(Source: AirROI data, 2026, based on 3% licensed listings)
Top Performing Airbnb Properties in Drancy (2026)
Benchmark your potential! Explore examples of top-performing Airbnb properties in Drancybased on Trailing Twelve Month (TTM) revenue. Analyze their characteristics, revenue, occupancy rate, and ADR to understand what drives success in this market.
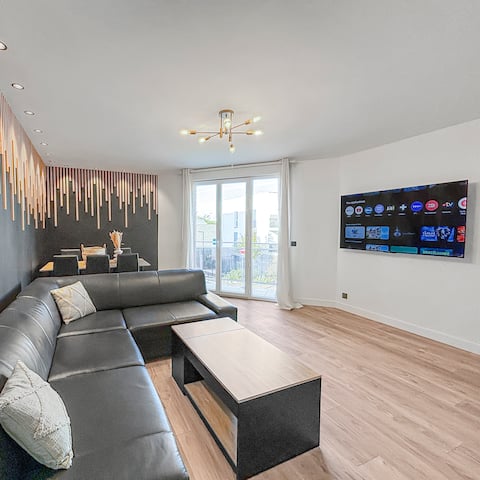
Modern comfort, Paris & Le Bourget
Entire Place • 3 bedrooms

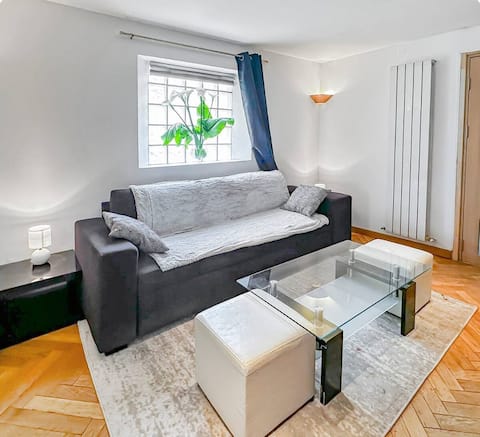
Exceptional villa near Paris: terrace & garden
Entire Place • 4 bedrooms
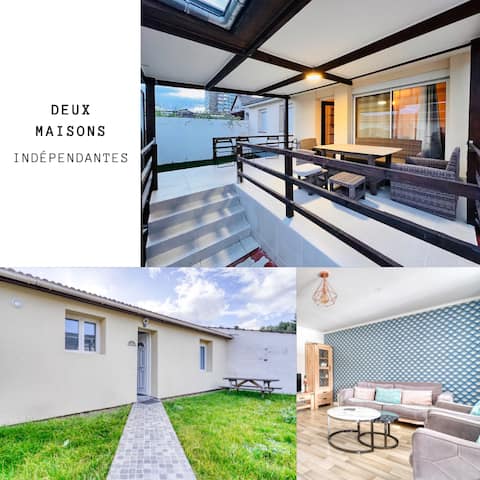
2 independent houses near Paris + Parking
Entire Place • 5 bedrooms
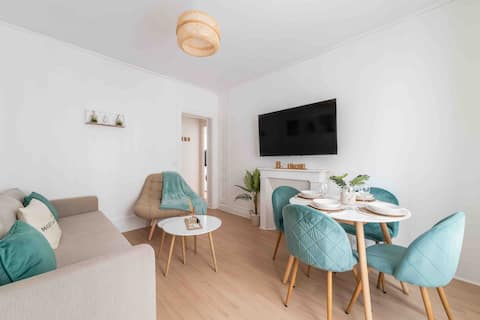
Cozy & Chill - Close to Paris - CDG
Entire Place • 1 bedroom
Friendly house - Near Roissy airport
Entire Place • 5 bedrooms
House Drancy
Entire Place • 4 bedrooms
Note: Performance varies based on location, size, amenities, seasonality, and management quality. Data reflects the past 12 months.
Top Performing Airbnb Hosts in Drancy (2026)
Learn from the best! This table showcases top-performing Airbnb hosts in Drancy based on the number of properties managed and estimated total revenue over the past year. Analyze their scale and performance metrics.
| Host Name | Properties | Grossing Revenue | Stay Reviews | Avg Rating |
|---|---|---|---|---|
| Sam | 8 | $175,989 | 389 | 4.74/5.0 |
| Julien | 1 | $51,256 | 64 | 4.78/5.0 |
| Belhocine | 2 | $46,574 | 104 | 4.92/5.0 |
| Delphine | 1 | $40,873 | 192 | 4.86/5.0 |
| Florian | 2 | $38,552 | 79 | 4.71/5.0 |
| Dusan | 1 | $36,530 | 21 | 4.29/5.0 |
| Dominique | 1 | $35,422 | 103 | 4.57/5.0 |
| Mireille | 4 | $35,047 | 177 | 4.54/5.0 |
| Jean | 2 | $33,867 | 281 | 4.93/5.0 |
| Maurice | 2 | $33,768 | 218 | 4.75/5.0 |
Analyzing the strategies of top hosts, such as their property selection, pricing, and guest communication, can offer valuable lessons for optimizing your own Airbnb operations in Drancy.
Dive Deeper: Advanced Drancy STR Market Data (2026)
Ready to unlock more insights? AirROI provides access to advanced metrics and comprehensive Airbnb data for Drancy. Explore detailed analytics beyond this report to refine your investment strategy, optimize pricing, and maximize your vacation rental profits.
Explore Advanced MetricsDrancy Short-Term Rental Market Composition (2026): Property & Room Types
Room Type Distribution
Property Type Distribution
Market Composition Insights for Drancy
- The Drancy Airbnb market composition is heavily skewed towards Entire Home/Apt listings, which make up 82.1% of the 134 active rentals. This indicates strong guest preference for privacy and space.
- Looking at the property type distribution in Drancy, Apartment/Condo properties are the most common (64.9%), reflecting the local real estate landscape.
- Houses represent a significant 31.3% portion, catering likely to families or larger groups.
- Smaller segments like hotel/boutique (combined 3.7%) offer potential for unique stay experiences.
Drancy Airbnb Room Capacity Analysis (2026): Bedroom Distribution
Distribution of Listings by Number of Bedrooms
Room Capacity Insights for Drancy
- The dominant room capacity in Drancy is 1 bedroom listings, making up 47.8% of the market. This suggests a strong demand for properties suitable for couples or solo travelers.
- Together, 1 bedroom and 2 bedrooms properties represent 63.5% of the active Airbnb listings in Drancy, indicating a high concentration in these sizes.
Drancy Vacation Rental Guest Capacity Trends (2026)
Distribution of Listings by Guest Capacity
Guest Capacity Insights for Drancy
- The most common guest capacity trend in Drancy vacation rentals is listings accommodating 2 guests (34.3%). This suggests the primary traveler segment is likely couples or solo travelers.
- Properties designed for 2 guests and 4 guests dominate the Drancy STR market, accounting for 54.4% of listings.
- 17.1% of properties accommodate 6+ guests, serving the market segment for larger families or group travel in Drancy.
- On average, properties in Drancy are equipped to host 3.2 guests.
Drancy Airbnb Booking Patterns (2026): Available vs. Booked Days
Available Days Distribution
Booked Days Distribution
Booking Pattern Insights for Drancy
- The most common availability pattern in Drancy falls within the 271-366 days range, representing 46.3% of listings. This suggests many properties have significant open periods on their calendars.
- Approximately 79.1% of listings show high availability (181+ days open annually), indicating potential for increased bookings or specific owner usage patterns.
- For booked days, the 91-180 days range is most frequent in Drancy (33.6%), reflecting common guest stay durations or potential owner blocking patterns.
- A notable 21.7% of properties secure long booking periods (181+ days booked per year), highlighting successful long-term rental strategies or significant owner usage.
Drancy Airbnb Minimum Stay Requirements Analysis
Distribution of Listings by Minimum Night Requirement
1 Night
55 listings
41% of total
2 Nights
25 listings
18.7% of total
3 Nights
10 listings
7.5% of total
4-6 Nights
4 listings
3% of total
7-29 Nights
3 listings
2.2% of total
30+ Nights
37 listings
27.6% of total
Key Insights
- The most prevalent minimum stay requirement in Drancy is 1 Night, adopted by 41% of listings. This highlights the market's preference for shorter, flexible bookings.
- A significant segment (27.6%) caters to monthly stays (30+ nights) in Drancy, pointing to opportunities in the extended-stay market.
Recommendations
- Align with the market by considering a 1 Night minimum stay, as 41% of Drancy hosts use this setting.
- Explore offering discounts for stays of 30+ nights to attract the 27.6% of the market seeking extended stays.
- Adjust minimum nights based on seasonality – potentially shorter during low season and longer during peak demand periods in Drancy.
Drancy Airbnb Cancellation Policy Trends Analysis (2026)
Limited
3 listings
2.3% of total
Flexible
47 listings
35.6% of total
Moderate
41 listings
31.1% of total
Firm
25 listings
18.9% of total
Strict
16 listings
12.1% of total
Cancellation Policy Insights for Drancy
- The prevailing Airbnb cancellation policy trend in Drancy is Flexible, used by 35.6% of listings.
- There's a relatively balanced mix between guest-friendly (66.7%) and stricter (31.0%) policies, offering choices for different guest needs.
Recommendations for Hosts
- Consider adopting a Flexible policy to align with the 35.6% market standard in Drancy.
- Using a Strict policy might deter some guests, as only 12.1% of listings use it. Evaluate if potential revenue protection outweighs possible lower booking rates.
- Regularly review your cancellation policy against competitors and market demand shifts in Drancy.
Drancy STR Booking Lead Time Analysis (2026)
Average Booking Lead Time by Month
Booking Lead Time Insights for Drancy
- The overall average booking lead time for vacation rentals in Drancy is 29 days.
- Guests book furthest in advance for stays during June (average 41 days), likely coinciding with peak travel demand or local events.
- The shortest booking windows occur for stays in February (average 15 days), indicating more last-minute travel plans during this time.
- Seasonally, Summer (37 days avg.) sees the longest lead times, while Winter (22 days avg.) has the shortest, reflecting typical travel planning cycles.
Recommendations for Hosts
- Use the overall average lead time (29 days) as a baseline for your pricing and availability strategy in Drancy.
- For June stays, consider implementing length-of-stay discounts or slightly higher rates for bookings made less than 41 days out to capitalize on advance planning.
- Target marketing efforts for the Summer season well in advance (at least 37 days) to capture early planners.
- Monitor your own booking lead times against these Drancy averages to identify opportunities for dynamic pricing adjustments.
Popular & Essential Airbnb Amenities in Drancy (2026)
Amenity Prevalence
Amenity Insights for Drancy
- Popular amenities like Wifi, Kitchen, Hot water are common but not universal. Offering these can provide a competitive edge.
- Warning: Wifi is not universally provided but is considered essential globally. Ensure reliable Wifi is offered.
Recommendations for Hosts
- Consider adding popular differentiators like Wifi or Kitchen to increase appeal.
- Highlight unique or less common amenities you offer (e.g., hot tub, dedicated workspace, EV charger) in your listing description and photos.
- Regularly check competitor amenities in Drancy to stay competitive.
Drancy Airbnb Guest Demographics & Profile Analysis (2026)
Guest Profile Summary for Drancy
- The typical guest profile for Airbnb in Drancy consists of primarily domestic travelers (66%), often arriving from nearby Paris, typically belonging to the Post-2000s (Gen Z/Alpha) group (50%), primarily speaking French or English.
- Domestic travelers account for 66.1% of guests.
- Key international markets include France (66.1%) and United Kingdom (5.4%).
- Top languages spoken are French (40.8%) followed by English (31.2%).
- A significant demographic segment is the Post-2000s (Gen Z/Alpha) group, representing 50% of guests.
Recommendations for Hosts
- Target domestic marketing efforts towards travelers from Paris and Grenoble.
- Tailor amenities and listing descriptions to appeal to the dominant Post-2000s (Gen Z/Alpha) demographic (e.g., highlight fast WiFi, smart home features, local guides).
- Highlight unique local experiences or amenities relevant to the primary guest profile.
- Consider seasonal promotions aligned with peak travel times for key origin markets.
Nearby Short-Term Rental Market Comparison
How does the Drancy Airbnb market stack up against its neighbors? Compare key performance metrics like average monthly revenue, ADR, and occupancy rates in surrounding areas to understand the broader regional STR landscape.
| Market | Active Properties | Monthly Revenue | Daily Rate | Avg. Occupancy |
|---|---|---|---|---|
| Égreville | 12 | $4,969 | $447.83 | 40% |
| Dizy | 11 | $4,106 | $250.48 | 49% |
| La Couture-Boussey | 11 | $4,086 | $464.04 | 28% |
| Menetou-Râtel | 10 | $3,844 | $353.11 | 34% |
| Rosoy-en-Multien | 15 | $3,680 | $347.93 | 47% |
| Morienval | 12 | $3,308 | $372.82 | 30% |
| Achères-la-Forêt | 35 | $3,136 | $348.74 | 44% |
| Mesnils-sur-Iton | 24 | $3,099 | $348.65 | 41% |
| Paris | 39,295 | $3,085 | $257.47 | 52% |
| Maslives | 17 | $2,994 | $317.61 | 39% |