Aubervilliers Airbnb Market Analysis 2026: Short Term Rental Data & Vacation Rental Statistics in Ile-de-France, France
Is Airbnb profitable in Aubervilliers in 2026? Explore comprehensive Airbnb analytics for Aubervilliers, Ile-de-France, France to uncover income potential. This 2026 STR market report for Aubervilliers, based on AirROI data from February 2025 to January 2026, reveals key trends in the market of 430 active listings.
Whether you're considering an Airbnb investment in Aubervilliers, optimizing your existing vacation rental, or exploring rental arbitrage opportunities, understanding the Aubervilliers Airbnb data is crucial. Leveraging the low regulation environment is key to maximizing your short term rental income potential. Let's dive into the specifics.
Key Aubervilliers Airbnb Performance Metrics Overview
Monthly Airbnb Revenue Variations & Income Potential in Aubervilliers (2026)
Understanding the monthly revenue variations for Airbnb listings in Aubervilliers is key to maximizing your short term rental income potential. Seasonality significantly impacts earnings. Our analysis, based on data from the past 12 months, shows that the peak revenue month for STRs in Aubervilliers is typically October, while February often presents the lowest earnings, highlighting opportunities for strategic pricing adjustments during shoulder and low seasons. Explore the typical Airbnb income in Aubervilliers across different performance tiers:
- Best-in-class properties (Top 10%) achieve $3,485+ monthly, often utilizing dynamic pricing and superior guest experiences.
- Strong performing properties (Top 25%) earn $2,248 or more, indicating effective management and desirable locations/amenities.
- Typical properties (Median) generate around $1,389 per month, representing the average market performance.
- Entry-level properties (Bottom 25%) see earnings around $718, often with potential for optimization.
Average Monthly Airbnb Earnings Trend in Aubervilliers
Aubervilliers Airbnb Occupancy Rate Trends (2026)
Maximize your bookings by understanding the Aubervilliers STR occupancy trends. Seasonal demand shifts significantly influence how often properties are booked. Typically, Octobersees the highest demand (peak season occupancy), while January experiences the lowest (low season). Effective strategies, like adjusting minimum stays or offering promotions, can boost occupancy during slower periods. Here's how different property tiers perform in Aubervilliers:
- Best-in-class properties (Top 10%) achieve 87%+ occupancy, indicating high desirability and potentially optimized availability.
- Strong performing properties (Top 25%) maintain 73% or higher occupancy, suggesting good market fit and guest satisfaction.
- Typical properties (Median) have an occupancy rate around 49%.
- Entry-level properties (Bottom 25%) average 23% occupancy, potentially facing higher vacancy.
Average Monthly Occupancy Rate Trend in Aubervilliers
Average Daily Rate (ADR) Airbnb Trends in Aubervilliers (2026)
Effective short term rental pricing strategy in Aubervilliers involves understanding monthly ADR fluctuations. The Average Daily Rate (ADR) for Airbnb in Aubervilliers typically peaks in September and dips lowest during March. Leveraging Airbnb dynamic pricing tools or strategies based on this seasonality can significantly boost revenue. Here's a look at the typical nightly rates achieved:
- Best-in-class properties (Top 10%) command rates of $206+ per night, often due to premium features or locations.
- Strong performing properties (Top 25%) achieve nightly rates of $142 or more.
- Typical properties (Median) charge around $99 per night.
- Entry-level properties (Bottom 25%) earn around $72 per night.
Average Daily Rate (ADR) Trend by Month in Aubervilliers
Get Live Aubervilliers Market Intelligence 👇

Explore Real-time Analytics
Airbnb Seasonality Analysis & Trends in Aubervilliers (2026)
Peak Season (October, September, June)
- Revenue averages $2,108 per month
- Occupancy rates average 55.0%
- Daily rates average $127
Shoulder Season
- Revenue averages $1,753 per month
- Occupancy maintains around 48.0%
- Daily rates hold near $123
Low Season (January, February, March)
- Revenue drops to average $1,321 per month
- Occupancy decreases to average 43.2%
- Daily rates adjust to average $117
Seasonality Insights for Aubervilliers
- The Airbnb seasonality in Aubervilliers shows moderate seasonality with distinct peak and low periods. While the sections above show seasonal averages, it's also insightful to look at the extremes:
- During the high season, the absolute peak month showcases Aubervilliers's highest earning potential, with monthly revenues capable of climbing to $2,259, occupancy reaching a high of 56.4%, and ADRs peaking at $129.
- Conversely, the slowest single month of the year, typically falling within the low season, marks the market's lowest point. In this month, revenue might dip to $1,222, occupancy could drop to 34.3%, and ADRs may adjust down to $114.
- Understanding both the seasonal averages and these monthly peaks and troughs in revenue, occupancy, and ADR is crucial for maximizing your Airbnb profit potential in Aubervilliers.
Seasonal Strategies for Maximizing Profit
- Peak Season: Maximize revenue through premium pricing and potentially longer minimum stays. Ensure high availability.
- Low Season: Offer competitive pricing, special promotions (e.g., extended stay discounts), and flexible cancellation policies. Target off-season travelers like remote workers or budget-conscious guests.
- Shoulder Seasons: Implement dynamic pricing that balances peak and low rates. Target weekend travelers or specific events. Offer slightly more flexible terms than peak season.
- Regularly analyze your own performance against these Aubervilliers seasonality benchmarks and adjust your pricing and availability strategy accordingly.
Best Areas for Airbnb Investment in Aubervilliers (2026)
Exploring the top neighborhoods for short-term rentals in Aubervilliers? This section highlights key areas, outlining why they are attractive for hosts and guests, along with notable local attractions. Consider these locations based on your target guest profile and investment strategy.
| Neighborhood / Area | Why Host Here? (Target Guests & Appeal) | Key Attractions & Landmarks |
|---|---|---|
| Porte de la Villette | A vibrant area with a mix of culture and leisure activities, close to the Parc de la Villette and modern architecture. Attracts visitors seeking a blend of nature and urban experience. | Parc de la Villette, Cité des Sciences et de l'Industrie, Cité de la Musique, Philharmonie de Paris, Zénith Paris, La Géode |
| Aubervilliers Town Center | The heart of Aubervilliers with local shops, restaurants and close proximity to public transport, making it a convenient location for guests. | Place de la Mairie, Café de la Paix, Local markets, Aubervilliers Community Center |
| Fort d'Aubervilliers | An area experiencing ongoing development and gentrification, attracting both business and leisure travelers. Close to the Ring Road for fast access to Paris. | Canal de l'Ourcq, Le Parc de la Bergère, Local eateries, Nice views of the industrial areas |
| Quai de Seine | Scenic area along the Seine River, offering beautiful views and relaxing walks. Attractive to tourists wanting a picturesque environment near Paris. | Seine River walks, Green spaces along the river, Local cafes and bistros |
| Marché couvert d'Aubervilliers | A vibrant local market offering a taste of the local culture and cuisine, perfect for guests wanting an authentic French experience. | Fresh produce stalls, Local delicacies, Cultural events at the market |
| Stade de France | Located near the iconic stadium, this area attracts sports fans and concert-goers, providing plenty of activity and entertainment options. | Stade de France tours, Nearby shopping centers, Concerts and events |
| Cité des Sciences | An educational center attracting families and science enthusiasts, making it a popular location for visitors interested in learning and exploration. | Cité des Sciences et de l'Industrie, Exhibitions and workshops, Nearby parks |
| Aubervilliers Metro Station | Optimal for commuters and tourists with easy access to Paris via public transport, making it a practical choice for short-term rentals. | Direct Metro line to Paris, Local shops nearby, Convenient location for city exploration |
Understanding Airbnb License Requirements & STR Laws in Aubervilliers (2026)
While Aubervilliers, Ile-de-France, France currently shows low STR regulations, specific Airbnb license requirements might still exist or change. Always verify the latest short term rental regulations and Airbnb license requirements directly with local government authorities for Aubervilliers to ensure full compliance before hosting.
(Source: AirROI data, 2026, based on 3% licensed listings)
Top Performing Airbnb Properties in Aubervilliers (2026)
Benchmark your potential! Explore examples of top-performing Airbnb properties in Aubervilliersbased on Trailing Twelve Month (TTM) revenue. Analyze their characteristics, revenue, occupancy rate, and ADR to understand what drives success in this market.
Entire House Paris-Stade de France
Entire Place • 5 bedrooms

Apartment with Terrace and Hot Tub
Entire Place • 3 bedrooms

House near Stade de France
Entire Place • 3 bedrooms
Magnifique duplex familial métro 12 nord de Paris.
Entire Place • 3 bedrooms
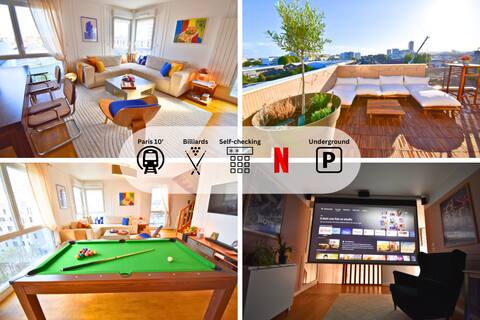
Le Belvédère Parisien – Terrace, Pool table
Entire Place • 3 bedrooms

Penthouse / Private Terrasse, Jacuzzi & Gym room
Entire Place • 1 bedroom
Note: Performance varies based on location, size, amenities, seasonality, and management quality. Data reflects the past 12 months.
Top Performing Airbnb Hosts in Aubervilliers (2026)
Learn from the best! This table showcases top-performing Airbnb hosts in Aubervilliers based on the number of properties managed and estimated total revenue over the past year. Analyze their scale and performance metrics.
| Host Name | Properties | Grossing Revenue | Stay Reviews | Avg Rating |
|---|---|---|---|---|
| Maximilien | 6 | $256,348 | 313 | 4.64/5.0 |
| Newelle | 6 | $229,755 | 912 | 4.54/5.0 |
| Dina | 13 | $182,676 | 532 | 4.59/5.0 |
| Jean-Michel | 4 | $158,135 | 101 | 4.88/5.0 |
| Rose & Thomas Raphael | 3 | $143,245 | 144 | 4.92/5.0 |
| Laurène | 1 | $104,064 | 184 | 4.94/5.0 |
| Xiaolong | 7 | $92,104 | 205 | 4.34/5.0 |
| Coraline | 1 | $85,016 | 42 | 4.74/5.0 |
| Jeanne | 2 | $81,916 | 185 | 4.80/5.0 |
| François | 1 | $68,541 | 71 | 4.99/5.0 |
Analyzing the strategies of top hosts, such as their property selection, pricing, and guest communication, can offer valuable lessons for optimizing your own Airbnb operations in Aubervilliers.
Dive Deeper: Advanced Aubervilliers STR Market Data (2026)
Ready to unlock more insights? AirROI provides access to advanced metrics and comprehensive Airbnb data for Aubervilliers. Explore detailed analytics beyond this report to refine your investment strategy, optimize pricing, and maximize your vacation rental profits.
Explore Advanced MetricsAubervilliers Short-Term Rental Market Composition (2026): Property & Room Types
Room Type Distribution
Property Type Distribution
Market Composition Insights for Aubervilliers
- The Aubervilliers Airbnb market composition is heavily skewed towards Entire Home/Apt listings, which make up 81.9% of the 430 active rentals. This indicates strong guest preference for privacy and space.
- Looking at the property type distribution in Aubervilliers, Apartment/Condo properties are the most common (84.9%), reflecting the local real estate landscape.
- Smaller segments like hotel/boutique (combined 2.6%) offer potential for unique stay experiences.
Aubervilliers Airbnb Room Capacity Analysis (2026): Bedroom Distribution
Distribution of Listings by Number of Bedrooms
Room Capacity Insights for Aubervilliers
- The dominant room capacity in Aubervilliers is 1 bedroom listings, making up 48.1% of the market. This suggests a strong demand for properties suitable for couples or solo travelers.
- Together, 1 bedroom and 2 bedrooms properties represent 65.3% of the active Airbnb listings in Aubervilliers, indicating a high concentration in these sizes.
Aubervilliers Vacation Rental Guest Capacity Trends (2026)
Distribution of Listings by Guest Capacity
Guest Capacity Insights for Aubervilliers
- The most common guest capacity trend in Aubervilliers vacation rentals is listings accommodating 4 guests (29.8%). This suggests the primary traveler segment is likely small families or groups.
- Properties designed for 4 guests and 2 guests dominate the Aubervilliers STR market, accounting for 55.1% of listings.
- 19.3% of properties accommodate 6+ guests, serving the market segment for larger families or group travel in Aubervilliers.
- On average, properties in Aubervilliers are equipped to host 3.3 guests.
Aubervilliers Airbnb Booking Patterns (2026): Available vs. Booked Days
Available Days Distribution
Booked Days Distribution
Booking Pattern Insights for Aubervilliers
- The most common availability pattern in Aubervilliers falls within the 271-366 days range, representing 44.2% of listings. This suggests many properties have significant open periods on their calendars.
- Approximately 73.3% of listings show high availability (181+ days open annually), indicating potential for increased bookings or specific owner usage patterns.
- For booked days, the 91-180 days range is most frequent in Aubervilliers (28.1%), reflecting common guest stay durations or potential owner blocking patterns.
- A notable 28.3% of properties secure long booking periods (181+ days booked per year), highlighting successful long-term rental strategies or significant owner usage.
Aubervilliers Airbnb Minimum Stay Requirements Analysis
Distribution of Listings by Minimum Night Requirement
1 Night
106 listings
24.7% of total
2 Nights
101 listings
23.5% of total
3 Nights
41 listings
9.5% of total
4-6 Nights
23 listings
5.3% of total
7-29 Nights
19 listings
4.4% of total
30+ Nights
140 listings
32.6% of total
Key Insights
- The most prevalent minimum stay requirement in Aubervilliers is 30+ Nights, adopted by 32.6% of listings. This highlights the market's preference for longer commitments.
- A significant segment (32.6%) caters to monthly stays (30+ nights) in Aubervilliers, pointing to opportunities in the extended-stay market.
Recommendations
- Align with the market by considering a 30+ Nights minimum stay, as 32.6% of Aubervilliers hosts use this setting.
- If feasible, allowing 1-night stays, especially midweek or during low season, could capture last-minute bookings, as only 24.7% currently do.
- Explore offering discounts for stays of 30+ nights to attract the 32.6% of the market seeking extended stays.
- Adjust minimum nights based on seasonality – potentially shorter during low season and longer during peak demand periods in Aubervilliers.
Aubervilliers Airbnb Cancellation Policy Trends Analysis (2026)
Super Strict 60 Days
1 listings
0.2% of total
Limited
2 listings
0.5% of total
Super Strict 30 Days
7 listings
1.7% of total
Flexible
113 listings
26.7% of total
Moderate
122 listings
28.8% of total
Firm
132 listings
31.1% of total
Strict
47 listings
11.1% of total
Cancellation Policy Insights for Aubervilliers
- The prevailing Airbnb cancellation policy trend in Aubervilliers is Firm, used by 31.1% of listings.
- There's a relatively balanced mix between guest-friendly (55.5%) and stricter (42.2%) policies, offering choices for different guest needs.
Recommendations for Hosts
- Consider adopting a Firm policy to align with the 31.1% market standard in Aubervilliers.
- Using a Strict policy might deter some guests, as only 11.1% of listings use it. Evaluate if potential revenue protection outweighs possible lower booking rates.
- Regularly review your cancellation policy against competitors and market demand shifts in Aubervilliers.
Aubervilliers STR Booking Lead Time Analysis (2026)
Average Booking Lead Time by Month
Booking Lead Time Insights for Aubervilliers
- The overall average booking lead time for vacation rentals in Aubervilliers is 41 days.
- Guests book furthest in advance for stays during July (average 69 days), likely coinciding with peak travel demand or local events.
- The shortest booking windows occur for stays in February (average 25 days), indicating more last-minute travel plans during this time.
- Seasonally, Summer (58 days avg.) sees the longest lead times, while Winter (32 days avg.) has the shortest, reflecting typical travel planning cycles.
Recommendations for Hosts
- Use the overall average lead time (41 days) as a baseline for your pricing and availability strategy in Aubervilliers.
- For July stays, consider implementing length-of-stay discounts or slightly higher rates for bookings made less than 69 days out to capitalize on advance planning.
- Target marketing efforts for the Summer season well in advance (at least 58 days) to capture early planners.
- Monitor your own booking lead times against these Aubervilliers averages to identify opportunities for dynamic pricing adjustments.
Popular & Essential Airbnb Amenities in Aubervilliers (2026)
Amenity Prevalence
Amenity Insights for Aubervilliers
- Essential amenities in Aubervilliers that guests expect include: Kitchen. Lacking these (this) could significantly impact bookings.
- Popular amenities like Wifi, Heating, Hot water are common but not universal. Offering these can provide a competitive edge.
- Warning: Wifi is not universally provided but is considered essential globally. Ensure reliable Wifi is offered.
Recommendations for Hosts
- Ensure your listing includes all essential amenities for Aubervilliers: Kitchen.
- Prioritize adding missing essentials: Kitchen.
- Consider adding popular differentiators like Wifi or Heating to increase appeal.
- Highlight unique or less common amenities you offer (e.g., hot tub, dedicated workspace, EV charger) in your listing description and photos.
- Regularly check competitor amenities in Aubervilliers to stay competitive.
Aubervilliers Airbnb Guest Demographics & Profile Analysis (2026)
Guest Profile Summary for Aubervilliers
- The typical guest profile for Airbnb in Aubervilliers consists of a mix of domestic (47%) and international guests, with top international origins including Germany, typically belonging to the Post-2000s (Gen Z/Alpha) group (50%), primarily speaking English or French.
- Domestic travelers account for 46.6% of guests.
- Key international markets include France (46.6%) and Germany (8.1%).
- Top languages spoken are English (36.1%) followed by French (26%).
- A significant demographic segment is the Post-2000s (Gen Z/Alpha) group, representing 50% of guests.
Recommendations for Hosts
- Balance marketing efforts between domestic and international channels based on the guest mix.
- Tailor amenities and listing descriptions to appeal to the dominant Post-2000s (Gen Z/Alpha) demographic (e.g., highlight fast WiFi, smart home features, local guides).
- Highlight unique local experiences or amenities relevant to the primary guest profile.
- Consider seasonal promotions aligned with peak travel times for key origin markets.
Nearby Short-Term Rental Market Comparison
How does the Aubervilliers Airbnb market stack up against its neighbors? Compare key performance metrics like average monthly revenue, ADR, and occupancy rates in surrounding areas to understand the broader regional STR landscape.
| Market | Active Properties | Monthly Revenue | Daily Rate | Avg. Occupancy |
|---|---|---|---|---|
| Égreville | 12 | $4,969 | $447.83 | 40% |
| Dizy | 11 | $4,106 | $250.48 | 49% |
| La Couture-Boussey | 11 | $4,086 | $464.04 | 28% |
| Menetou-Râtel | 10 | $3,844 | $353.11 | 34% |
| Rosoy-en-Multien | 15 | $3,680 | $347.93 | 47% |
| Morienval | 12 | $3,308 | $372.82 | 30% |
| Achères-la-Forêt | 35 | $3,136 | $348.74 | 44% |
| Mesnils-sur-Iton | 24 | $3,099 | $348.65 | 41% |
| Paris | 39,295 | $3,085 | $257.47 | 52% |
| Maslives | 17 | $2,994 | $317.61 | 39% |