Asnières-sur-Seine Airbnb Market Analysis 2026: Short Term Rental Data & Vacation Rental Statistics in Ile-de-France, France
Is Airbnb profitable in Asnières-sur-Seine in 2026? Explore comprehensive Airbnb analytics for Asnières-sur-Seine, Ile-de-France, France to uncover income potential. This 2026 STR market report for Asnières-sur-Seine, based on AirROI data from February 2025 to January 2026, reveals key trends in the market of 445 active listings.
Whether you're considering an Airbnb investment in Asnières-sur-Seine, optimizing your existing vacation rental, or exploring rental arbitrage opportunities, understanding the Asnières-sur-Seine Airbnb data is crucial. Navigating the high regulation landscape is key to maximizing your short term rental income potential. Let's dive into the specifics.
Key Asnières-sur-Seine Airbnb Performance Metrics Overview
Monthly Airbnb Revenue Variations & Income Potential in Asnières-sur-Seine (2026)
Understanding the monthly revenue variations for Airbnb listings in Asnières-sur-Seine is key to maximizing your short term rental income potential. Seasonality significantly impacts earnings. Our analysis, based on data from the past 12 months, shows that the peak revenue month for STRs in Asnières-sur-Seine is typically June, while January often presents the lowest earnings, highlighting opportunities for strategic pricing adjustments during shoulder and low seasons. Explore the typical Airbnb income in Asnières-sur-Seine across different performance tiers:
- Best-in-class properties (Top 10%) achieve $3,506+ monthly, often utilizing dynamic pricing and superior guest experiences.
- Strong performing properties (Top 25%) earn $2,459 or more, indicating effective management and desirable locations/amenities.
- Typical properties (Median) generate around $1,548 per month, representing the average market performance.
- Entry-level properties (Bottom 25%) see earnings around $696, often with potential for optimization.
Average Monthly Airbnb Earnings Trend in Asnières-sur-Seine
Asnières-sur-Seine Airbnb Occupancy Rate Trends (2026)
Maximize your bookings by understanding the Asnières-sur-Seine STR occupancy trends. Seasonal demand shifts significantly influence how often properties are booked. Typically, Junesees the highest demand (peak season occupancy), while January experiences the lowest (low season). Effective strategies, like adjusting minimum stays or offering promotions, can boost occupancy during slower periods. Here's how different property tiers perform in Asnières-sur-Seine:
- Best-in-class properties (Top 10%) achieve 90%+ occupancy, indicating high desirability and potentially optimized availability.
- Strong performing properties (Top 25%) maintain 76% or higher occupancy, suggesting good market fit and guest satisfaction.
- Typical properties (Median) have an occupancy rate around 47%.
- Entry-level properties (Bottom 25%) average 19% occupancy, potentially facing higher vacancy.
Average Monthly Occupancy Rate Trend in Asnières-sur-Seine
Average Daily Rate (ADR) Airbnb Trends in Asnières-sur-Seine (2026)
Effective short term rental pricing strategy in Asnières-sur-Seine involves understanding monthly ADR fluctuations. The Average Daily Rate (ADR) for Airbnb in Asnières-sur-Seine typically peaks in June and dips lowest during February. Leveraging Airbnb dynamic pricing tools or strategies based on this seasonality can significantly boost revenue. Here's a look at the typical nightly rates achieved:
- Best-in-class properties (Top 10%) command rates of $246+ per night, often due to premium features or locations.
- Strong performing properties (Top 25%) achieve nightly rates of $159 or more.
- Typical properties (Median) charge around $109 per night.
- Entry-level properties (Bottom 25%) earn around $82 per night.
Average Daily Rate (ADR) Trend by Month in Asnières-sur-Seine
Get Live Asnières-sur-Seine Market Intelligence 👇

Explore Real-time Analytics
Airbnb Seasonality Analysis & Trends in Asnières-sur-Seine (2026)
Peak Season (June, October, July)
- Revenue averages $2,147 per month
- Occupancy rates average 51.7%
- Daily rates average $146
Shoulder Season
- Revenue averages $1,883 per month
- Occupancy maintains around 48.9%
- Daily rates hold near $141
Low Season (January, February, August)
- Revenue drops to average $1,467 per month
- Occupancy decreases to average 42.1%
- Daily rates adjust to average $140
Seasonality Insights for Asnières-sur-Seine
- The Airbnb seasonality in Asnières-sur-Seine shows moderate seasonality with distinct peak and low periods. While the sections above show seasonal averages, it's also insightful to look at the extremes:
- During the high season, the absolute peak month showcases Asnières-sur-Seine's highest earning potential, with monthly revenues capable of climbing to $2,232, occupancy reaching a high of 55.0%, and ADRs peaking at $149.
- Conversely, the slowest single month of the year, typically falling within the low season, marks the market's lowest point. In this month, revenue might dip to $1,346, occupancy could drop to 36.9%, and ADRs may adjust down to $138.
- Understanding both the seasonal averages and these monthly peaks and troughs in revenue, occupancy, and ADR is crucial for maximizing your Airbnb profit potential in Asnières-sur-Seine.
Seasonal Strategies for Maximizing Profit
- Peak Season: Maximize revenue through premium pricing and potentially longer minimum stays. Ensure high availability.
- Low Season: Offer competitive pricing, special promotions (e.g., extended stay discounts), and flexible cancellation policies. Target off-season travelers like remote workers or budget-conscious guests.
- Shoulder Seasons: Implement dynamic pricing that balances peak and low rates. Target weekend travelers or specific events. Offer slightly more flexible terms than peak season.
- Regularly analyze your own performance against these Asnières-sur-Seine seasonality benchmarks and adjust your pricing and availability strategy accordingly.
Best Areas for Airbnb Investment in Asnières-sur-Seine (2026)
Exploring the top neighborhoods for short-term rentals in Asnières-sur-Seine? This section highlights key areas, outlining why they are attractive for hosts and guests, along with notable local attractions. Consider these locations based on your target guest profile and investment strategy.
| Neighborhood / Area | Why Host Here? (Target Guests & Appeal) | Key Attractions & Landmarks |
|---|---|---|
| Centre-ville d'Asnières | The central area of Asnières-sur-Seine with a vibrant local atmosphere. Close to shops, restaurants and public transport, making it a prime spot for visitors looking for convenience. | Asnières Town Hall, Eglise d'Asnières, Boulevard Voltaire, Parc des Chanteraines, Les Quatre Temps shopping center |
| Bords de Seine | Scenic riverside area that offers beautiful views and walking areas along the Seine. Perfect for guests who enjoy nature and outdoor activities. | Seine River Walk, Parc de la Planchette, Embankment of the Seine, Parks and gardens, nearby Villa Savoye |
| Asnières Expo | Close to major exhibition centers and business districts, making it ideal for business travelers and attendees of events and conferences. | Palais des Congrès, Cité des Sciences et de l'Industrie, nearby business offices, Parc de la Villette, La Défense |
| La Gare | Proximity to the train station facilitates easy access to central Paris, attracting tourists and business travelers alike. This area remains lively with cafes and shops. | Gare d'Asnières, Local cafés, Rue des Voirons, Community markets, Train access to Paris |
| Marché d'Asnières | Known for its local markets and community vibe, this area is great for guests wanting to experience authentic local culture and gastronomy. | Asnières Market, Café culture, Local artisan shops, Street fairs, Nearby parks |
| Parc des Chanteraines | A spacious park area that attracts families and outdoor enthusiasts, making it perfect for guests who enjoy open spaces and recreational activities. | Parc des Chanteraines, Boating activities, Playgrounds, Picnic areas, Walking and cycling paths |
| Les Grésillons | An emerging neighborhood that is gaining popularity for its cultural diversity and community initiatives, attracting younger travelers looking for authentic experiences. | Cultural centers, Art studios, Local eateries, Weekend markets, Community events |
| Asnières Cultural Center | A hub for cultural activities and events, this area attracts artists and those interested in local arts and community gatherings, perfect for creative travelers. | Cultural Workshops, Art exhibitions, Local theater, Music events, Cafés and bookshops |
Understanding Airbnb License Requirements & STR Laws in Asnières-sur-Seine (2026)
Yes, Asnières-sur-Seine, Ile-de-France, France enforces high STR regulations. Obtaining a license and ensuring compliance is almost certainly required according to current 2026 STR laws. Always verify the latest short term rental regulations and Airbnb license requirements directly with local government authorities for Asnières-sur-Seine to ensure full compliance before hosting.
(Source: AirROI data, 2026, based on 71% licensed listings)
Top Performing Airbnb Properties in Asnières-sur-Seine (2026)
Benchmark your potential! Explore examples of top-performing Airbnb properties in Asnières-sur-Seinebased on Trailing Twelve Month (TTM) revenue. Analyze their characteristics, revenue, occupancy rate, and ADR to understand what drives success in this market.
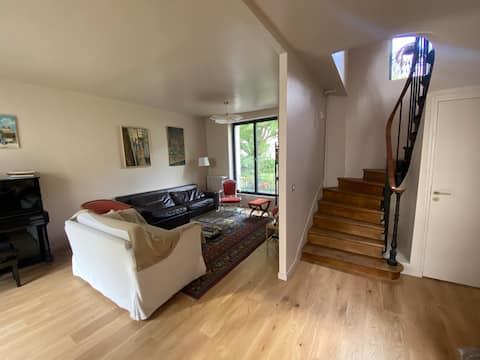
Charming house in the center of Asnières, 6 bedrooms
Entire Place • 6 bedrooms
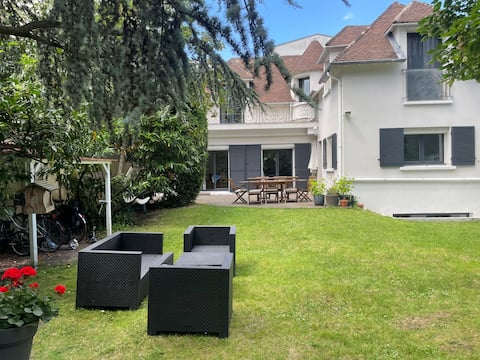
House with garden, 9 people, Asnières, 5 minutes from Paris
Entire Place • 6 bedrooms
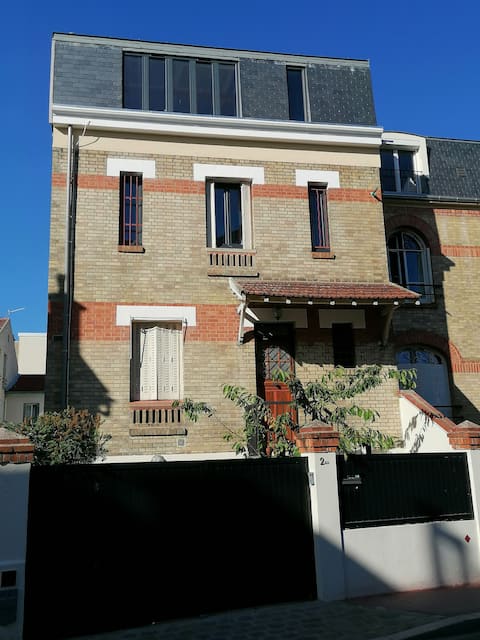
Big house, 4 bdrms up to 10 pers. to visit Paris
Entire Place • 4 bedrooms
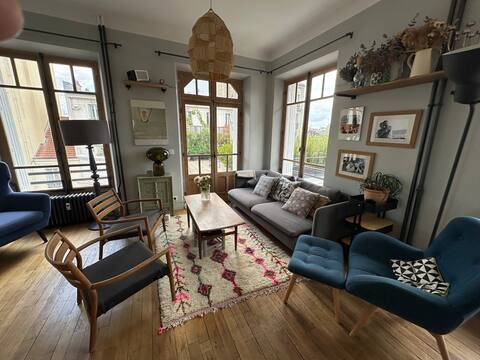
Apartment with terraces 15 minutes from Paris
Entire Place • 3 bedrooms
Modern house with AC -3BR-6P- Asnières-sur-Seine
Entire Place • 3 bedrooms
Luxe 10 minutes Paris - Feifei’s Home & Spa
Entire Place • 2 bedrooms
Note: Performance varies based on location, size, amenities, seasonality, and management quality. Data reflects the past 12 months.
Top Performing Airbnb Hosts in Asnières-sur-Seine (2026)
Learn from the best! This table showcases top-performing Airbnb hosts in Asnières-sur-Seine based on the number of properties managed and estimated total revenue over the past year. Analyze their scale and performance metrics.
| Host Name | Properties | Grossing Revenue | Stay Reviews | Avg Rating |
|---|---|---|---|---|
| Fabrice | 25 | $216,021 | 781 | 4.19/5.0 |
| Roland | 7 | $197,258 | 150 | 4.57/5.0 |
| Elodie | 4 | $96,038 | 56 | 4.87/5.0 |
| Guillaume | 1 | $91,851 | 14 | 5.00/5.0 |
| Reside | 3 | $90,113 | 748 | 4.45/5.0 |
| Bertille | 1 | $80,681 | 9 | 5.00/5.0 |
| Richard | 1 | $75,675 | 63 | 4.76/5.0 |
| Conciergerie La Main D'Or | 3 | $73,777 | 92 | 4.43/5.0 |
| Gregoire | 1 | $70,926 | 11 | 5.00/5.0 |
| Checkmyguest | 1 | $70,593 | 65 | 4.80/5.0 |
Analyzing the strategies of top hosts, such as their property selection, pricing, and guest communication, can offer valuable lessons for optimizing your own Airbnb operations in Asnières-sur-Seine.
Dive Deeper: Advanced Asnières-sur-Seine STR Market Data (2026)
Ready to unlock more insights? AirROI provides access to advanced metrics and comprehensive Airbnb data for Asnières-sur-Seine. Explore detailed analytics beyond this report to refine your investment strategy, optimize pricing, and maximize your vacation rental profits.
Explore Advanced MetricsAsnières-sur-Seine Short-Term Rental Market Composition (2026): Property & Room Types
Room Type Distribution
Property Type Distribution
Market Composition Insights for Asnières-sur-Seine
- The Asnières-sur-Seine Airbnb market composition is heavily skewed towards Entire Home/Apt listings, which make up 86.7% of the 445 active rentals. This indicates strong guest preference for privacy and space.
- Looking at the property type distribution in Asnières-sur-Seine, Apartment/Condo properties are the most common (84.3%), reflecting the local real estate landscape.
- Smaller segments like hotel/boutique, outdoor/unique, others (combined 4.7%) offer potential for unique stay experiences.
Asnières-sur-Seine Airbnb Room Capacity Analysis (2026): Bedroom Distribution
Distribution of Listings by Number of Bedrooms
Room Capacity Insights for Asnières-sur-Seine
- The dominant room capacity in Asnières-sur-Seine is 1 bedroom listings, making up 49.7% of the market. This suggests a strong demand for properties suitable for couples or solo travelers.
- Together, 1 bedroom and 2 bedrooms properties represent 67.7% of the active Airbnb listings in Asnières-sur-Seine, indicating a high concentration in these sizes.
Asnières-sur-Seine Vacation Rental Guest Capacity Trends (2026)
Distribution of Listings by Guest Capacity
Guest Capacity Insights for Asnières-sur-Seine
- The most common guest capacity trend in Asnières-sur-Seine vacation rentals is listings accommodating 2 guests (32.1%). This suggests the primary traveler segment is likely couples or solo travelers.
- Properties designed for 2 guests and 4 guests dominate the Asnières-sur-Seine STR market, accounting for 60.6% of listings.
- 14.2% of properties accommodate 6+ guests, serving the market segment for larger families or group travel in Asnières-sur-Seine.
- On average, properties in Asnières-sur-Seine are equipped to host 3.2 guests.
Asnières-sur-Seine Airbnb Booking Patterns (2026): Available vs. Booked Days
Available Days Distribution
Booked Days Distribution
Booking Pattern Insights for Asnières-sur-Seine
- The most common availability pattern in Asnières-sur-Seine falls within the 271-366 days range, representing 55.5% of listings. This suggests many properties have significant open periods on their calendars.
- Approximately 75.9% of listings show high availability (181+ days open annually), indicating potential for increased bookings or specific owner usage patterns.
- For booked days, the 31-90 days range is most frequent in Asnières-sur-Seine (30.1%), reflecting common guest stay durations or potential owner blocking patterns.
- A notable 24.3% of properties secure long booking periods (181+ days booked per year), highlighting successful long-term rental strategies or significant owner usage.
Asnières-sur-Seine Airbnb Minimum Stay Requirements Analysis
Distribution of Listings by Minimum Night Requirement
1 Night
72 listings
16.2% of total
2 Nights
103 listings
23.1% of total
3 Nights
37 listings
8.3% of total
4-6 Nights
28 listings
6.3% of total
7-29 Nights
20 listings
4.5% of total
30+ Nights
185 listings
41.6% of total
Key Insights
- The most prevalent minimum stay requirement in Asnières-sur-Seine is 30+ Nights, adopted by 41.6% of listings. This highlights the market's preference for longer commitments.
- A significant segment (41.6%) caters to monthly stays (30+ nights) in Asnières-sur-Seine, pointing to opportunities in the extended-stay market.
Recommendations
- Align with the market by considering a 30+ Nights minimum stay, as 41.6% of Asnières-sur-Seine hosts use this setting.
- If feasible, allowing 1-night stays, especially midweek or during low season, could capture last-minute bookings, as only 16.2% currently do.
- Explore offering discounts for stays of 30+ nights to attract the 41.6% of the market seeking extended stays.
- Adjust minimum nights based on seasonality – potentially shorter during low season and longer during peak demand periods in Asnières-sur-Seine.
Asnières-sur-Seine Airbnb Cancellation Policy Trends Analysis (2026)
Super Strict 60 Days
2 listings
0.5% of total
Limited
4 listings
0.9% of total
Flexible
130 listings
29.5% of total
Moderate
136 listings
30.8% of total
Firm
113 listings
25.6% of total
Strict
56 listings
12.7% of total
Cancellation Policy Insights for Asnières-sur-Seine
- The prevailing Airbnb cancellation policy trend in Asnières-sur-Seine is Moderate, used by 30.8% of listings.
- There's a relatively balanced mix between guest-friendly (60.3%) and stricter (38.3%) policies, offering choices for different guest needs.
Recommendations for Hosts
- Consider adopting a Moderate policy to align with the 30.8% market standard in Asnières-sur-Seine.
- Using a Strict policy might deter some guests, as only 12.7% of listings use it. Evaluate if potential revenue protection outweighs possible lower booking rates.
- Regularly review your cancellation policy against competitors and market demand shifts in Asnières-sur-Seine.
Asnières-sur-Seine STR Booking Lead Time Analysis (2026)
Average Booking Lead Time by Month
Booking Lead Time Insights for Asnières-sur-Seine
- The overall average booking lead time for vacation rentals in Asnières-sur-Seine is 38 days.
- Guests book furthest in advance for stays during August (average 48 days), likely coinciding with peak travel demand or local events.
- The shortest booking windows occur for stays in February (average 27 days), indicating more last-minute travel plans during this time.
- Seasonally, Summer (45 days avg.) sees the longest lead times, while Winter (35 days avg.) has the shortest, reflecting typical travel planning cycles.
Recommendations for Hosts
- Use the overall average lead time (38 days) as a baseline for your pricing and availability strategy in Asnières-sur-Seine.
- Target marketing efforts for the Summer season well in advance (at least 45 days) to capture early planners.
- Monitor your own booking lead times against these Asnières-sur-Seine averages to identify opportunities for dynamic pricing adjustments.
Popular & Essential Airbnb Amenities in Asnières-sur-Seine (2026)
Amenity Prevalence
Amenity Insights for Asnières-sur-Seine
- Essential amenities in Asnières-sur-Seine that guests expect include: Wifi, Kitchen. Lacking these (any) could significantly impact bookings.
- Popular amenities like Heating, Hot water, TV are common but not universal. Offering these can provide a competitive edge.
Recommendations for Hosts
- Ensure your listing includes all essential amenities for Asnières-sur-Seine: Wifi, Kitchen.
- Prioritize adding missing essentials: Wifi, Kitchen.
- Consider adding popular differentiators like Heating or Hot water to increase appeal.
- Highlight unique or less common amenities you offer (e.g., hot tub, dedicated workspace, EV charger) in your listing description and photos.
- Regularly check competitor amenities in Asnières-sur-Seine to stay competitive.
Asnières-sur-Seine Airbnb Guest Demographics & Profile Analysis (2026)
Guest Profile Summary for Asnières-sur-Seine
- The typical guest profile for Airbnb in Asnières-sur-Seine consists of a mix of domestic (41%) and international guests, with top international origins including United States, typically belonging to the Post-2000s (Gen Z/Alpha) group (50%), primarily speaking English or French.
- Domestic travelers account for 41.1% of guests.
- Key international markets include France (41.1%) and United States (9.9%).
- Top languages spoken are English (38.4%) followed by French (24.7%).
- A significant demographic segment is the Post-2000s (Gen Z/Alpha) group, representing 50% of guests.
Recommendations for Hosts
- Balance marketing efforts between domestic and international channels based on the guest mix.
- Tailor amenities and listing descriptions to appeal to the dominant Post-2000s (Gen Z/Alpha) demographic (e.g., highlight fast WiFi, smart home features, local guides).
- Highlight unique local experiences or amenities relevant to the primary guest profile.
- Consider seasonal promotions aligned with peak travel times for key origin markets.
Nearby Short-Term Rental Market Comparison
How does the Asnières-sur-Seine Airbnb market stack up against its neighbors? Compare key performance metrics like average monthly revenue, ADR, and occupancy rates in surrounding areas to understand the broader regional STR landscape.
| Market | Active Properties | Monthly Revenue | Daily Rate | Avg. Occupancy |
|---|---|---|---|---|
| Égreville | 12 | $4,969 | $447.83 | 40% |
| Dizy | 11 | $4,106 | $250.48 | 49% |
| La Couture-Boussey | 11 | $4,086 | $464.04 | 28% |
| Menetou-Râtel | 10 | $3,844 | $353.11 | 34% |
| Rosoy-en-Multien | 15 | $3,680 | $347.93 | 47% |
| Morienval | 12 | $3,308 | $372.82 | 30% |
| Achères-la-Forêt | 35 | $3,136 | $348.74 | 44% |
| Mesnils-sur-Iton | 24 | $3,099 | $348.65 | 41% |
| Paris | 39,295 | $3,085 | $257.47 | 52% |
| Maslives | 17 | $2,994 | $317.61 | 39% |