Tardinghen Airbnb Market Analysis 2026: Short Term Rental Data & Vacation Rental Statistics in Hauts-de-France, France
Is Airbnb profitable in Tardinghen in 2026? Explore comprehensive Airbnb analytics for Tardinghen, Hauts-de-France, France to uncover income potential. This 2026 STR market report for Tardinghen, based on AirROI data from February 2025 to January 2026, reveals key trends in the niche market of 21 active listings.
Whether you're considering an Airbnb investment in Tardinghen, optimizing your existing vacation rental, or exploring rental arbitrage opportunities, understanding the Tardinghen Airbnb data is crucial. Leveraging the low regulation environment is key to maximizing your short term rental income potential. Let's dive into the specifics.
Key Tardinghen Airbnb Performance Metrics Overview
Monthly Airbnb Revenue Variations & Income Potential in Tardinghen (2026)
Understanding the monthly revenue variations for Airbnb listings in Tardinghen is key to maximizing your short term rental income potential. Seasonality significantly impacts earnings. Our analysis, based on data from the past 12 months, shows that the peak revenue month for STRs in Tardinghen is typically August, while January often presents the lowest earnings, highlighting opportunities for strategic pricing adjustments during shoulder and low seasons. Explore the typical Airbnb income in Tardinghen across different performance tiers:
- Best-in-class properties (Top 10%) achieve $7,436+ monthly, often utilizing dynamic pricing and superior guest experiences.
- Strong performing properties (Top 25%) earn $4,233 or more, indicating effective management and desirable locations/amenities.
- Typical properties (Median) generate around $2,585 per month, representing the average market performance.
- Entry-level properties (Bottom 25%) see earnings around $1,504, often with potential for optimization.
Average Monthly Airbnb Earnings Trend in Tardinghen
Tardinghen Airbnb Occupancy Rate Trends (2026)
Maximize your bookings by understanding the Tardinghen STR occupancy trends. Seasonal demand shifts significantly influence how often properties are booked. Typically, Augustsees the highest demand (peak season occupancy), while January experiences the lowest (low season). Effective strategies, like adjusting minimum stays or offering promotions, can boost occupancy during slower periods. Here's how different property tiers perform in Tardinghen:
- Best-in-class properties (Top 10%) achieve 65%+ occupancy, indicating high desirability and potentially optimized availability.
- Strong performing properties (Top 25%) maintain 55% or higher occupancy, suggesting good market fit and guest satisfaction.
- Typical properties (Median) have an occupancy rate around 40%.
- Entry-level properties (Bottom 25%) average 27% occupancy, potentially facing higher vacancy.
Average Monthly Occupancy Rate Trend in Tardinghen
Average Daily Rate (ADR) Airbnb Trends in Tardinghen (2026)
Effective short term rental pricing strategy in Tardinghen involves understanding monthly ADR fluctuations. The Average Daily Rate (ADR) for Airbnb in Tardinghen typically peaks in October and dips lowest during February. Leveraging Airbnb dynamic pricing tools or strategies based on this seasonality can significantly boost revenue. Here's a look at the typical nightly rates achieved:
- Best-in-class properties (Top 10%) command rates of $416+ per night, often due to premium features or locations.
- Strong performing properties (Top 25%) achieve nightly rates of $272 or more.
- Typical properties (Median) charge around $198 per night.
- Entry-level properties (Bottom 25%) earn around $157 per night.
Average Daily Rate (ADR) Trend by Month in Tardinghen
Get Live Tardinghen Market Intelligence 👇
Explore Real-time Analytics
Airbnb Seasonality Analysis & Trends in Tardinghen (2026)
Peak Season (August, July, October)
- Revenue averages $5,796 per month
- Occupancy rates average 58.9%
- Daily rates average $270
Shoulder Season
- Revenue averages $3,427 per month
- Occupancy maintains around 40.8%
- Daily rates hold near $259
Low Season (January, February, December)
- Revenue drops to average $1,651 per month
- Occupancy decreases to average 22.5%
- Daily rates adjust to average $250
Seasonality Insights for Tardinghen
- The Airbnb seasonality in Tardinghen shows highly seasonal trends requiring careful strategy. While the sections above show seasonal averages, it's also insightful to look at the extremes:
- During the high season, the absolute peak month showcases Tardinghen's highest earning potential, with monthly revenues capable of climbing to $6,880, occupancy reaching a high of 74.4%, and ADRs peaking at $279.
- Conversely, the slowest single month of the year, typically falling within the low season, marks the market's lowest point. In this month, revenue might dip to $1,161, occupancy could drop to 14.5%, and ADRs may adjust down to $239.
- Understanding both the seasonal averages and these monthly peaks and troughs in revenue, occupancy, and ADR is crucial for maximizing your Airbnb profit potential in Tardinghen.
Seasonal Strategies for Maximizing Profit
- Peak Season: Maximize revenue through premium pricing and potentially longer minimum stays. Ensure high availability.
- Low Season: Offer competitive pricing, special promotions (e.g., extended stay discounts), and flexible cancellation policies. Target off-season travelers like remote workers or budget-conscious guests.
- Shoulder Seasons: Implement dynamic pricing that balances peak and low rates. Target weekend travelers or specific events. Offer slightly more flexible terms than peak season.
- Regularly analyze your own performance against these Tardinghen seasonality benchmarks and adjust your pricing and availability strategy accordingly.
Best Areas for Airbnb Investment in Tardinghen (2026)
Exploring the top neighborhoods for short-term rentals in Tardinghen? This section highlights key areas, outlining why they are attractive for hosts and guests, along with notable local attractions. Consider these locations based on your target guest profile and investment strategy.
| Neighborhood / Area | Why Host Here? (Target Guests & Appeal) | Key Attractions & Landmarks |
|---|---|---|
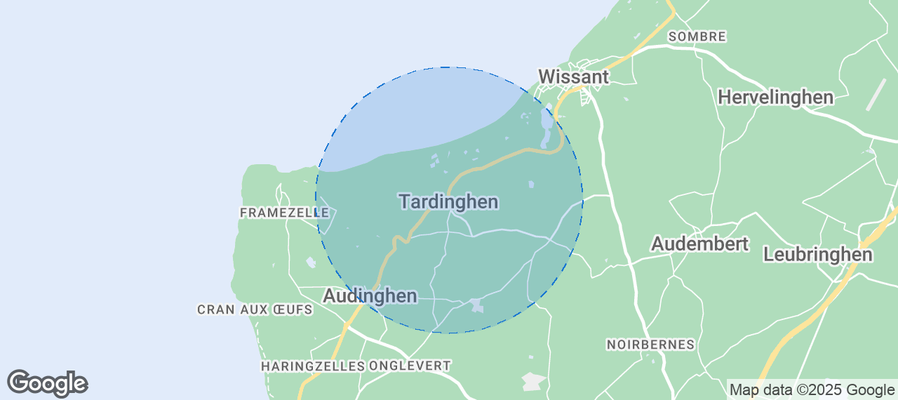
| Tardinghen Village | A charming coastal village with easy access to sandy beaches and scenic countryside. Ideal for families and nature lovers seeking a quiet getaway. | Cap Blanc-Nez, Cap Gris-Nez, Batterie Todt, Plage de Tardinghen, Les Deux Caps |
| Wimereux | A picturesque seaside resort town known for its Belle Époque architecture and beautiful beaches. Attracts both tourists and local visitors for its delightful seaside ambiance. | Wimereux Beach, Promenade des Dunes, Wimereux Golf Club, Rue Carnot, Fort de la Crèche |
| Hardelot-Plage | A popular beach destination featuring sandy shores, golf courses, and family-friendly activities. Great for summer vacations and weekend getaways. | Hardelot Beach, Les Dunes Golf Club, Nausicaá, Château d'Hardelot, Equestrian Center |
| Équihen-Plage | A tranquil beach town known for its wide stretches of sand and stunning coastal views. Perfect for Airbnb investments aimed at beach lovers. | Équihen Beach, Sentier des Douaniers, La Pointe de la Crèche, Les Falaises |
| Nausicaá | Home to the famous Nausicaá aquarium, this area attracts families and marine life enthusiasts, providing opportunities for hosting visitors year-round. | Nausicaá National Sea Centre, Boulogne-sur-Mer Beach, Port of Boulogne, Victoria Gardens, Boulogne's Old Town |
| Boulogne-sur-Mer | A historic town with a vibrant harbor and rich maritime heritage, offering various cultural attractions and close proximity to the coast. | Boulogne Castle, Nausicaá, The Old Town, St. Nicholas Church, Boulogne-sur-Mer Aquarium |
| Camiers | A small town near the coast, ideal for those seeking a peaceful retreat while still being close to the beach and other attractions. | Camiers-Plage, Hiking trails, Nature Reserve, Local market, Fishing spots |
| Marquise | A quaint commune surrounded by countryside and close to beautiful coastal areas. Ideal for visitors looking for a tranquil base while exploring the region. | Marquise town center, Countryside walks, Close proximity to beaches, Historical landmarks, Local cuisine |
Understanding Airbnb License Requirements & STR Laws in Tardinghen (2026)
While Tardinghen, Hauts-de-France, France currently shows low STR regulations, specific Airbnb license requirements might still exist or change. Always verify the latest short term rental regulations and Airbnb license requirements directly with local government authorities for Tardinghen to ensure full compliance before hosting.
(Source: AirROI data, 2026, based on 5% licensed listings)
Top Performing Airbnb Properties in Tardinghen (2026)
Benchmark your potential! Explore examples of top-performing Airbnb properties in Tardinghenbased on Trailing Twelve Month (TTM) revenue. Analyze their characteristics, revenue, occupancy rate, and ADR to understand what drives success in this market.
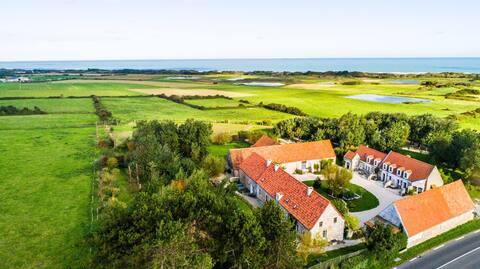
Domaine de la Source-SEA VIEW-16 to 18 people
Entire Place • 7 bedrooms

The Bay of 2 Capes
Entire Place • 5 bedrooms
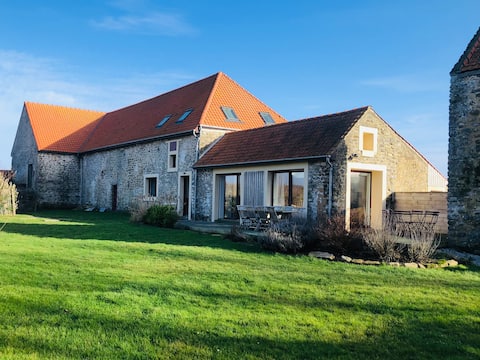
The Châtelet farmhouse 5 bedrooms 3 bathrooms
Entire Place • 5 bedrooms

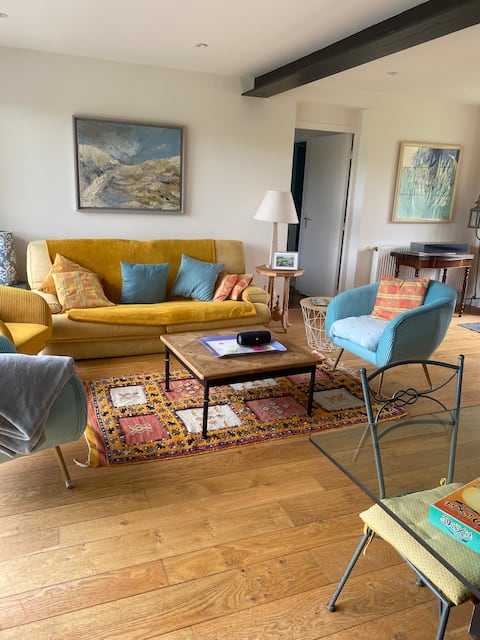
The Sloping Roof
Entire Place • 2 bedrooms

The Luminous
Entire Place • 3 bedrooms
2 Capes - charming cottage close to the beach
Entire Place • 3 bedrooms
Note: Performance varies based on location, size, amenities, seasonality, and management quality. Data reflects the past 12 months.
Top Performing Airbnb Hosts in Tardinghen (2026)
Learn from the best! This table showcases top-performing Airbnb hosts in Tardinghen based on the number of properties managed and estimated total revenue over the past year. Analyze their scale and performance metrics.
| Host Name | Properties | Grossing Revenue | Stay Reviews | Avg Rating |
|---|---|---|---|---|
| Stephen | 4 | $210,698 | 89 | 4.74/5.0 |
| Anne | 1 | $134,214 | 20 | 5.00/5.0 |
| Christine | 1 | $68,981 | 9 | 4.78/5.0 |
| Yannick | 3 | $54,147 | 19 | 4.51/5.0 |
| Patrick | 1 | $39,396 | 61 | 4.90/5.0 |
| Caroline | 1 | $35,427 | 129 | 4.95/5.0 |
| Virginie | 1 | $30,628 | 37 | 4.92/5.0 |
| Francette | 1 | $26,406 | 19 | 4.74/5.0 |
| Patricia | 1 | $22,129 | 28 | 4.50/5.0 |
| La Conciergerie D'Opale | 1 | $21,713 | 11 | 4.64/5.0 |
Analyzing the strategies of top hosts, such as their property selection, pricing, and guest communication, can offer valuable lessons for optimizing your own Airbnb operations in Tardinghen.
Dive Deeper: Advanced Tardinghen STR Market Data (2026)
Ready to unlock more insights? AirROI provides access to advanced metrics and comprehensive Airbnb data for Tardinghen. Explore detailed analytics beyond this report to refine your investment strategy, optimize pricing, and maximize your vacation rental profits.
Explore Advanced MetricsTardinghen Short-Term Rental Market Composition (2026): Property & Room Types
Room Type Distribution
Property Type Distribution
Market Composition Insights for Tardinghen
- The Tardinghen Airbnb market composition is heavily skewed towards Entire Home/Apt listings, which make up 95.2% of the 21 active rentals. This indicates strong guest preference for privacy and space.
- Looking at the property type distribution in Tardinghen, House properties are the most common (81%), reflecting the local real estate landscape.
- Houses represent a significant 81% portion, catering likely to families or larger groups.
- Smaller segments like outdoor/unique, hotel/boutique, others, apartment/condo (combined 19.2%) offer potential for unique stay experiences.
Tardinghen Airbnb Room Capacity Analysis (2026): Bedroom Distribution
Distribution of Listings by Number of Bedrooms
Room Capacity Insights for Tardinghen
- The dominant room capacity in Tardinghen is 1 bedroom listings, making up 23.8% of the market. This suggests a strong demand for properties suitable for couples or solo travelers.
- Together, 1 bedroom and 3 bedrooms properties represent 47.6% of the active Airbnb listings in Tardinghen, indicating a high concentration in these sizes.
- A significant 61.8% of listings offer 3+ bedrooms, catering to larger groups and families seeking more space in Tardinghen.
Tardinghen Vacation Rental Guest Capacity Trends (2026)
Distribution of Listings by Guest Capacity
Guest Capacity Insights for Tardinghen
- The most common guest capacity trend in Tardinghen vacation rentals is listings accommodating 8+ guests (52.4%). This suggests the primary traveler segment is likely larger groups.
- Properties designed for 8+ guests and 2 guests dominate the Tardinghen STR market, accounting for 71.4% of listings.
- 61.9% of properties accommodate 6+ guests, serving the market segment for larger families or group travel in Tardinghen.
- On average, properties in Tardinghen are equipped to host 5.9 guests.
Tardinghen Airbnb Booking Patterns (2026): Available vs. Booked Days
Available Days Distribution
Booked Days Distribution
Booking Pattern Insights for Tardinghen
- The most common availability pattern in Tardinghen falls within the 181-270 days range, representing 61.9% of listings. This suggests many properties have significant open periods on their calendars.
- Approximately 85.7% of listings show high availability (181+ days open annually), indicating potential for increased bookings or specific owner usage patterns.
- For booked days, the 91-180 days range is most frequent in Tardinghen (61.9%), reflecting common guest stay durations or potential owner blocking patterns.
- A notable 14.3% of properties secure long booking periods (181+ days booked per year), highlighting successful long-term rental strategies or significant owner usage.
Tardinghen Airbnb Minimum Stay Requirements Analysis
Distribution of Listings by Minimum Night Requirement
1 Night
1 listings
4.8% of total
2 Nights
3 listings
14.3% of total
3 Nights
2 listings
9.5% of total
7-29 Nights
1 listings
4.8% of total
30+ Nights
14 listings
66.7% of total
Key Insights
- The most prevalent minimum stay requirement in Tardinghen is 30+ Nights, adopted by 66.7% of listings. This highlights the market's preference for longer commitments.
- Very short stays (1-2 nights) are less common (19.1%), suggesting hosts prefer slightly longer bookings to optimize turnover.
- A significant segment (66.7%) caters to monthly stays (30+ nights) in Tardinghen, pointing to opportunities in the extended-stay market.
Recommendations
- Align with the market by considering a 30+ Nights minimum stay, as 66.7% of Tardinghen hosts use this setting.
- If feasible, allowing 1-night stays, especially midweek or during low season, could capture last-minute bookings, as only 4.8% currently do.
- Explore offering discounts for stays of 30+ nights to attract the 66.7% of the market seeking extended stays.
- Adjust minimum nights based on seasonality – potentially shorter during low season and longer during peak demand periods in Tardinghen.
Tardinghen Airbnb Cancellation Policy Trends Analysis (2026)
Refundable
1 listings
4.8% of total
Flexible
3 listings
14.3% of total
Moderate
5 listings
23.8% of total
Firm
9 listings
42.9% of total
Strict
3 listings
14.3% of total
Cancellation Policy Insights for Tardinghen
- The prevailing Airbnb cancellation policy trend in Tardinghen is Firm, used by 42.9% of listings.
- A majority (57.2%) of hosts in Tardinghen utilize Firm or Strict policies, indicating a market where hosts prioritize booking security.
Recommendations for Hosts
- Consider adopting a Firm policy to align with the 42.9% market standard in Tardinghen.
- Using a Strict policy might deter some guests, as only 14.3% of listings use it. Evaluate if potential revenue protection outweighs possible lower booking rates.
- Regularly review your cancellation policy against competitors and market demand shifts in Tardinghen.
Tardinghen STR Booking Lead Time Analysis (2026)
Average Booking Lead Time by Month
Booking Lead Time Insights for Tardinghen
- The overall average booking lead time for vacation rentals in Tardinghen is 66 days.
- Guests book furthest in advance for stays during July (average 112 days), likely coinciding with peak travel demand or local events.
- The shortest booking windows occur for stays in February (average 29 days), indicating more last-minute travel plans during this time.
- Seasonally, Summer (95 days avg.) sees the longest lead times, while Spring (49 days avg.) has the shortest, reflecting typical travel planning cycles.
Recommendations for Hosts
- Use the overall average lead time (66 days) as a baseline for your pricing and availability strategy in Tardinghen.
- For July stays, consider implementing length-of-stay discounts or slightly higher rates for bookings made less than 112 days out to capitalize on advance planning.
- Target marketing efforts for the Summer season well in advance (at least 95 days) to capture early planners.
- Monitor your own booking lead times against these Tardinghen averages to identify opportunities for dynamic pricing adjustments.
Popular & Essential Airbnb Amenities in Tardinghen (2026)
Amenity Prevalence
Amenity Insights for Tardinghen
- Essential amenities in Tardinghen that guests expect include: Free parking on premises, Coffee maker, Dishes and silverware, Kitchen, Heating. Lacking these (any) could significantly impact bookings.
- Popular amenities like Hot water, Refrigerator, Cooking basics are common but not universal. Offering these can provide a competitive edge.
Recommendations for Hosts
- Ensure your listing includes all essential amenities for Tardinghen: Free parking on premises, Coffee maker, Dishes and silverware, Kitchen, Heating.
- Prioritize adding missing essentials: Dishes and silverware, Kitchen, Heating.
- Consider adding popular differentiators like Hot water or Refrigerator to increase appeal.
- Highlight unique or less common amenities you offer (e.g., hot tub, dedicated workspace, EV charger) in your listing description and photos.
- Regularly check competitor amenities in Tardinghen to stay competitive.
Tardinghen Airbnb Guest Demographics & Profile Analysis (2026)
Guest Profile Summary for Tardinghen
- The typical guest profile for Airbnb in Tardinghen consists of predominantly international visitors (71%), with top international origins including France, typically belonging to the Post-2000s (Gen Z/Alpha) group (50%), primarily speaking English or French.
- Domestic travelers account for 28.7% of guests.
- Key international markets include Belgium (38%) and France (28.7%).
- Top languages spoken are English (33.7%) followed by French (26%).
- A significant demographic segment is the Post-2000s (Gen Z/Alpha) group, representing 50% of guests.
Recommendations for Hosts
- Focus marketing internationally, particularly towards travelers from France.
- Tailor amenities and listing descriptions to appeal to the dominant Post-2000s (Gen Z/Alpha) demographic (e.g., highlight fast WiFi, smart home features, local guides).
- Highlight unique local experiences or amenities relevant to the primary guest profile.
- Consider seasonal promotions aligned with peak travel times for key origin markets.
Nearby Short-Term Rental Market Comparison
How does the Tardinghen Airbnb market stack up against its neighbors? Compare key performance metrics like average monthly revenue, ADR, and occupancy rates in surrounding areas to understand the broader regional STR landscape.
| Market | Active Properties | Monthly Revenue | Daily Rate | Avg. Occupancy |
|---|---|---|---|---|
| Lo-Reninge | 13 | $5,989 | $454.03 | 42% |
| La Poterie-Cap-d'Antifer | 15 | $3,878 | $273.66 | 48% |
| Rosoy-en-Multien | 15 | $3,680 | $347.93 | 47% |
| Saint-Étienne-la-Thillaye | 23 | $3,486 | $390.94 | 35% |
| Heuvelland | 56 | $3,348 | $367.19 | 36% |
| Morienval | 12 | $3,308 | $372.82 | 30% |
| Saint-Pierre-du-Val | 15 | $3,257 | $343.84 | 38% |
| Epping Forest | 106 | $3,041 | $275.10 | 46% |
| Diksmuide | 49 | $2,992 | $319.73 | 37% |
| Raray | 11 | $2,970 | $372.54 | 35% |