Saint-Valery-sur-Somme Airbnb Market Analysis 2026: Short Term Rental Data & Vacation Rental Statistics in Hauts-de-France, France
Is Airbnb profitable in Saint-Valery-sur-Somme in 2026? Explore comprehensive Airbnb analytics for Saint-Valery-sur-Somme, Hauts-de-France, France to uncover income potential. This 2026 STR market report for Saint-Valery-sur-Somme, based on AirROI data from February 2025 to January 2026, reveals key trends in the market of 326 active listings.
Whether you're considering an Airbnb investment in Saint-Valery-sur-Somme, optimizing your existing vacation rental, or exploring rental arbitrage opportunities, understanding the Saint-Valery-sur-Somme Airbnb data is crucial. Understanding the local regulations is key to maximizing your short term rental income potential. Let's dive into the specifics.
Key Saint-Valery-sur-Somme Airbnb Performance Metrics Overview
Monthly Airbnb Revenue Variations & Income Potential in Saint-Valery-sur-Somme (2026)
Understanding the monthly revenue variations for Airbnb listings in Saint-Valery-sur-Somme is key to maximizing your short term rental income potential. Seasonality significantly impacts earnings. Our analysis, based on data from the past 12 months, shows that the peak revenue month for STRs in Saint-Valery-sur-Somme is typically August, while January often presents the lowest earnings, highlighting opportunities for strategic pricing adjustments during shoulder and low seasons. Explore the typical Airbnb income in Saint-Valery-sur-Somme across different performance tiers:
- Best-in-class properties (Top 10%) achieve $3,350+ monthly, often utilizing dynamic pricing and superior guest experiences.
- Strong performing properties (Top 25%) earn $2,381 or more, indicating effective management and desirable locations/amenities.
- Typical properties (Median) generate around $1,632 per month, representing the average market performance.
- Entry-level properties (Bottom 25%) see earnings around $998, often with potential for optimization.
Average Monthly Airbnb Earnings Trend in Saint-Valery-sur-Somme
Saint-Valery-sur-Somme Airbnb Occupancy Rate Trends (2026)
Maximize your bookings by understanding the Saint-Valery-sur-Somme STR occupancy trends. Seasonal demand shifts significantly influence how often properties are booked. Typically, Augustsees the highest demand (peak season occupancy), while January experiences the lowest (low season). Effective strategies, like adjusting minimum stays or offering promotions, can boost occupancy during slower periods. Here's how different property tiers perform in Saint-Valery-sur-Somme:
- Best-in-class properties (Top 10%) achieve 73%+ occupancy, indicating high desirability and potentially optimized availability.
- Strong performing properties (Top 25%) maintain 56% or higher occupancy, suggesting good market fit and guest satisfaction.
- Typical properties (Median) have an occupancy rate around 41%.
- Entry-level properties (Bottom 25%) average 25% occupancy, potentially facing higher vacancy.
Average Monthly Occupancy Rate Trend in Saint-Valery-sur-Somme
Average Daily Rate (ADR) Airbnb Trends in Saint-Valery-sur-Somme (2026)
Effective short term rental pricing strategy in Saint-Valery-sur-Somme involves understanding monthly ADR fluctuations. The Average Daily Rate (ADR) for Airbnb in Saint-Valery-sur-Somme typically peaks in August and dips lowest during March. Leveraging Airbnb dynamic pricing tools or strategies based on this seasonality can significantly boost revenue. Here's a look at the typical nightly rates achieved:
- Best-in-class properties (Top 10%) command rates of $222+ per night, often due to premium features or locations.
- Strong performing properties (Top 25%) achieve nightly rates of $162 or more.
- Typical properties (Median) charge around $125 per night.
- Entry-level properties (Bottom 25%) earn around $104 per night.
Average Daily Rate (ADR) Trend by Month in Saint-Valery-sur-Somme
Get Live Saint-Valery-sur-Somme Market Intelligence 👇

Explore Real-time Analytics
Airbnb Seasonality Analysis & Trends in Saint-Valery-sur-Somme (2026)
Peak Season (August, July, May)
- Revenue averages $2,961 per month
- Occupancy rates average 62.4%
- Daily rates average $152
Shoulder Season
- Revenue averages $1,749 per month
- Occupancy maintains around 40.0%
- Daily rates hold near $149
Low Season (January, February, March)
- Revenue drops to average $1,058 per month
- Occupancy decreases to average 25.9%
- Daily rates adjust to average $138
Seasonality Insights for Saint-Valery-sur-Somme
- The Airbnb seasonality in Saint-Valery-sur-Somme shows highly seasonal trends requiring careful strategy. While the sections above show seasonal averages, it's also insightful to look at the extremes:
- During the high season, the absolute peak month showcases Saint-Valery-sur-Somme's highest earning potential, with monthly revenues capable of climbing to $3,636, occupancy reaching a high of 74.7%, and ADRs peaking at $155.
- Conversely, the slowest single month of the year, typically falling within the low season, marks the market's lowest point. In this month, revenue might dip to $906, occupancy could drop to 19.2%, and ADRs may adjust down to $133.
- Understanding both the seasonal averages and these monthly peaks and troughs in revenue, occupancy, and ADR is crucial for maximizing your Airbnb profit potential in Saint-Valery-sur-Somme.
Seasonal Strategies for Maximizing Profit
- Peak Season: Maximize revenue through premium pricing and potentially longer minimum stays. Ensure high availability.
- Low Season: Offer competitive pricing, special promotions (e.g., extended stay discounts), and flexible cancellation policies. Target off-season travelers like remote workers or budget-conscious guests.
- Shoulder Seasons: Implement dynamic pricing that balances peak and low rates. Target weekend travelers or specific events. Offer slightly more flexible terms than peak season.
- Regularly analyze your own performance against these Saint-Valery-sur-Somme seasonality benchmarks and adjust your pricing and availability strategy accordingly.
Best Areas for Airbnb Investment in Saint-Valery-sur-Somme (2026)
Exploring the top neighborhoods for short-term rentals in Saint-Valery-sur-Somme? This section highlights key areas, outlining why they are attractive for hosts and guests, along with notable local attractions. Consider these locations based on your target guest profile and investment strategy.
| Neighborhood / Area | Why Host Here? (Target Guests & Appeal) | Key Attractions & Landmarks |
|---|---|---|
| Le Port | Scenic waterfront area bustling with cafes and shops. Ideal for tourists wanting a picturesque stroll along the harbor and easy access to boat tours. | Port de Saint-Valery, Les Jardins de Quentovic, Promenade des Pêcheurs, Église Notre-Dame de la Fin des Terres, Bateau de Saint-Valery |
| Quartier des Remparts | Historic district with medieval architecture and cobblestone streets. Appeals to visitors interested in history and local culture. | Les Remparts de Saint-Valery, Musée Picarvie, Place des Pilotes, Café des Bains, Église Saint-Martin |
| La Plage | Beautiful beach area perfect for families and sunbathers. Close to various beachside activities and amenities. | Plage de Saint-Valery, Club Nautique, Café de la Plage, Promenade de la Plage, Parc des Rives de la Somme |
| Le Parc | Green park area near the water, ideal for picnics and relaxation. Attracts nature lovers and families. | Parc du Marquenterre, La Baie de Somme, Sentier de randonnée, Observatoire de la réserve, Bicycle paths |
| Village de L'Authie | Charming village atmosphere with local shops and traditional French architecture. Great for tourists looking for an authentic experience. | Église Saint-Nicolas, Marché local, Cafés traditionnels, Sentiers de randonnée, Produits du terroir |
| Sentier de la Baie | Picturesque walking paths through the bay area. Attracts nature enthusiasts and those looking to explore the local wildlife. | Chemin de randonnée, Observatoire ornithologique, Vues panoramiques, Points d'intérêt historiques, Ports de pêche |
| Centre-ville | Centrally located with easy access to shops, restaurants, and cultural sites. Perfect for urban explorers and visitors wanting to be in the thick of things. | Restaurants locaux, Boutiques artisanales, Marché de Saint-Valery, Lieux historiques, Événements culturels |
| Les Bords de Somme | Scenic riverside area, excellent for walking and cycling. Ideal for travelers who enjoy outdoor activities and exploring nature. | Rives de la Somme, Sentiers cyclables, Écluses historiques, Zones humides, Points de vue |
Understanding Airbnb License Requirements & STR Laws in Saint-Valery-sur-Somme (2026)
With 18% of listings showing registration in 2026, understanding potential Airbnb license requirements is crucial in Saint-Valery-sur-Somme. Always verify the latest short term rental regulations and Airbnb license requirements directly with local government authorities for Saint-Valery-sur-Somme to ensure full compliance before hosting.
(Source: AirROI data, 2026, based on 18% licensed listings)
Top Performing Airbnb Properties in Saint-Valery-sur-Somme (2026)
Benchmark your potential! Explore examples of top-performing Airbnb properties in Saint-Valery-sur-Sommebased on Trailing Twelve Month (TTM) revenue. Analyze their characteristics, revenue, occupancy rate, and ADR to understand what drives success in this market.
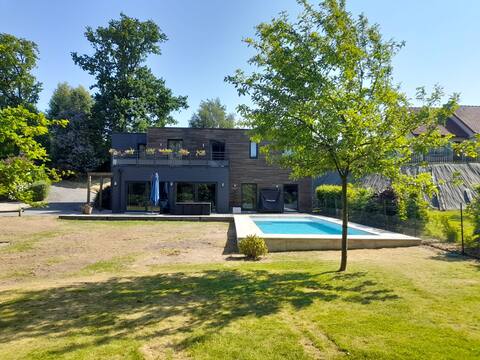
Villa Les Planches with pool
Entire Place • 6 bedrooms

The Family View
Entire Place • 5 bedrooms
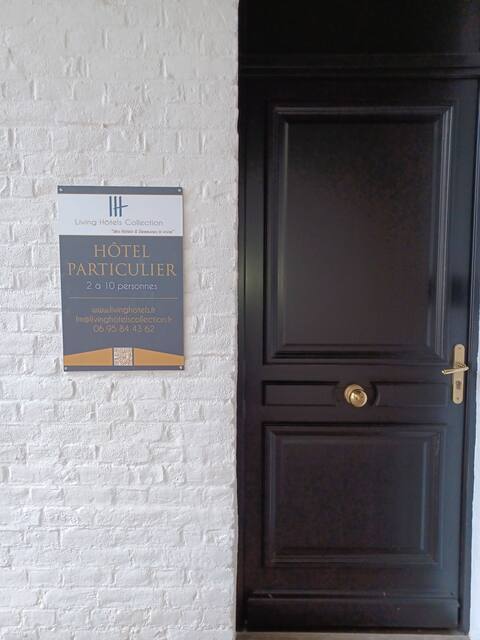
Mansion Saint-Valery-Sur-Somme center
Entire Place • 5 bedrooms
Large charming house with garden, Baie de Somme
Entire Place • 5 bedrooms
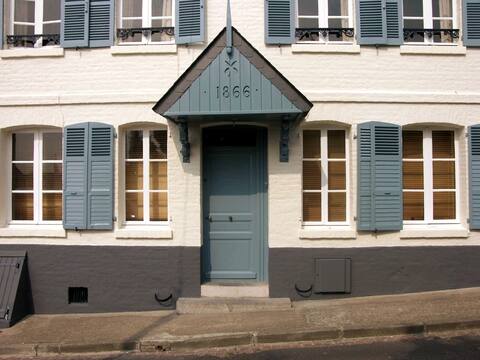
JULES
Entire Place • 5 bedrooms
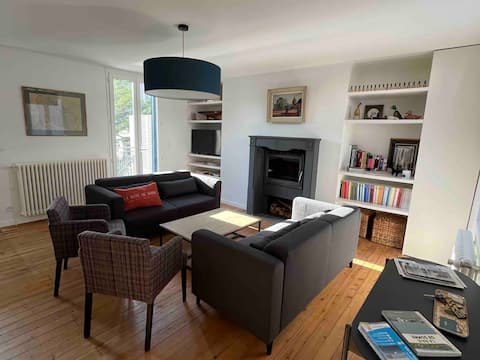
Quai 77-St Valery • Bay View - 6 to 12 people
Entire Place • 4 bedrooms
Note: Performance varies based on location, size, amenities, seasonality, and management quality. Data reflects the past 12 months.
Top Performing Airbnb Hosts in Saint-Valery-sur-Somme (2026)
Learn from the best! This table showcases top-performing Airbnb hosts in Saint-Valery-sur-Somme based on the number of properties managed and estimated total revenue over the past year. Analyze their scale and performance metrics.
| Host Name | Properties | Grossing Revenue | Stay Reviews | Avg Rating |
|---|---|---|---|---|
| Ludivine | 4 | $166,939 | 55 | 4.97/5.0 |
| Hello Keys | 11 | $163,750 | 219 | 4.62/5.0 |
| Alexandre | 3 | $112,242 | 169 | 4.94/5.0 |
| Brigitte & Christophe | 3 | $109,806 | 130 | 4.98/5.0 |
| David | 3 | $92,816 | 365 | 4.93/5.0 |
| Dowlut | 7 | $91,298 | 146 | 4.65/5.0 |
| Brigitte | 5 | $90,129 | 254 | 4.70/5.0 |
| Loïc | 2 | $88,679 | 86 | 4.93/5.0 |
| La Conciergerie Trois Villes S | 3 | $84,114 | 53 | 4.61/5.0 |
| Marine | 2 | $82,529 | 176 | 4.93/5.0 |
Analyzing the strategies of top hosts, such as their property selection, pricing, and guest communication, can offer valuable lessons for optimizing your own Airbnb operations in Saint-Valery-sur-Somme.
Dive Deeper: Advanced Saint-Valery-sur-Somme STR Market Data (2026)
Ready to unlock more insights? AirROI provides access to advanced metrics and comprehensive Airbnb data for Saint-Valery-sur-Somme. Explore detailed analytics beyond this report to refine your investment strategy, optimize pricing, and maximize your vacation rental profits.
Explore Advanced MetricsSaint-Valery-sur-Somme Short-Term Rental Market Composition (2026): Property & Room Types
Room Type Distribution
Property Type Distribution
Market Composition Insights for Saint-Valery-sur-Somme
- The Saint-Valery-sur-Somme Airbnb market composition is heavily skewed towards Entire Home/Apt listings, which make up 98.5% of the 326 active rentals. This indicates strong guest preference for privacy and space.
- Looking at the property type distribution in Saint-Valery-sur-Somme, House properties are the most common (56.7%), reflecting the local real estate landscape.
- Houses represent a significant 56.7% portion, catering likely to families or larger groups.
- Smaller segments like hotel/boutique, outdoor/unique, unique stays, others (combined 4.9%) offer potential for unique stay experiences.
Saint-Valery-sur-Somme Airbnb Room Capacity Analysis (2026): Bedroom Distribution
Distribution of Listings by Number of Bedrooms
Room Capacity Insights for Saint-Valery-sur-Somme
- The dominant room capacity in Saint-Valery-sur-Somme is 2 bedrooms listings, making up 41.7% of the market. This suggests a strong demand for properties suitable for couples or solo travelers.
- Together, 2 bedrooms and 1 bedroom properties represent 69.6% of the active Airbnb listings in Saint-Valery-sur-Somme, indicating a high concentration in these sizes.
- A significant 22.0% of listings offer 3+ bedrooms, catering to larger groups and families seeking more space in Saint-Valery-sur-Somme.
Saint-Valery-sur-Somme Vacation Rental Guest Capacity Trends (2026)
Distribution of Listings by Guest Capacity
Guest Capacity Insights for Saint-Valery-sur-Somme
- The most common guest capacity trend in Saint-Valery-sur-Somme vacation rentals is listings accommodating 4 guests (39.6%). This suggests the primary traveler segment is likely small families or groups.
- Properties designed for 4 guests and 2 guests dominate the Saint-Valery-sur-Somme STR market, accounting for 61.7% of listings.
- 26.5% of properties accommodate 6+ guests, serving the market segment for larger families or group travel in Saint-Valery-sur-Somme.
- On average, properties in Saint-Valery-sur-Somme are equipped to host 4.2 guests.
Saint-Valery-sur-Somme Airbnb Booking Patterns (2026): Available vs. Booked Days
Available Days Distribution
Booked Days Distribution
Booking Pattern Insights for Saint-Valery-sur-Somme
- The most common availability pattern in Saint-Valery-sur-Somme falls within the 181-270 days range, representing 42.9% of listings. This suggests many properties have significant open periods on their calendars.
- Approximately 76.9% of listings show high availability (181+ days open annually), indicating potential for increased bookings or specific owner usage patterns.
- For booked days, the 91-180 days range is most frequent in Saint-Valery-sur-Somme (42.6%), reflecting common guest stay durations or potential owner blocking patterns.
- A notable 25.8% of properties secure long booking periods (181+ days booked per year), highlighting successful long-term rental strategies or significant owner usage.
Saint-Valery-sur-Somme Airbnb Minimum Stay Requirements Analysis
Distribution of Listings by Minimum Night Requirement
1 Night
8 listings
2.5% of total
2 Nights
95 listings
29.1% of total
3 Nights
13 listings
4% of total
4-6 Nights
13 listings
4% of total
7-29 Nights
1 listings
0.3% of total
30+ Nights
196 listings
60.1% of total
Key Insights
- The most prevalent minimum stay requirement in Saint-Valery-sur-Somme is 30+ Nights, adopted by 60.1% of listings. This highlights the market's preference for longer commitments.
- A significant segment (60.1%) caters to monthly stays (30+ nights) in Saint-Valery-sur-Somme, pointing to opportunities in the extended-stay market.
Recommendations
- Align with the market by considering a 30+ Nights minimum stay, as 60.1% of Saint-Valery-sur-Somme hosts use this setting.
- If feasible, allowing 1-night stays, especially midweek or during low season, could capture last-minute bookings, as only 2.5% currently do.
- Explore offering discounts for stays of 30+ nights to attract the 60.1% of the market seeking extended stays.
- Adjust minimum nights based on seasonality – potentially shorter during low season and longer during peak demand periods in Saint-Valery-sur-Somme.
Saint-Valery-sur-Somme Airbnb Cancellation Policy Trends Analysis (2026)
Limited
4 listings
1.2% of total
Flexible
42 listings
12.9% of total
Moderate
114 listings
35% of total
Firm
141 listings
43.3% of total
Strict
25 listings
7.7% of total
Cancellation Policy Insights for Saint-Valery-sur-Somme
- The prevailing Airbnb cancellation policy trend in Saint-Valery-sur-Somme is Firm, used by 43.3% of listings.
- A majority (51.0%) of hosts in Saint-Valery-sur-Somme utilize Firm or Strict policies, indicating a market where hosts prioritize booking security.
- Strict cancellation policies are quite rare (7.7%), potentially making listings with this policy less competitive unless justified by high demand or property type.
Recommendations for Hosts
- Consider adopting a Firm policy to align with the 43.3% market standard in Saint-Valery-sur-Somme.
- Using a Strict policy might deter some guests, as only 7.7% of listings use it. Evaluate if potential revenue protection outweighs possible lower booking rates.
- Regularly review your cancellation policy against competitors and market demand shifts in Saint-Valery-sur-Somme.
Saint-Valery-sur-Somme STR Booking Lead Time Analysis (2026)
Average Booking Lead Time by Month
Booking Lead Time Insights for Saint-Valery-sur-Somme
- The overall average booking lead time for vacation rentals in Saint-Valery-sur-Somme is 47 days.
- Guests book furthest in advance for stays during May (average 68 days), likely coinciding with peak travel demand or local events.
- The shortest booking windows occur for stays in February (average 23 days), indicating more last-minute travel plans during this time.
- Seasonally, Summer (62 days avg.) sees the longest lead times, while Winter (38 days avg.) has the shortest, reflecting typical travel planning cycles.
Recommendations for Hosts
- Use the overall average lead time (47 days) as a baseline for your pricing and availability strategy in Saint-Valery-sur-Somme.
- For May stays, consider implementing length-of-stay discounts or slightly higher rates for bookings made less than 68 days out to capitalize on advance planning.
- Target marketing efforts for the Summer season well in advance (at least 62 days) to capture early planners.
- Monitor your own booking lead times against these Saint-Valery-sur-Somme averages to identify opportunities for dynamic pricing adjustments.
Popular & Essential Airbnb Amenities in Saint-Valery-sur-Somme (2026)
Amenity Prevalence
Amenity Insights for Saint-Valery-sur-Somme
- Essential amenities in Saint-Valery-sur-Somme that guests expect include: Kitchen, Heating. Lacking these (any) could significantly impact bookings.
- Popular amenities like Dishes and silverware, Hot water, TV are common but not universal. Offering these can provide a competitive edge.
- Warning: Wifi is not universally provided but is considered essential globally. Ensure reliable Wifi is offered.
Recommendations for Hosts
- Ensure your listing includes all essential amenities for Saint-Valery-sur-Somme: Kitchen, Heating.
- Prioritize adding missing essentials: Kitchen, Heating.
- Consider adding popular differentiators like Dishes and silverware or Hot water to increase appeal.
- Highlight unique or less common amenities you offer (e.g., hot tub, dedicated workspace, EV charger) in your listing description and photos.
- Regularly check competitor amenities in Saint-Valery-sur-Somme to stay competitive.
Saint-Valery-sur-Somme Airbnb Guest Demographics & Profile Analysis (2026)
Guest Profile Summary for Saint-Valery-sur-Somme
- The typical guest profile for Airbnb in Saint-Valery-sur-Somme consists of primarily domestic travelers (80%), often arriving from nearby Paris, typically belonging to the Post-2000s (Gen Z/Alpha) group (50%), primarily speaking French or English.
- Domestic travelers account for 79.5% of guests.
- Key international markets include France (79.5%) and Belgium (9.9%).
- Top languages spoken are French (43.2%) followed by English (34.6%).
- A significant demographic segment is the Post-2000s (Gen Z/Alpha) group, representing 50% of guests.
Recommendations for Hosts
- Target domestic marketing efforts towards travelers from Paris and Lille.
- Tailor amenities and listing descriptions to appeal to the dominant Post-2000s (Gen Z/Alpha) demographic (e.g., highlight fast WiFi, smart home features, local guides).
- Highlight unique local experiences or amenities relevant to the primary guest profile.
- Consider seasonal promotions aligned with peak travel times for key origin markets.
Nearby Short-Term Rental Market Comparison
How does the Saint-Valery-sur-Somme Airbnb market stack up against its neighbors? Compare key performance metrics like average monthly revenue, ADR, and occupancy rates in surrounding areas to understand the broader regional STR landscape.
| Market | Active Properties | Monthly Revenue | Daily Rate | Avg. Occupancy |
|---|---|---|---|---|
| Lo-Reninge | 13 | $5,989 | $454.03 | 42% |
| La Poterie-Cap-d'Antifer | 15 | $3,878 | $273.66 | 48% |
| Rosoy-en-Multien | 15 | $3,680 | $347.93 | 47% |
| Saint-Étienne-la-Thillaye | 23 | $3,486 | $390.94 | 35% |
| Heuvelland | 56 | $3,348 | $367.19 | 36% |
| Morienval | 12 | $3,308 | $372.82 | 30% |
| Saint-Pierre-du-Val | 15 | $3,257 | $343.84 | 38% |
| Epping Forest | 106 | $3,041 | $275.10 | 46% |
| Diksmuide | 49 | $2,992 | $319.73 | 37% |
| Raray | 11 | $2,970 | $372.54 | 35% |