Terre-de-Haut Airbnb Market Analysis 2026: Short Term Rental Data & Vacation Rental Statistics in Guadeloupe, France
Is Airbnb profitable in Terre-de-Haut in 2026? Explore comprehensive Airbnb analytics for Terre-de-Haut, Guadeloupe, France to uncover income potential. This 2026 STR market report for Terre-de-Haut, based on AirROI data from February 2025 to January 2026, reveals key trends in the niche market of 182 active listings.
Whether you're considering an Airbnb investment in Terre-de-Haut, optimizing your existing vacation rental, or exploring rental arbitrage opportunities, understanding the Terre-de-Haut Airbnb data is crucial. Leveraging the low regulation environment is key to maximizing your short term rental income potential. Let's dive into the specifics.
Key Terre-de-Haut Airbnb Performance Metrics Overview
Monthly Airbnb Revenue Variations & Income Potential in Terre-de-Haut (2026)
Understanding the monthly revenue variations for Airbnb listings in Terre-de-Haut is key to maximizing your short term rental income potential. Seasonality significantly impacts earnings. Our analysis, based on data from the past 12 months, shows that the peak revenue month for STRs in Terre-de-Haut is typically February, while October often presents the lowest earnings, highlighting opportunities for strategic pricing adjustments during shoulder and low seasons. Explore the typical Airbnb income in Terre-de-Haut across different performance tiers:
- Best-in-class properties (Top 10%) achieve $5,176+ monthly, often utilizing dynamic pricing and superior guest experiences.
- Strong performing properties (Top 25%) earn $3,054 or more, indicating effective management and desirable locations/amenities.
- Typical properties (Median) generate around $1,631 per month, representing the average market performance.
- Entry-level properties (Bottom 25%) see earnings around $832, often with potential for optimization.
Average Monthly Airbnb Earnings Trend in Terre-de-Haut
Terre-de-Haut Airbnb Occupancy Rate Trends (2026)
Maximize your bookings by understanding the Terre-de-Haut STR occupancy trends. Seasonal demand shifts significantly influence how often properties are booked. Typically, Februarysees the highest demand (peak season occupancy), while September experiences the lowest (low season). Effective strategies, like adjusting minimum stays or offering promotions, can boost occupancy during slower periods. Here's how different property tiers perform in Terre-de-Haut:
- Best-in-class properties (Top 10%) achieve 76%+ occupancy, indicating high desirability and potentially optimized availability.
- Strong performing properties (Top 25%) maintain 56% or higher occupancy, suggesting good market fit and guest satisfaction.
- Typical properties (Median) have an occupancy rate around 34%.
- Entry-level properties (Bottom 25%) average 18% occupancy, potentially facing higher vacancy.
Average Monthly Occupancy Rate Trend in Terre-de-Haut
Average Daily Rate (ADR) Airbnb Trends in Terre-de-Haut (2026)
Effective short term rental pricing strategy in Terre-de-Haut involves understanding monthly ADR fluctuations. The Average Daily Rate (ADR) for Airbnb in Terre-de-Haut typically peaks in January and dips lowest during April. Leveraging Airbnb dynamic pricing tools or strategies based on this seasonality can significantly boost revenue. Here's a look at the typical nightly rates achieved:
- Best-in-class properties (Top 10%) command rates of $394+ per night, often due to premium features or locations.
- Strong performing properties (Top 25%) achieve nightly rates of $247 or more.
- Typical properties (Median) charge around $152 per night.
- Entry-level properties (Bottom 25%) earn around $107 per night.
Average Daily Rate (ADR) Trend by Month in Terre-de-Haut
Get Live Terre-de-Haut Market Intelligence 👇

Explore Real-time Analytics
Airbnb Seasonality Analysis & Trends in Terre-de-Haut (2026)
Peak Season (February, March, April)
- Revenue averages $3,168 per month
- Occupancy rates average 55.4%
- Daily rates average $205
Shoulder Season
- Revenue averages $2,285 per month
- Occupancy maintains around 35.9%
- Daily rates hold near $210
Low Season (June, September, October)
- Revenue drops to average $1,801 per month
- Occupancy decreases to average 27.1%
- Daily rates adjust to average $208
Seasonality Insights for Terre-de-Haut
- The Airbnb seasonality in Terre-de-Haut shows moderate seasonality with distinct peak and low periods. While the sections above show seasonal averages, it's also insightful to look at the extremes:
- During the high season, the absolute peak month showcases Terre-de-Haut's highest earning potential, with monthly revenues capable of climbing to $3,411, occupancy reaching a high of 62.3%, and ADRs peaking at $216.
- Conversely, the slowest single month of the year, typically falling within the low season, marks the market's lowest point. In this month, revenue might dip to $1,745, occupancy could drop to 23.2%, and ADRs may adjust down to $203.
- Understanding both the seasonal averages and these monthly peaks and troughs in revenue, occupancy, and ADR is crucial for maximizing your Airbnb profit potential in Terre-de-Haut.
Seasonal Strategies for Maximizing Profit
- Peak Season: Maximize revenue through premium pricing and potentially longer minimum stays. Ensure high availability.
- Low Season: Offer competitive pricing, special promotions (e.g., extended stay discounts), and flexible cancellation policies. Target off-season travelers like remote workers or budget-conscious guests.
- Shoulder Seasons: Implement dynamic pricing that balances peak and low rates. Target weekend travelers or specific events. Offer slightly more flexible terms than peak season.
- Regularly analyze your own performance against these Terre-de-Haut seasonality benchmarks and adjust your pricing and availability strategy accordingly.
Best Areas for Airbnb Investment in Terre-de-Haut (2026)
Exploring the top neighborhoods for short-term rentals in Terre-de-Haut? This section highlights key areas, outlining why they are attractive for hosts and guests, along with notable local attractions. Consider these locations based on your target guest profile and investment strategy.
| Neighborhood / Area | Why Host Here? (Target Guests & Appeal) | Key Attractions & Landmarks |
|---|---|---|
| Anse Tarare | A stunning beach known for its turquoise waters and golden sand, ideal for relaxation and water activities. It attracts visitors looking for a picturesque getaway with beachfront access. | Anse Tarare Beach, Snorkeling spots, Water sports, Local eateries |
| Anse Rodrigue | One of the most beautiful and less crowded beaches on the island, perfect for nature lovers and those seeking tranquility. It offers a stunning landscape and a more intimate experience. | Anse Rodrigue Beach, Hiking trails, Scenic views, Beachfront restaurants |
| Les Saintes | A group of picturesque islands known for their beautiful landscapes, rich history, and vibrant culture. A hotspot for tourists interested in culture, history, and nature. | Fort Napoleon, Anse Mitan, Local markets, Historical museums, Water activities |
| Ilet Napoléon | A small island off the coast of Terre-de-Haut known for its stunning views and natural beauty. Great for day trips and eco-tourism. | Ilet Napoléon, Snorkeling, Marine life, Breathtaking views |
| La Plage de Pompierre | A popular beach known for its calm waters and beautiful scenery, perfect for families and those looking to relax under the sun. | Pompierre Beach, Picnic spots, Water activities, Scenic walks |
| Carénage | A charming area with a vibrant atmosphere and local businesses, perfect for experiencing the local culture and cuisine. | Local markets, Restaurants, Shops, Cultural experiences |
| Town Center of Terre-de-Haut | The heart of the island, bustling with activity, shops, and restaurants. Great for tourists wanting to experience the local life and community. | Restaurants, Shops, Cafes, Cultural events |
| Grande Anse | Known for its natural beauty and less touristy vibe, making it a great spot for relaxation and enjoying nature away from the crowds. | Grande Anse Beach, Hiking paths, Nature tours, Quiet atmosphere |
Understanding Airbnb License Requirements & STR Laws in Terre-de-Haut (2026)
While Terre-de-Haut, Guadeloupe, France currently shows low STR regulations, specific Airbnb license requirements might still exist or change. Always verify the latest short term rental regulations and Airbnb license requirements directly with local government authorities for Terre-de-Haut to ensure full compliance before hosting.
(Source: AirROI data, 2026, finding no licensed listings among those analyzed)
Top Performing Airbnb Properties in Terre-de-Haut (2026)
Benchmark your potential! Explore examples of top-performing Airbnb properties in Terre-de-Hautbased on Trailing Twelve Month (TTM) revenue. Analyze their characteristics, revenue, occupancy rate, and ADR to understand what drives success in this market.
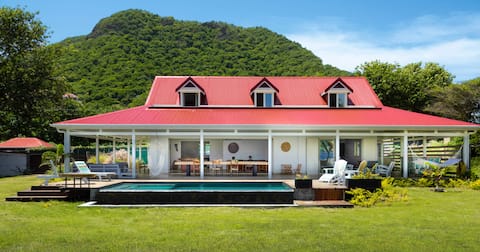
Villa Red Rock
Entire Place • 4 bedrooms
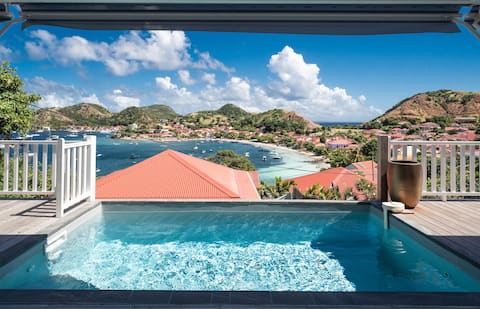
Villa Rackam view on the Bay with pool
Entire Place • 2 bedrooms

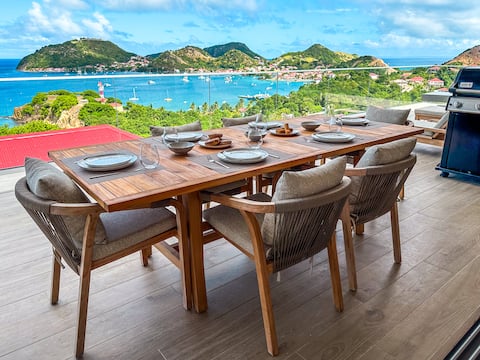
*Villa Baïa* 3 bedrooms – Paradise Bay
Entire Place • 3 bedrooms
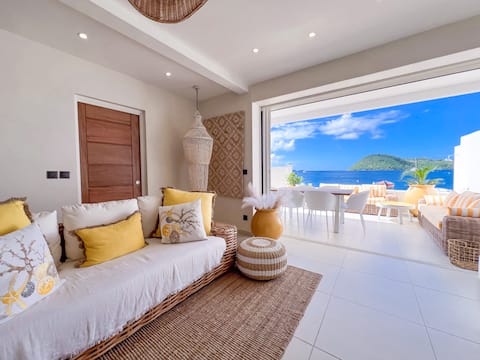
*Villa Iwana* 2 bedrooms - Paradise Bay
Entire Place • 2 bedrooms

Villa Célyote (High)
Entire Place • 3 bedrooms
Luxury and exceptional views in Les Saintes
Entire Place • 3 bedrooms
Note: Performance varies based on location, size, amenities, seasonality, and management quality. Data reflects the past 12 months.
Top Performing Airbnb Hosts in Terre-de-Haut (2026)
Learn from the best! This table showcases top-performing Airbnb hosts in Terre-de-Haut based on the number of properties managed and estimated total revenue over the past year. Analyze their scale and performance metrics.
| Host Name | Properties | Grossing Revenue | Stay Reviews | Avg Rating |
|---|---|---|---|---|
| Baie Du Paradis | 4 | $310,617 | 25 | 5.00/5.0 |
| La Conciergerie Des Saintes | 13 | $168,999 | 166 | 4.80/5.0 |
| Aliz�ée | 1 | $165,466 | 29 | 4.97/5.0 |
| Agnès | 9 | $154,571 | 159 | 4.75/5.0 |
| ZeWelcome | 1 | $107,215 | 28 | 5.00/5.0 |
| Françoise | 4 | $80,327 | 159 | 4.89/5.0 |
| Melinda | 3 | $80,091 | 800 | 4.91/5.0 |
| Laurence | 2 | $79,850 | 37 | 4.98/5.0 |
| Coco | 1 | $78,690 | 34 | 4.94/5.0 |
| IBAÏA Immobilier | 1 | $75,800 | 2 | Not Rated |
Analyzing the strategies of top hosts, such as their property selection, pricing, and guest communication, can offer valuable lessons for optimizing your own Airbnb operations in Terre-de-Haut.
Dive Deeper: Advanced Terre-de-Haut STR Market Data (2026)
Ready to unlock more insights? AirROI provides access to advanced metrics and comprehensive Airbnb data for Terre-de-Haut. Explore detailed analytics beyond this report to refine your investment strategy, optimize pricing, and maximize your vacation rental profits.
Explore Advanced MetricsTerre-de-Haut Short-Term Rental Market Composition (2026): Property & Room Types
Room Type Distribution
Property Type Distribution
Market Composition Insights for Terre-de-Haut
- The Terre-de-Haut Airbnb market composition is heavily skewed towards Entire Home/Apt listings, which make up 91.2% of the 182 active rentals. This indicates strong guest preference for privacy and space.
- Looking at the property type distribution in Terre-de-Haut, House properties are the most common (61%), reflecting the local real estate landscape.
- Houses represent a significant 61% portion, catering likely to families or larger groups.
- The presence of 6.6% Hotel/Boutique listings indicates integration with traditional hospitality.
- Smaller segments like others, outdoor/unique (combined 2.2%) offer potential for unique stay experiences.
Terre-de-Haut Airbnb Room Capacity Analysis (2026): Bedroom Distribution
Distribution of Listings by Number of Bedrooms
Room Capacity Insights for Terre-de-Haut
- The dominant room capacity in Terre-de-Haut is 1 bedroom listings, making up 38.5% of the market. This suggests a strong demand for properties suitable for couples or solo travelers.
- Together, 1 bedroom and 2 bedrooms properties represent 68.7% of the active Airbnb listings in Terre-de-Haut, indicating a high concentration in these sizes.
Terre-de-Haut Vacation Rental Guest Capacity Trends (2026)
Distribution of Listings by Guest Capacity
Guest Capacity Insights for Terre-de-Haut
- The most common guest capacity trend in Terre-de-Haut vacation rentals is listings accommodating 4 guests (29.7%). This suggests the primary traveler segment is likely small families or groups.
- Properties designed for 4 guests and 2 guests dominate the Terre-de-Haut STR market, accounting for 57.7% of listings.
- 25.8% of properties accommodate 6+ guests, serving the market segment for larger families or group travel in Terre-de-Haut.
- On average, properties in Terre-de-Haut are equipped to host 3.9 guests.
Terre-de-Haut Airbnb Booking Patterns (2026): Available vs. Booked Days
Available Days Distribution
Booked Days Distribution
Booking Pattern Insights for Terre-de-Haut
- The most common availability pattern in Terre-de-Haut falls within the 271-366 days range, representing 48.9% of listings. This suggests many properties have significant open periods on their calendars.
- Approximately 84.1% of listings show high availability (181+ days open annually), indicating potential for increased bookings or specific owner usage patterns.
- For booked days, the 91-180 days range is most frequent in Terre-de-Haut (34.6%), reflecting common guest stay durations or potential owner blocking patterns.
- A notable 17.0% of properties secure long booking periods (181+ days booked per year), highlighting successful long-term rental strategies or significant owner usage.
Terre-de-Haut Airbnb Minimum Stay Requirements Analysis
Distribution of Listings by Minimum Night Requirement
1 Night
30 listings
16.5% of total
2 Nights
48 listings
26.4% of total
3 Nights
20 listings
11% of total
4-6 Nights
12 listings
6.6% of total
7-29 Nights
2 listings
1.1% of total
30+ Nights
70 listings
38.5% of total
Key Insights
- The most prevalent minimum stay requirement in Terre-de-Haut is 30+ Nights, adopted by 38.5% of listings. This highlights the market's preference for longer commitments.
- A significant segment (38.5%) caters to monthly stays (30+ nights) in Terre-de-Haut, pointing to opportunities in the extended-stay market.
Recommendations
- Align with the market by considering a 30+ Nights minimum stay, as 38.5% of Terre-de-Haut hosts use this setting.
- If feasible, allowing 1-night stays, especially midweek or during low season, could capture last-minute bookings, as only 16.5% currently do.
- Explore offering discounts for stays of 30+ nights to attract the 38.5% of the market seeking extended stays.
- Adjust minimum nights based on seasonality – potentially shorter during low season and longer during peak demand periods in Terre-de-Haut.
Terre-de-Haut Airbnb Cancellation Policy Trends Analysis (2026)
Super Strict 60 Days
1 listings
0.6% of total
Super Strict 30 Days
3 listings
1.7% of total
Limited
3 listings
1.7% of total
Flexible
36 listings
19.9% of total
Moderate
33 listings
18.2% of total
Firm
80 listings
44.2% of total
Strict
25 listings
13.8% of total
Cancellation Policy Insights for Terre-de-Haut
- The prevailing Airbnb cancellation policy trend in Terre-de-Haut is Firm, used by 44.2% of listings.
- A majority (58.0%) of hosts in Terre-de-Haut utilize Firm or Strict policies, indicating a market where hosts prioritize booking security.
Recommendations for Hosts
- Consider adopting a Firm policy to align with the 44.2% market standard in Terre-de-Haut.
- Using a Strict policy might deter some guests, as only 13.8% of listings use it. Evaluate if potential revenue protection outweighs possible lower booking rates.
- Regularly review your cancellation policy against competitors and market demand shifts in Terre-de-Haut.
Terre-de-Haut STR Booking Lead Time Analysis (2026)
Average Booking Lead Time by Month
Booking Lead Time Insights for Terre-de-Haut
- The overall average booking lead time for vacation rentals in Terre-de-Haut is 62 days.
- Guests book furthest in advance for stays during January (average 96 days), likely coinciding with peak travel demand or local events.
- The shortest booking windows occur for stays in June (average 33 days), indicating more last-minute travel plans during this time.
- Seasonally, Winter (80 days avg.) sees the longest lead times, while Fall (51 days avg.) has the shortest, reflecting typical travel planning cycles.
Recommendations for Hosts
- Use the overall average lead time (62 days) as a baseline for your pricing and availability strategy in Terre-de-Haut.
- For January stays, consider implementing length-of-stay discounts or slightly higher rates for bookings made less than 96 days out to capitalize on advance planning.
- Target marketing efforts for the Winter season well in advance (at least 80 days) to capture early planners.
- Monitor your own booking lead times against these Terre-de-Haut averages to identify opportunities for dynamic pricing adjustments.
Popular & Essential Airbnb Amenities in Terre-de-Haut (2026)
Amenity Prevalence
Amenity Insights for Terre-de-Haut
- Popular amenities like Kitchen, Wifi, Air conditioning are common but not universal. Offering these can provide a competitive edge.
- Warning: Wifi is not universally provided but is considered essential globally. Ensure reliable Wifi is offered.
Recommendations for Hosts
- Consider adding popular differentiators like Kitchen or Wifi to increase appeal.
- Highlight unique or less common amenities you offer (e.g., hot tub, dedicated workspace, EV charger) in your listing description and photos.
- Regularly check competitor amenities in Terre-de-Haut to stay competitive.
Terre-de-Haut Airbnb Guest Demographics & Profile Analysis (2026)
Guest Profile Summary for Terre-de-Haut
- The typical guest profile for Airbnb in Terre-de-Haut consists of primarily domestic travelers (73%), often arriving from nearby Paris, typically belonging to the Post-2000s (Gen Z/Alpha) group (50%), primarily speaking French or English.
- Domestic travelers account for 72.7% of guests.
- Key international markets include France (72.7%) and Guadeloupe (11%).
- Top languages spoken are French (42.2%) followed by English (35.9%).
- A significant demographic segment is the Post-2000s (Gen Z/Alpha) group, representing 50% of guests.
Recommendations for Hosts
- Target domestic marketing efforts towards travelers from Paris and Montreal.
- Tailor amenities and listing descriptions to appeal to the dominant Post-2000s (Gen Z/Alpha) demographic (e.g., highlight fast WiFi, smart home features, local guides).
- Highlight unique local experiences or amenities relevant to the primary guest profile.
- Consider seasonal promotions aligned with peak travel times for key origin markets.
Nearby Short-Term Rental Market Comparison
How does the Terre-de-Haut Airbnb market stack up against its neighbors? Compare key performance metrics like average monthly revenue, ADR, and occupancy rates in surrounding areas to understand the broader regional STR landscape.
| Market | Active Properties | Monthly Revenue | Daily Rate | Avg. Occupancy |
|---|---|---|---|---|
| Cap Estate | 18 | $3,764 | $581.25 | 32% |
| Pigeon Island | 45 | $3,108 | $384.90 | 35% |
| Gros Islet | 89 | $2,307 | $337.22 | 33% |
| Les Anses-d'Arlet | 10 | $1,909 | $297.12 | 35% |
| Woodford Hill | 17 | $1,876 | $176.83 | 41% |
| Castries | 105 | $1,854 | $228.00 | 34% |
| Rodney Bay | 239 | $1,748 | $195.52 | 39% |
| Le Diamant | 729 | $1,670 | $191.09 | 42% |
| Saint-Pierre | 81 | $1,631 | $160.75 | 43% |
| Les Anses-d'Arlet | 311 | $1,555 | $177.15 | 40% |