Baie-Mahault Airbnb Market Analysis 2026: Short Term Rental Data & Vacation Rental Statistics in Guadeloupe, France
Is Airbnb profitable in Baie-Mahault in 2026? Explore comprehensive Airbnb analytics for Baie-Mahault, Guadeloupe, France to uncover income potential. This 2026 STR market report for Baie-Mahault, based on AirROI data from February 2025 to January 2026, reveals key trends in the niche market of 189 active listings.
Whether you're considering an Airbnb investment in Baie-Mahault, optimizing your existing vacation rental, or exploring rental arbitrage opportunities, understanding the Baie-Mahault Airbnb data is crucial. Leveraging the low regulation environment is key to maximizing your short term rental income potential. Let's dive into the specifics.
Key Baie-Mahault Airbnb Performance Metrics Overview
Monthly Airbnb Revenue Variations & Income Potential in Baie-Mahault (2026)
Understanding the monthly revenue variations for Airbnb listings in Baie-Mahault is key to maximizing your short term rental income potential. Seasonality significantly impacts earnings. Our analysis, based on data from the past 12 months, shows that the peak revenue month for STRs in Baie-Mahault is typically February, while September often presents the lowest earnings, highlighting opportunities for strategic pricing adjustments during shoulder and low seasons. Explore the typical Airbnb income in Baie-Mahault across different performance tiers:
- Best-in-class properties (Top 10%) achieve $3,365+ monthly, often utilizing dynamic pricing and superior guest experiences.
- Strong performing properties (Top 25%) earn $2,024 or more, indicating effective management and desirable locations/amenities.
- Typical properties (Median) generate around $1,153 per month, representing the average market performance.
- Entry-level properties (Bottom 25%) see earnings around $511, often with potential for optimization.
Average Monthly Airbnb Earnings Trend in Baie-Mahault
Baie-Mahault Airbnb Occupancy Rate Trends (2026)
Maximize your bookings by understanding the Baie-Mahault STR occupancy trends. Seasonal demand shifts significantly influence how often properties are booked. Typically, Februarysees the highest demand (peak season occupancy), while January experiences the lowest (low season). Effective strategies, like adjusting minimum stays or offering promotions, can boost occupancy during slower periods. Here's how different property tiers perform in Baie-Mahault:
- Best-in-class properties (Top 10%) achieve 86%+ occupancy, indicating high desirability and potentially optimized availability.
- Strong performing properties (Top 25%) maintain 68% or higher occupancy, suggesting good market fit and guest satisfaction.
- Typical properties (Median) have an occupancy rate around 42%.
- Entry-level properties (Bottom 25%) average 17% occupancy, potentially facing higher vacancy.
Average Monthly Occupancy Rate Trend in Baie-Mahault
Average Daily Rate (ADR) Airbnb Trends in Baie-Mahault (2026)
Effective short term rental pricing strategy in Baie-Mahault involves understanding monthly ADR fluctuations. The Average Daily Rate (ADR) for Airbnb in Baie-Mahault typically peaks in December and dips lowest during March. Leveraging Airbnb dynamic pricing tools or strategies based on this seasonality can significantly boost revenue. Here's a look at the typical nightly rates achieved:
- Best-in-class properties (Top 10%) command rates of $255+ per night, often due to premium features or locations.
- Strong performing properties (Top 25%) achieve nightly rates of $134 or more.
- Typical properties (Median) charge around $84 per night.
- Entry-level properties (Bottom 25%) earn around $66 per night.
Average Daily Rate (ADR) Trend by Month in Baie-Mahault
Get Live Baie-Mahault Market Intelligence 👇

Explore Real-time Analytics
Airbnb Seasonality Analysis & Trends in Baie-Mahault (2026)
Peak Season (February, March, April)
- Revenue averages $1,998 per month
- Occupancy rates average 57.4%
- Daily rates average $121
Shoulder Season
- Revenue averages $1,516 per month
- Occupancy maintains around 42.2%
- Daily rates hold near $128
Low Season (January, June, September)
- Revenue drops to average $1,130 per month
- Occupancy decreases to average 33.6%
- Daily rates adjust to average $129
Seasonality Insights for Baie-Mahault
- The Airbnb seasonality in Baie-Mahault shows highly seasonal trends requiring careful strategy. While the sections above show seasonal averages, it's also insightful to look at the extremes:
- During the high season, the absolute peak month showcases Baie-Mahault's highest earning potential, with monthly revenues capable of climbing to $2,202, occupancy reaching a high of 63.0%, and ADRs peaking at $134.
- Conversely, the slowest single month of the year, typically falling within the low season, marks the market's lowest point. In this month, revenue might dip to $1,044, occupancy could drop to 32.7%, and ADRs may adjust down to $120.
- Understanding both the seasonal averages and these monthly peaks and troughs in revenue, occupancy, and ADR is crucial for maximizing your Airbnb profit potential in Baie-Mahault.
Seasonal Strategies for Maximizing Profit
- Peak Season: Maximize revenue through premium pricing and potentially longer minimum stays. Ensure high availability.
- Low Season: Offer competitive pricing, special promotions (e.g., extended stay discounts), and flexible cancellation policies. Target off-season travelers like remote workers or budget-conscious guests.
- Shoulder Seasons: Implement dynamic pricing that balances peak and low rates. Target weekend travelers or specific events. Offer slightly more flexible terms than peak season.
- Regularly analyze your own performance against these Baie-Mahault seasonality benchmarks and adjust your pricing and availability strategy accordingly.
Best Areas for Airbnb Investment in Baie-Mahault (2026)
Exploring the top neighborhoods for short-term rentals in Baie-Mahault? This section highlights key areas, outlining why they are attractive for hosts and guests, along with notable local attractions. Consider these locations based on your target guest profile and investment strategy.
| Neighborhood / Area | Why Host Here? (Target Guests & Appeal) | Key Attractions & Landmarks |
|---|---|---|
| Lamentin | A residential area with easy access to amenities and nearby attractions, making it popular for families and business travelers who prefer a quieter environment. | Parc Naturel de la Guadeloupe, Les Abymes, Cul-de-Sac du Grand Cul-de-Sac Marin, Cacao Beach, Jardin Botanique de Deshaies |
| Jarry | An industrial and commercial area with a variety of restaurants and shops. Attractive for business travelers visiting local enterprises and professionals attending conferences. | Centre Commercial de Jarry, Local restaurants, Vogel's Kaï, Guadeloupean art galleries, Nightlife in the area |
| Baie-Mahault | The heart of commerce in Guadeloupe, making it ideal for short stays for business travel with close proximity to shopping and dining options. | Village de Jarry, Les Halles de Baie-Mahault, Cacique Park, Café des Arts, Local markets |
| Les Abymes | Close to the airport, this area is convenient for tourists and provides access to more local experiences while being just minutes from the capital city of Pointe-à-Pitre. | Pointe-à-Pitre International Airport, Cimetiere de Morne-A-l'Eau, Anse des Rochers Beach, Parque de la Verdure |
| Pointe-à-Pitre | The bustling capital city of Guadeloupe, rich in history and culture. Great for tourists wishing to explore the heritage sites and local cuisine. | Musée Saint-John Perse, Porte de la Darse, Place de la Victoire, Cultural festivals, Local markets |
| Sainte-Anne | A beautiful coastal area known for its stunning beaches and tourist-friendly atmosphere, making it attractive for vacation rentals. | Plage de la Caravelle, Le Helleux Beach, La Toubana Beach, Local seafood restaurants, Water sports activities |
| Saint-François | Popular tourist destination known for its golf courses and beautiful marinas, ideal for attracting vacationers looking for leisure and recreation. | Plage de la Pointe des Châteaux, Golf International de Saint-François, Marina de Saint-François, Local art galleries, Cultural events |
| Gosier | A vibrant tourist hub with beautiful beaches and nightlife, perfect for vacationers seeking both relaxation and entertainment. | Plage de la Datcha, Ilet du Gosier, Local bars and restaurants, Snorkeling and diving spots, Events and parties |
Understanding Airbnb License Requirements & STR Laws in Baie-Mahault (2026)
While Baie-Mahault, Guadeloupe, France currently shows low STR regulations, specific Airbnb license requirements might still exist or change. Always verify the latest short term rental regulations and Airbnb license requirements directly with local government authorities for Baie-Mahault to ensure full compliance before hosting.
(Source: AirROI data, 2026, finding no licensed listings among those analyzed)
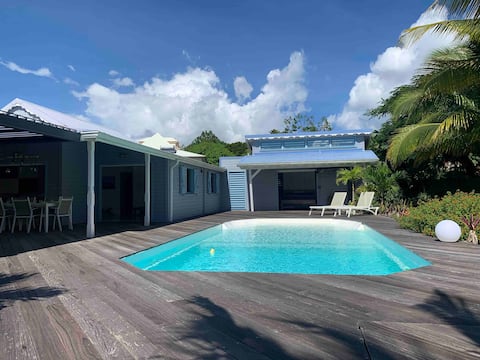
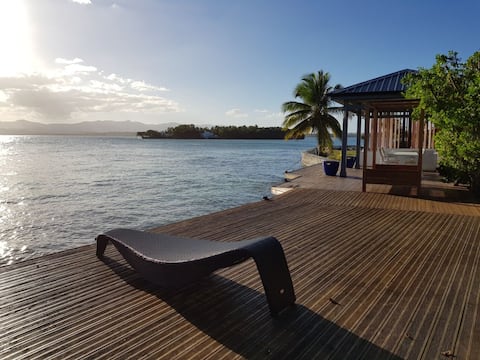
Top Performing Airbnb Properties in Baie-Mahault (2026)
Benchmark your potential! Explore examples of top-performing Airbnb properties in Baie-Mahaultbased on Trailing Twelve Month (TTM) revenue. Analyze their characteristics, revenue, occupancy rate, and ADR to understand what drives success in this market.

Beautiful Luxury Villa Domaine de Biglette
Entire Place • 3 bedrooms

Atypical central house
Entire Place • 3 bedrooms

Villa Kanisi 3 bedrooms, 3 bathrooms, private pool
Entire Place • 3 bedrooms

La Maison Créole
Entire Place • 2 bedrooms
Villa Biglette
Entire Place • 4 bedrooms
Rivage-Luxury villa on private island 4 pers 2ch
Entire Place • 4 bedrooms
Note: Performance varies based on location, size, amenities, seasonality, and management quality. Data reflects the past 12 months.
Top Performing Airbnb Hosts in Baie-Mahault (2026)
Learn from the best! This table showcases top-performing Airbnb hosts in Baie-Mahault based on the number of properties managed and estimated total revenue over the past year. Analyze their scale and performance metrics.
| Host Name | Properties | Grossing Revenue | Stay Reviews | Avg Rating |
|---|---|---|---|---|
| Riv'Island | 6 | $119,182 | 117 | 4.75/5.0 |
| Régis | 2 | $78,776 | 47 | 5.00/5.0 |
| Caraïbes Guest | 2 | $67,647 | 21 | 4.62/5.0 |
| Candice Et Mathieu | 1 | $56,441 | 40 | 4.75/5.0 |
| Anne Marie | 2 | $55,736 | 32 | 4.88/5.0 |
| Marakuja | 2 | $53,986 | 89 | 4.39/5.0 |
| Martine | 2 | $50,453 | 56 | 4.94/5.0 |
| Charline | 1 | $47,855 | 9 | 5.00/5.0 |
| Christophe | 1 | $41,035 | 23 | 4.91/5.0 |
| Sophie | 2 | $39,677 | 101 | 4.86/5.0 |
Analyzing the strategies of top hosts, such as their property selection, pricing, and guest communication, can offer valuable lessons for optimizing your own Airbnb operations in Baie-Mahault.
Dive Deeper: Advanced Baie-Mahault STR Market Data (2026)
Ready to unlock more insights? AirROI provides access to advanced metrics and comprehensive Airbnb data for Baie-Mahault. Explore detailed analytics beyond this report to refine your investment strategy, optimize pricing, and maximize your vacation rental profits.
Explore Advanced MetricsBaie-Mahault Short-Term Rental Market Composition (2026): Property & Room Types
Room Type Distribution
Property Type Distribution
Market Composition Insights for Baie-Mahault
- The Baie-Mahault Airbnb market composition is heavily skewed towards Entire Home/Apt listings, which make up 87.3% of the 189 active rentals. This indicates strong guest preference for privacy and space.
- Looking at the property type distribution in Baie-Mahault, House properties are the most common (66.7%), reflecting the local real estate landscape.
- Houses represent a significant 66.7% portion, catering likely to families or larger groups.
- The presence of 8.5% Hotel/Boutique listings indicates integration with traditional hospitality.
- Smaller segments like others, outdoor/unique (combined 4.3%) offer potential for unique stay experiences.
Baie-Mahault Airbnb Room Capacity Analysis (2026): Bedroom Distribution
Distribution of Listings by Number of Bedrooms
Room Capacity Insights for Baie-Mahault
- The dominant room capacity in Baie-Mahault is 1 bedroom listings, making up 43.9% of the market. This suggests a strong demand for properties suitable for couples or solo travelers.
- Together, 1 bedroom and 2 bedrooms properties represent 63.5% of the active Airbnb listings in Baie-Mahault, indicating a high concentration in these sizes.
- A significant 23.2% of listings offer 3+ bedrooms, catering to larger groups and families seeking more space in Baie-Mahault.
Baie-Mahault Vacation Rental Guest Capacity Trends (2026)
Distribution of Listings by Guest Capacity
Guest Capacity Insights for Baie-Mahault
- The most common guest capacity trend in Baie-Mahault vacation rentals is listings accommodating 2 guests (28.6%). This suggests the primary traveler segment is likely couples or solo travelers.
- Properties designed for 2 guests and 4 guests dominate the Baie-Mahault STR market, accounting for 50.8% of listings.
- 23.8% of properties accommodate 6+ guests, serving the market segment for larger families or group travel in Baie-Mahault.
- On average, properties in Baie-Mahault are equipped to host 3.6 guests.
Baie-Mahault Airbnb Booking Patterns (2026): Available vs. Booked Days
Available Days Distribution
Booked Days Distribution
Booking Pattern Insights for Baie-Mahault
- The most common availability pattern in Baie-Mahault falls within the 271-366 days range, representing 52.4% of listings. This suggests many properties have significant open periods on their calendars.
- Approximately 76.7% of listings show high availability (181+ days open annually), indicating potential for increased bookings or specific owner usage patterns.
- For booked days, the 31-90 days range is most frequent in Baie-Mahault (26.5%), reflecting common guest stay durations or potential owner blocking patterns.
- A notable 23.3% of properties secure long booking periods (181+ days booked per year), highlighting successful long-term rental strategies or significant owner usage.
Baie-Mahault Airbnb Minimum Stay Requirements Analysis
Distribution of Listings by Minimum Night Requirement
1 Night
24 listings
12.7% of total
2 Nights
23 listings
12.2% of total
3 Nights
27 listings
14.3% of total
4-6 Nights
61 listings
32.3% of total
7-29 Nights
11 listings
5.8% of total
30+ Nights
43 listings
22.8% of total
Key Insights
- The most prevalent minimum stay requirement in Baie-Mahault is 4-6 Nights, adopted by 32.3% of listings. This highlights the market's preference for longer commitments.
- A significant segment (22.8%) caters to monthly stays (30+ nights) in Baie-Mahault, pointing to opportunities in the extended-stay market.
Recommendations
- Align with the market by considering a 4-6 Nights minimum stay, as 32.3% of Baie-Mahault hosts use this setting.
- If feasible, allowing 1-night stays, especially midweek or during low season, could capture last-minute bookings, as only 12.7% currently do.
- Explore offering discounts for stays of 30+ nights to attract the 22.8% of the market seeking extended stays.
- Adjust minimum nights based on seasonality – potentially shorter during low season and longer during peak demand periods in Baie-Mahault.
Baie-Mahault Airbnb Cancellation Policy Trends Analysis (2026)
Limited
2 listings
1.1% of total
Super Strict 30 Days
3 listings
1.6% of total
Flexible
59 listings
31.2% of total
Moderate
57 listings
30.2% of total
Firm
62 listings
32.8% of total
Strict
6 listings
3.2% of total
Cancellation Policy Insights for Baie-Mahault
- The prevailing Airbnb cancellation policy trend in Baie-Mahault is Firm, used by 32.8% of listings.
- There's a relatively balanced mix between guest-friendly (61.4%) and stricter (36.0%) policies, offering choices for different guest needs.
- Strict cancellation policies are quite rare (3.2%), potentially making listings with this policy less competitive unless justified by high demand or property type.
Recommendations for Hosts
- Consider adopting a Firm policy to align with the 32.8% market standard in Baie-Mahault.
- Using a Strict policy might deter some guests, as only 3.2% of listings use it. Evaluate if potential revenue protection outweighs possible lower booking rates.
- Regularly review your cancellation policy against competitors and market demand shifts in Baie-Mahault.
Baie-Mahault STR Booking Lead Time Analysis (2026)
Average Booking Lead Time by Month
Booking Lead Time Insights for Baie-Mahault
- The overall average booking lead time for vacation rentals in Baie-Mahault is 45 days.
- Guests book furthest in advance for stays during December (average 67 days), likely coinciding with peak travel demand or local events.
- The shortest booking windows occur for stays in September (average 25 days), indicating more last-minute travel plans during this time.
- Seasonally, Winter (60 days avg.) sees the longest lead times, while Fall (28 days avg.) has the shortest, reflecting typical travel planning cycles.
Recommendations for Hosts
- Use the overall average lead time (45 days) as a baseline for your pricing and availability strategy in Baie-Mahault.
- For December stays, consider implementing length-of-stay discounts or slightly higher rates for bookings made less than 67 days out to capitalize on advance planning.
- Target marketing efforts for the Winter season well in advance (at least 60 days) to capture early planners.
- Monitor your own booking lead times against these Baie-Mahault averages to identify opportunities for dynamic pricing adjustments.
Popular & Essential Airbnb Amenities in Baie-Mahault (2026)
Amenity Prevalence
Amenity Insights for Baie-Mahault
- Essential amenities in Baie-Mahault that guests expect include: Wifi, Air conditioning, Kitchen. Lacking these (any) could significantly impact bookings.
- Popular amenities like TV, Washer, Free parking on premises are common but not universal. Offering these can provide a competitive edge.
Recommendations for Hosts
- Ensure your listing includes all essential amenities for Baie-Mahault: Wifi, Air conditioning, Kitchen.
- Prioritize adding missing essentials: Wifi, Air conditioning, Kitchen.
- Consider adding popular differentiators like TV or Washer to increase appeal.
- Highlight unique or less common amenities you offer (e.g., hot tub, dedicated workspace, EV charger) in your listing description and photos.
- Regularly check competitor amenities in Baie-Mahault to stay competitive.
Baie-Mahault Airbnb Guest Demographics & Profile Analysis (2026)
Guest Profile Summary for Baie-Mahault
- The typical guest profile for Airbnb in Baie-Mahault consists of a mix of domestic (60%) and international guests, often arriving from nearby Paris, typically belonging to the Post-2000s (Gen Z/Alpha) group (50%), primarily speaking French or English.
- Domestic travelers account for 60.1% of guests.
- Key international markets include France (60.1%) and Guadeloupe (13.5%).
- Top languages spoken are French (48.1%) followed by English (32%).
- A significant demographic segment is the Post-2000s (Gen Z/Alpha) group, representing 50% of guests.
Recommendations for Hosts
- Target domestic marketing efforts towards travelers from Paris and Montreal.
- Tailor amenities and listing descriptions to appeal to the dominant Post-2000s (Gen Z/Alpha) demographic (e.g., highlight fast WiFi, smart home features, local guides).
- Highlight unique local experiences or amenities relevant to the primary guest profile.
- Consider seasonal promotions aligned with peak travel times for key origin markets.
Nearby Short-Term Rental Market Comparison
How does the Baie-Mahault Airbnb market stack up against its neighbors? Compare key performance metrics like average monthly revenue, ADR, and occupancy rates in surrounding areas to understand the broader regional STR landscape.
| Market | Active Properties | Monthly Revenue | Daily Rate | Avg. Occupancy |
|---|---|---|---|---|
| Saint Barthélemy | 554 | $5,892 | $1034.64 | 37% |
| Fleming Estate | 15 | $5,884 | $572.58 | 46% |
| Bolans | 81 | $3,659 | $526.19 | 36% |
| Crosbies | 17 | $3,348 | $520.95 | 40% |
| Christian Hill | 13 | $2,641 | $479.55 | 35% |
| Cotton Ground | 34 | $2,575 | $384.15 | 32% |
| The Valley | 37 | $2,538 | $505.36 | 35% |
| English Harbour | 134 | $2,498 | $443.95 | 34% |
| Blue Waters | 35 | $2,467 | $220.39 | 46% |
| Saint John | 21 | $2,421 | $225.35 | 42% |