Vittel Airbnb Market Analysis 2026: Short Term Rental Data & Vacation Rental Statistics in Grand Est, France
Is Airbnb profitable in Vittel in 2026? Explore comprehensive Airbnb analytics for Vittel, Grand Est, France to uncover income potential. This 2026 STR market report for Vittel, based on AirROI data from February 2025 to January 2026, reveals key trends in the niche market of 116 active listings.
Whether you're considering an Airbnb investment in Vittel, optimizing your existing vacation rental, or exploring rental arbitrage opportunities, understanding the Vittel Airbnb data is crucial. Understanding the local regulations is key to maximizing your short term rental income potential. Let's dive into the specifics.
Key Vittel Airbnb Performance Metrics Overview
Monthly Airbnb Revenue Variations & Income Potential in Vittel (2026)
Understanding the monthly revenue variations for Airbnb listings in Vittel is key to maximizing your short term rental income potential. Seasonality significantly impacts earnings. Our analysis, based on data from the past 12 months, shows that the peak revenue month for STRs in Vittel is typically August, while January often presents the lowest earnings, highlighting opportunities for strategic pricing adjustments during shoulder and low seasons. Explore the typical Airbnb income in Vittel across different performance tiers:
- Best-in-class properties (Top 10%) achieve $1,915+ monthly, often utilizing dynamic pricing and superior guest experiences.
- Strong performing properties (Top 25%) earn $1,332 or more, indicating effective management and desirable locations/amenities.
- Typical properties (Median) generate around $846 per month, representing the average market performance.
- Entry-level properties (Bottom 25%) see earnings around $395, often with potential for optimization.
Average Monthly Airbnb Earnings Trend in Vittel
Vittel Airbnb Occupancy Rate Trends (2026)
Maximize your bookings by understanding the Vittel STR occupancy trends. Seasonal demand shifts significantly influence how often properties are booked. Typically, Augustsees the highest demand (peak season occupancy), while January experiences the lowest (low season). Effective strategies, like adjusting minimum stays or offering promotions, can boost occupancy during slower periods. Here's how different property tiers perform in Vittel:
- Best-in-class properties (Top 10%) achieve 76%+ occupancy, indicating high desirability and potentially optimized availability.
- Strong performing properties (Top 25%) maintain 60% or higher occupancy, suggesting good market fit and guest satisfaction.
- Typical properties (Median) have an occupancy rate around 38%.
- Entry-level properties (Bottom 25%) average 19% occupancy, potentially facing higher vacancy.
Average Monthly Occupancy Rate Trend in Vittel
Average Daily Rate (ADR) Airbnb Trends in Vittel (2026)
Effective short term rental pricing strategy in Vittel involves understanding monthly ADR fluctuations. The Average Daily Rate (ADR) for Airbnb in Vittel typically peaks in October and dips lowest during February. Leveraging Airbnb dynamic pricing tools or strategies based on this seasonality can significantly boost revenue. Here's a look at the typical nightly rates achieved:
- Best-in-class properties (Top 10%) command rates of $115+ per night, often due to premium features or locations.
- Strong performing properties (Top 25%) achieve nightly rates of $90 or more.
- Typical properties (Median) charge around $68 per night.
- Entry-level properties (Bottom 25%) earn around $54 per night.
Average Daily Rate (ADR) Trend by Month in Vittel
Get Live Vittel Market Intelligence 👇

Explore Real-time Analytics
Airbnb Seasonality Analysis & Trends in Vittel (2026)
Peak Season (August, July, June)
- Revenue averages $1,370 per month
- Occupancy rates average 50.9%
- Daily rates average $83
Shoulder Season
- Revenue averages $1,025 per month
- Occupancy maintains around 42.8%
- Daily rates hold near $84
Low Season (January, February, March)
- Revenue drops to average $521 per month
- Occupancy decreases to average 25.3%
- Daily rates adjust to average $79
Seasonality Insights for Vittel
- The Airbnb seasonality in Vittel shows highly seasonal trends requiring careful strategy. While the sections above show seasonal averages, it's also insightful to look at the extremes:
- During the high season, the absolute peak month showcases Vittel's highest earning potential, with monthly revenues capable of climbing to $1,404, occupancy reaching a high of 52.0%, and ADRs peaking at $88.
- Conversely, the slowest single month of the year, typically falling within the low season, marks the market's lowest point. In this month, revenue might dip to $397, occupancy could drop to 15.6%, and ADRs may adjust down to $76.
- Understanding both the seasonal averages and these monthly peaks and troughs in revenue, occupancy, and ADR is crucial for maximizing your Airbnb profit potential in Vittel.
Seasonal Strategies for Maximizing Profit
- Peak Season: Maximize revenue through premium pricing and potentially longer minimum stays. Ensure high availability.
- Low Season: Offer competitive pricing, special promotions (e.g., extended stay discounts), and flexible cancellation policies. Target off-season travelers like remote workers or budget-conscious guests.
- Shoulder Seasons: Implement dynamic pricing that balances peak and low rates. Target weekend travelers or specific events. Offer slightly more flexible terms than peak season.
- Regularly analyze your own performance against these Vittel seasonality benchmarks and adjust your pricing and availability strategy accordingly.
Best Areas for Airbnb Investment in Vittel (2026)
Exploring the top neighborhoods for short-term rentals in Vittel? This section highlights key areas, outlining why they are attractive for hosts and guests, along with notable local attractions. Consider these locations based on your target guest profile and investment strategy.
| Neighborhood / Area | Why Host Here? (Target Guests & Appeal) | Key Attractions & Landmarks |
|---|---|---|
| Thermal Area | Known for its historic thermal baths and spa facilities, this area attracts wellness tourists and those seeking relaxation. It's popular for weekend getaways and health retreats. | Vittel Thermal Baths, Vittel Golf Course, Parc Thermal, Casino Vittel, Lac de la Folie |
| Vittel City Center | The city center offers access to local shops, cafes, and restaurants. It's convenient for guests who want to explore the local culture and community. | Place Charles de Gaulle, Local boutiques, Cafes and restaurants, Vittel Market |
| Parks and Nature Trails | Vittel is surrounded by beautiful natural scenery, ideal for outdoor enthusiasts. This area is great for families and nature lovers looking for leisurely activities. | Parc des Jardins et des Sources, Nature trails, Cycling routes, Lakes nearby |
| Vittel Golf | With one of the most renowned golf courses in the region, this area attracts golf enthusiasts year-round, especially during the warmer months. | Vittel Golf Club, Golf tournaments, Scenic views of the course |
| Historical District | Visitors can explore the rich history of Vittel, which adds cultural depth to their stay. This area has historical architecture and landmarks. | Église Saint-Remy, Vittel History Museum, Historic buildings |
| Family-Friendly Area | This part of Vittel includes amenities and attractions suitable for families, making it a good choice for those traveling with children. | Family-friendly parks, Playgrounds, Family-centered restaurants |
| Proximity to Major Transport Routes | Easy access to major roads and railways makes this area convenient for visitors traveling to and from Vittel. | Train station, Bus routes, Easy access to nearby cities |
| Events and Festivals Venues | Vittel hosts various events and festivals throughout the year, attracting visitors who want to experience local culture and celebrations. | Annual festivals, Concert venues, Cultural events |
Understanding Airbnb License Requirements & STR Laws in Vittel (2026)
With 15% of listings showing registration in 2026, understanding potential Airbnb license requirements is crucial in Vittel. Always verify the latest short term rental regulations and Airbnb license requirements directly with local government authorities for Vittel to ensure full compliance before hosting.
(Source: AirROI data, 2026, based on 15% licensed listings)
Top Performing Airbnb Properties in Vittel (2026)
Benchmark your potential! Explore examples of top-performing Airbnb properties in Vittelbased on Trailing Twelve Month (TTM) revenue. Analyze their characteristics, revenue, occupancy rate, and ADR to understand what drives success in this market.
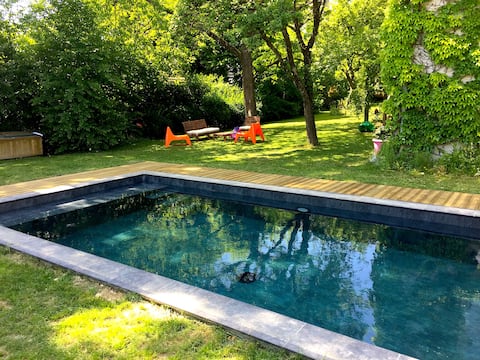
La Sapinière de Vittel, Villa with pool
Entire Place • 4 bedrooms
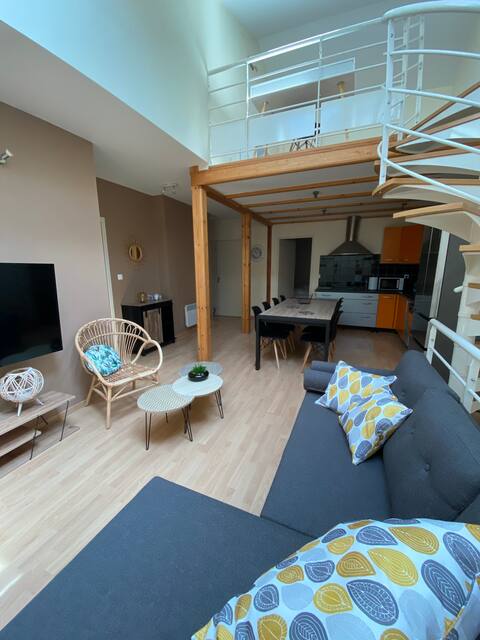
Beautiful apartment in the heart of Vittel
Entire Place • 4 bedrooms
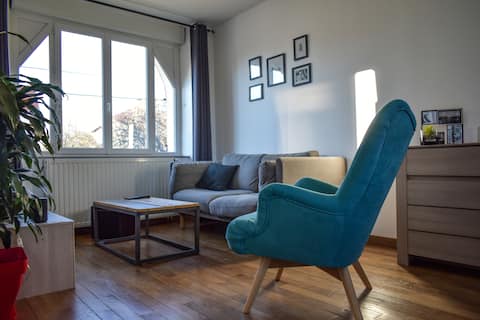
Quiet house a 5-minute walk to the Thermal Park.
Entire Place • 2 bedrooms

Garden Terrace Apartment
Entire Place • 3 bedrooms

Zen attitude
Entire Place • 3 bedrooms

The heart of the water
Entire Place • 3 bedrooms
Note: Performance varies based on location, size, amenities, seasonality, and management quality. Data reflects the past 12 months.
Top Performing Airbnb Hosts in Vittel (2026)
Learn from the best! This table showcases top-performing Airbnb hosts in Vittel based on the number of properties managed and estimated total revenue over the past year. Analyze their scale and performance metrics.
| Host Name | Properties | Grossing Revenue | Stay Reviews | Avg Rating |
|---|---|---|---|---|
| Quentin | 15 | $115,395 | 303 | 4.87/5.0 |
| Mathieu Pierre Henri | 5 | $58,950 | 10 | 4.54/5.0 |
| Aurelien | 2 | $45,749 | 103 | 4.93/5.0 |
| Antonio | 6 | $43,282 | 196 | 4.76/5.0 |
| Stéphane | 5 | $31,659 | 70 | 4.91/5.0 |
| Johann | 2 | $31,265 | 174 | 4.84/5.0 |
| Nicolas | 1 | $29,644 | 4 | 4.75/5.0 |
| Manon | 2 | $23,177 | 36 | 4.91/5.0 |
| Alexandre | 1 | $23,045 | 76 | 4.96/5.0 |
| Isabelle | 2 | $21,806 | 137 | 4.86/5.0 |
Analyzing the strategies of top hosts, such as their property selection, pricing, and guest communication, can offer valuable lessons for optimizing your own Airbnb operations in Vittel.
Dive Deeper: Advanced Vittel STR Market Data (2026)
Ready to unlock more insights? AirROI provides access to advanced metrics and comprehensive Airbnb data for Vittel. Explore detailed analytics beyond this report to refine your investment strategy, optimize pricing, and maximize your vacation rental profits.
Explore Advanced MetricsVittel Short-Term Rental Market Composition (2026): Property & Room Types
Room Type Distribution
Property Type Distribution
Market Composition Insights for Vittel
- The Vittel Airbnb market composition is heavily skewed towards Entire Home/Apt listings, which make up 100% of the 116 active rentals. This indicates strong guest preference for privacy and space.
- Looking at the property type distribution in Vittel, Apartment/Condo properties are the most common (81%), reflecting the local real estate landscape.
- Smaller segments like outdoor/unique, unique stays, hotel/boutique (combined 4.3%) offer potential for unique stay experiences.
Vittel Airbnb Room Capacity Analysis (2026): Bedroom Distribution
Distribution of Listings by Number of Bedrooms
Room Capacity Insights for Vittel
- The dominant room capacity in Vittel is 1 bedroom listings, making up 65.5% of the market. This suggests a strong demand for properties suitable for couples or solo travelers.
- Together, 1 bedroom and 2 bedrooms properties represent 81.9% of the active Airbnb listings in Vittel, indicating a high concentration in these sizes.
- With over half the market (65.5%) consisting of studios or 1-bedroom units, Vittel is particularly well-suited for individuals or couples.
- Listings with 3+ bedrooms (8.6%) represent a smaller niche, potentially indicating an underserved market for larger group accommodations in Vittel.
Vittel Vacation Rental Guest Capacity Trends (2026)
Distribution of Listings by Guest Capacity
Guest Capacity Insights for Vittel
- The most common guest capacity trend in Vittel vacation rentals is listings accommodating 2 guests (51.7%). This suggests the primary traveler segment is likely couples or solo travelers.
- Properties designed for 2 guests and 4 guests dominate the Vittel STR market, accounting for 81.9% of listings.
- A significant 53.4% of listings cater specifically to 1-2 guests, highlighting strong demand from couples and solo travelers in Vittel.
- 12.9% of properties accommodate 6+ guests, serving the market segment for larger families or group travel in Vittel.
- On average, properties in Vittel are equipped to host 3.2 guests.
Vittel Airbnb Booking Patterns (2026): Available vs. Booked Days
Available Days Distribution
Booked Days Distribution
Booking Pattern Insights for Vittel
- The most common availability pattern in Vittel falls within the 271-366 days range, representing 55.2% of listings. This suggests many properties have significant open periods on their calendars.
- Approximately 89.7% of listings show high availability (181+ days open annually), indicating potential for increased bookings or specific owner usage patterns.
- For booked days, the 91-180 days range is most frequent in Vittel (35.3%), reflecting common guest stay durations or potential owner blocking patterns.
- A notable 10.3% of properties secure long booking periods (181+ days booked per year), highlighting successful long-term rental strategies or significant owner usage.
Vittel Airbnb Minimum Stay Requirements Analysis
Distribution of Listings by Minimum Night Requirement
1 Night
19 listings
16.4% of total
2 Nights
42 listings
36.2% of total
3 Nights
7 listings
6% of total
4-6 Nights
10 listings
8.6% of total
7-29 Nights
1 listings
0.9% of total
30+ Nights
37 listings
31.9% of total
Key Insights
- The most prevalent minimum stay requirement in Vittel is 2 Nights, adopted by 36.2% of listings. This highlights the market's preference for shorter, flexible bookings.
- A significant segment (31.9%) caters to monthly stays (30+ nights) in Vittel, pointing to opportunities in the extended-stay market.
Recommendations
- Align with the market by considering a 2 Nights minimum stay, as 36.2% of Vittel hosts use this setting.
- If feasible, allowing 1-night stays, especially midweek or during low season, could capture last-minute bookings, as only 16.4% currently do.
- A 2-night minimum appears standard (36.2%). Consider this for weekends or peak periods.
- Explore offering discounts for stays of 30+ nights to attract the 31.9% of the market seeking extended stays.
- Adjust minimum nights based on seasonality – potentially shorter during low season and longer during peak demand periods in Vittel.
Vittel Airbnb Cancellation Policy Trends Analysis (2026)
Limited
4 listings
3.5% of total
Super Strict 60 Days
2 listings
1.7% of total
Flexible
31 listings
27% of total
Moderate
39 listings
33.9% of total
Firm
32 listings
27.8% of total
Strict
7 listings
6.1% of total
Cancellation Policy Insights for Vittel
- The prevailing Airbnb cancellation policy trend in Vittel is Moderate, used by 33.9% of listings.
- There's a relatively balanced mix between guest-friendly (60.9%) and stricter (33.9%) policies, offering choices for different guest needs.
- Strict cancellation policies are quite rare (6.1%), potentially making listings with this policy less competitive unless justified by high demand or property type.
Recommendations for Hosts
- Consider adopting a Moderate policy to align with the 33.9% market standard in Vittel.
- Using a Strict policy might deter some guests, as only 6.1% of listings use it. Evaluate if potential revenue protection outweighs possible lower booking rates.
- Regularly review your cancellation policy against competitors and market demand shifts in Vittel.
Vittel STR Booking Lead Time Analysis (2026)
Average Booking Lead Time by Month
Booking Lead Time Insights for Vittel
- The overall average booking lead time for vacation rentals in Vittel is 61 days.
- Guests book furthest in advance for stays during September (average 114 days), likely coinciding with peak travel demand or local events.
- The shortest booking windows occur for stays in February (average 18 days), indicating more last-minute travel plans during this time.
- Seasonally, Fall (78 days avg.) sees the longest lead times, while Winter (25 days avg.) has the shortest, reflecting typical travel planning cycles.
Recommendations for Hosts
- Use the overall average lead time (61 days) as a baseline for your pricing and availability strategy in Vittel.
- For September stays, consider implementing length-of-stay discounts or slightly higher rates for bookings made less than 114 days out to capitalize on advance planning.
- Target marketing efforts for the Fall season well in advance (at least 78 days) to capture early planners.
- Monitor your own booking lead times against these Vittel averages to identify opportunities for dynamic pricing adjustments.
Popular & Essential Airbnb Amenities in Vittel (2026)
Amenity Prevalence
Amenity Insights for Vittel
- Popular amenities like TV, Kitchen, Wifi are common but not universal. Offering these can provide a competitive edge.
- Warning: Wifi is not universally provided but is considered essential globally. Ensure reliable Wifi is offered.
Recommendations for Hosts
- Consider adding popular differentiators like TV or Kitchen to increase appeal.
- Highlight unique or less common amenities you offer (e.g., hot tub, dedicated workspace, EV charger) in your listing description and photos.
- Regularly check competitor amenities in Vittel to stay competitive.
Vittel Airbnb Guest Demographics & Profile Analysis (2026)
Guest Profile Summary for Vittel
- The typical guest profile for Airbnb in Vittel consists of primarily domestic travelers (89%), often arriving from nearby Paris, typically belonging to the Post-2000s (Gen Z/Alpha) group (50%), primarily speaking French or English.
- Domestic travelers account for 89.0% of guests.
- Key international markets include France (89%) and Belgium (2.8%).
- Top languages spoken are French (47.9%) followed by English (30.4%).
- A significant demographic segment is the Post-2000s (Gen Z/Alpha) group, representing 50% of guests.
Recommendations for Hosts
- Target domestic marketing efforts towards travelers from Paris and Dijon.
- Tailor amenities and listing descriptions to appeal to the dominant Post-2000s (Gen Z/Alpha) demographic (e.g., highlight fast WiFi, smart home features, local guides).
- Highlight unique local experiences or amenities relevant to the primary guest profile.
- Consider seasonal promotions aligned with peak travel times for key origin markets.
Nearby Short-Term Rental Market Comparison
How does the Vittel Airbnb market stack up against its neighbors? Compare key performance metrics like average monthly revenue, ADR, and occupancy rates in surrounding areas to understand the broader regional STR landscape.
| Market | Active Properties | Monthly Revenue | Daily Rate | Avg. Occupancy |
|---|---|---|---|---|
| Momignies | 12 | $3,451 | $311.61 | 42% |
| Chiny | 21 | $3,403 | $261.76 | 40% |
| Bazeilles | 12 | $3,346 | $184.54 | 45% |
| La Forge | 13 | $3,208 | $339.73 | 41% |
| Tintigny | 12 | $3,162 | $243.75 | 39% |
| Ventron | 84 | $3,064 | $290.20 | 38% |
| Léglise | 21 | $2,977 | $268.63 | 40% |
| Liézey | 24 | $2,977 | $303.41 | 35% |
| Bairon et ses environs | 12 | $2,687 | $226.33 | 29% |
| Saint-Romain | 17 | $2,647 | $326.60 | 36% |