Molsheim Airbnb Market Analysis 2026: Short Term Rental Data & Vacation Rental Statistics in Grand Est, France
Is Airbnb profitable in Molsheim in 2026? Explore comprehensive Airbnb analytics for Molsheim, Grand Est, France to uncover income potential. This 2026 STR market report for Molsheim, based on AirROI data from February 2025 to January 2026, reveals key trends in the niche market of 31 active listings.
Whether you're considering an Airbnb investment in Molsheim, optimizing your existing vacation rental, or exploring rental arbitrage opportunities, understanding the Molsheim Airbnb data is crucial. Leveraging the low regulation environment is key to maximizing your short term rental income potential. Let's dive into the specifics.
Key Molsheim Airbnb Performance Metrics Overview
Monthly Airbnb Revenue Variations & Income Potential in Molsheim (2026)
Understanding the monthly revenue variations for Airbnb listings in Molsheim is key to maximizing your short term rental income potential. Seasonality significantly impacts earnings. Our analysis, based on data from the past 12 months, shows that the peak revenue month for STRs in Molsheim is typically December, while February often presents the lowest earnings, highlighting opportunities for strategic pricing adjustments during shoulder and low seasons. Explore the typical Airbnb income in Molsheim across different performance tiers:
- Best-in-class properties (Top 10%) achieve $3,114+ monthly, often utilizing dynamic pricing and superior guest experiences.
- Strong performing properties (Top 25%) earn $2,076 or more, indicating effective management and desirable locations/amenities.
- Typical properties (Median) generate around $1,349 per month, representing the average market performance.
- Entry-level properties (Bottom 25%) see earnings around $747, often with potential for optimization.
Average Monthly Airbnb Earnings Trend in Molsheim
Molsheim Airbnb Occupancy Rate Trends (2026)
Maximize your bookings by understanding the Molsheim STR occupancy trends. Seasonal demand shifts significantly influence how often properties are booked. Typically, Decembersees the highest demand (peak season occupancy), while January experiences the lowest (low season). Effective strategies, like adjusting minimum stays or offering promotions, can boost occupancy during slower periods. Here's how different property tiers perform in Molsheim:
- Best-in-class properties (Top 10%) achieve 79%+ occupancy, indicating high desirability and potentially optimized availability.
- Strong performing properties (Top 25%) maintain 67% or higher occupancy, suggesting good market fit and guest satisfaction.
- Typical properties (Median) have an occupancy rate around 48%.
- Entry-level properties (Bottom 25%) average 31% occupancy, potentially facing higher vacancy.
Average Monthly Occupancy Rate Trend in Molsheim
Average Daily Rate (ADR) Airbnb Trends in Molsheim (2026)
Effective short term rental pricing strategy in Molsheim involves understanding monthly ADR fluctuations. The Average Daily Rate (ADR) for Airbnb in Molsheim typically peaks in December and dips lowest during March. Leveraging Airbnb dynamic pricing tools or strategies based on this seasonality can significantly boost revenue. Here's a look at the typical nightly rates achieved:
- Best-in-class properties (Top 10%) command rates of $169+ per night, often due to premium features or locations.
- Strong performing properties (Top 25%) achieve nightly rates of $122 or more.
- Typical properties (Median) charge around $87 per night.
- Entry-level properties (Bottom 25%) earn around $70 per night.
Average Daily Rate (ADR) Trend by Month in Molsheim
Get Live Molsheim Market Intelligence 👇

Explore Real-time Analytics
Airbnb Seasonality Analysis & Trends in Molsheim (2026)
Peak Season (December, August, July)
- Revenue averages $2,374 per month
- Occupancy rates average 61.0%
- Daily rates average $117
Shoulder Season
- Revenue averages $1,516 per month
- Occupancy maintains around 49.5%
- Daily rates hold near $100
Low Season (January, February, March)
- Revenue drops to average $906 per month
- Occupancy decreases to average 32.8%
- Daily rates adjust to average $94
Seasonality Insights for Molsheim
- The Airbnb seasonality in Molsheim shows highly seasonal trends requiring careful strategy. While the sections above show seasonal averages, it's also insightful to look at the extremes:
- During the high season, the absolute peak month showcases Molsheim's highest earning potential, with monthly revenues capable of climbing to $2,941, occupancy reaching a high of 70.9%, and ADRs peaking at $139.
- Conversely, the slowest single month of the year, typically falling within the low season, marks the market's lowest point. In this month, revenue might dip to $668, occupancy could drop to 26.8%, and ADRs may adjust down to $88.
- Understanding both the seasonal averages and these monthly peaks and troughs in revenue, occupancy, and ADR is crucial for maximizing your Airbnb profit potential in Molsheim.
Seasonal Strategies for Maximizing Profit
- Peak Season: Maximize revenue through premium pricing and potentially longer minimum stays. Ensure high availability.
- Low Season: Offer competitive pricing, special promotions (e.g., extended stay discounts), and flexible cancellation policies. Target off-season travelers like remote workers or budget-conscious guests.
- Shoulder Seasons: Implement dynamic pricing that balances peak and low rates. Target weekend travelers or specific events. Offer slightly more flexible terms than peak season.
- Regularly analyze your own performance against these Molsheim seasonality benchmarks and adjust your pricing and availability strategy accordingly.
Best Areas for Airbnb Investment in Molsheim (2026)
Exploring the top neighborhoods for short-term rentals in Molsheim? This section highlights key areas, outlining why they are attractive for hosts and guests, along with notable local attractions. Consider these locations based on your target guest profile and investment strategy.
| Neighborhood / Area | Why Host Here? (Target Guests & Appeal) | Key Attractions & Landmarks |
|---|---|---|
| Molsheim Center | The charming center of Molsheim is known for its historic architecture and vibrant local markets. It's a prime location for guests wanting the quintessential Alsace experience, close to shops, eateries, and cultural landmarks. | Historic Molsheim Church, Place de la République, Musée de la Chartreuse, Local food markets, Wine tasting venues |
| Wine Route of Alsace | Molsheim is a convenient base for exploring the famous Alsace Wine Route. Tourists flock here for vineyard tours and wine tastings, making it a great spot for wine lovers. | Alsace Wine Route, Local vineyards, Durbach, Wine tasting events, Scenic countryside |
| Zinti's Garden | A beautifully designed public garden in Molsheim that attracts visitors for relaxation and picnics. Its tranquil atmosphere makes it an appealing location for families and couples. | Zinti's Garden, Walking trails, Scenic ponds, Picnic areas, Flower displays |
| Cultural Hotspot | This area features numerous cultural and historical attractions, drawing tourists interested in Alsace's rich heritage and arts scene. | Molsheim Museum, Historic buildings, Local art galleries, Annual cultural festivals, Concerts |
| Eckbolsheim | A nearby suburb that offers easy access to Molsheim and is appealing for guests looking for a quieter stay while still being close to town attractions. | Local parks, Family-friendly neighborhoods, Nice restaurants nearby, Nature walks, Historical sites |
| Nearby Strasbourg | Just a short trip from Molsheim, Strasbourg is a major tourist destination. Guests can take day trips to enjoy its many sights while staying in Molsheim. | Strasbourg Cathedral, La Petite France, European Parliament, Museums, Boat tours |
| Local Cuisine | Molsheim is known for its unique local cuisine and eateries. Food enthusiasts will love staying close to various traditional Alsace dining options. | Traditional Alsace restaurants, Local cafes, Bakeries, Food festivals, Culinary workshops |
| Nature Trails | Surrounding Molsheim are beautiful nature trails perfect for hiking and enjoying the Alsace natural beauty. Ideal for outdoor enthusiasts. | Hiking trails, Biking routes, Natural parks, Bird watching spots, Picnic areas |
Understanding Airbnb License Requirements & STR Laws in Molsheim (2026)
While Molsheim, Grand Est, France currently shows low STR regulations, specific Airbnb license requirements might still exist or change. Always verify the latest short term rental regulations and Airbnb license requirements directly with local government authorities for Molsheim to ensure full compliance before hosting.
(Source: AirROI data, 2026, based on 10% licensed listings)
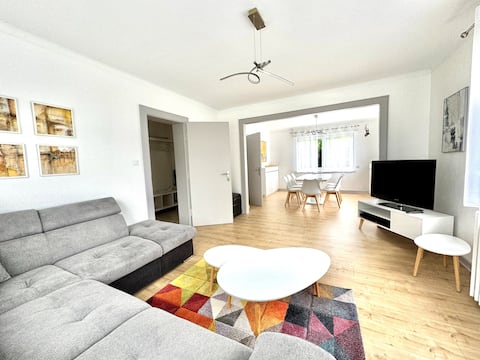
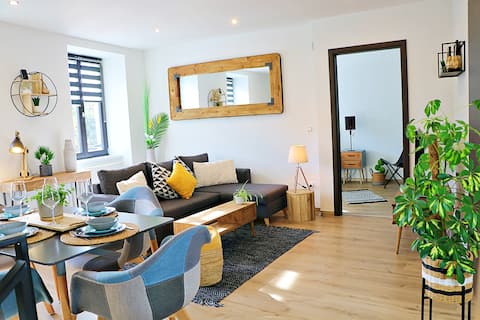
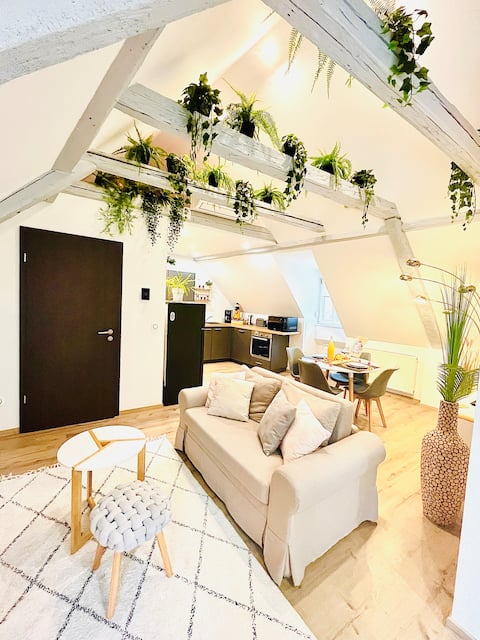
Top Performing Airbnb Properties in Molsheim (2026)
Benchmark your potential! Explore examples of top-performing Airbnb properties in Molsheimbased on Trailing Twelve Month (TTM) revenue. Analyze their characteristics, revenue, occupancy rate, and ADR to understand what drives success in this market.

Family villa in the vineyards
Entire Place • 5 bedrooms
Charming house in Molsheim
Entire Place • 4 bedrooms
Duplex 110 m² downtown, air conditioning and private parking
Entire Place • 2 bedrooms

Modern apartment in Molsheim, large terrace
Entire Place • 2 bedrooms

Modern apartment in the city center
Entire Place • 2 bedrooms
La Pause Gourmande, charm and comfort, air conditioning, center
Entire Place • 1 bedroom
Note: Performance varies based on location, size, amenities, seasonality, and management quality. Data reflects the past 12 months.
Top Performing Airbnb Hosts in Molsheim (2026)
Learn from the best! This table showcases top-performing Airbnb hosts in Molsheim based on the number of properties managed and estimated total revenue over the past year. Analyze their scale and performance metrics.
| Host Name | Properties | Grossing Revenue | Stay Reviews | Avg Rating |
|---|---|---|---|---|
| Laetitia, Florent | 2 | $58,562 | 538 | 4.97/5.0 |
| Janina | 1 | $48,516 | 31 | 5.00/5.0 |
| Conciergerie R�êve D'Arrivée | 1 | $38,359 | 26 | 4.88/5.0 |
| Isabelle, Christian Et Gérard | 2 | $37,107 | 136 | 4.98/5.0 |
| Andre Et Martine | 2 | $34,861 | 134 | 4.90/5.0 |
| Angela | 2 | $30,811 | 519 | 4.81/5.0 |
| Maelyss | 1 | $27,974 | 101 | 4.75/5.0 |
| Vanessa | 1 | $26,058 | 251 | 4.89/5.0 |
| Sophie | 3 | $22,671 | 127 | 4.92/5.0 |
| Thomas | 1 | $20,799 | 55 | 4.98/5.0 |
Analyzing the strategies of top hosts, such as their property selection, pricing, and guest communication, can offer valuable lessons for optimizing your own Airbnb operations in Molsheim.
Dive Deeper: Advanced Molsheim STR Market Data (2026)
Ready to unlock more insights? AirROI provides access to advanced metrics and comprehensive Airbnb data for Molsheim. Explore detailed analytics beyond this report to refine your investment strategy, optimize pricing, and maximize your vacation rental profits.
Explore Advanced MetricsMolsheim Short-Term Rental Market Composition (2026): Property & Room Types
Room Type Distribution
Property Type Distribution
Market Composition Insights for Molsheim
- The Molsheim Airbnb market composition is heavily skewed towards Entire Home/Apt listings, which make up 77.4% of the 31 active rentals. This indicates strong guest preference for privacy and space.
- Looking at the property type distribution in Molsheim, Apartment/Condo properties are the most common (74.2%), reflecting the local real estate landscape.
- Houses represent a significant 22.6% portion, catering likely to families or larger groups.
- Smaller segments like outdoor/unique (combined 3.2%) offer potential for unique stay experiences.
Molsheim Airbnb Room Capacity Analysis (2026): Bedroom Distribution
Distribution of Listings by Number of Bedrooms
Room Capacity Insights for Molsheim
- The dominant room capacity in Molsheim is 1 bedroom listings, making up 38.7% of the market. This suggests a strong demand for properties suitable for couples or solo travelers.
- Together, 1 bedroom and 2 bedrooms properties represent 64.5% of the active Airbnb listings in Molsheim, indicating a high concentration in these sizes.
Molsheim Vacation Rental Guest Capacity Trends (2026)
Distribution of Listings by Guest Capacity
Guest Capacity Insights for Molsheim
- The most common guest capacity trend in Molsheim vacation rentals is listings accommodating 4 guests (32.3%). This suggests the primary traveler segment is likely small families or groups.
- Properties designed for 4 guests and 6 guests dominate the Molsheim STR market, accounting for 51.7% of listings.
- 25.9% of properties accommodate 6+ guests, serving the market segment for larger families or group travel in Molsheim.
- On average, properties in Molsheim are equipped to host 3.4 guests.
Molsheim Airbnb Booking Patterns (2026): Available vs. Booked Days
Available Days Distribution
Booked Days Distribution
Booking Pattern Insights for Molsheim
- The most common availability pattern in Molsheim falls within the 91-180 days range, representing 45.2% of listings. This suggests many properties have significant open periods on their calendars.
- Approximately 54.8% of listings show high availability (181+ days open annually), indicating potential for increased bookings or specific owner usage patterns.
- For booked days, the 181-270 days range is most frequent in Molsheim (45.2%), reflecting common guest stay durations or potential owner blocking patterns.
- A notable 45.2% of properties secure long booking periods (181+ days booked per year), highlighting successful long-term rental strategies or significant owner usage.
Molsheim Airbnb Minimum Stay Requirements Analysis
Distribution of Listings by Minimum Night Requirement
1 Night
11 listings
35.5% of total
2 Nights
9 listings
29% of total
3 Nights
3 listings
9.7% of total
4-6 Nights
1 listings
3.2% of total
7-29 Nights
1 listings
3.2% of total
30+ Nights
6 listings
19.4% of total
Key Insights
- The most prevalent minimum stay requirement in Molsheim is 1 Night, adopted by 35.5% of listings. This highlights the market's preference for shorter, flexible bookings.
- A strong majority (64.5%) of the Molsheim Airbnb data shows acceptance of very short stays (1-2 nights), indicating a dynamic, high-turnover market.
- A significant segment (19.4%) caters to monthly stays (30+ nights) in Molsheim, pointing to opportunities in the extended-stay market.
Recommendations
- Align with the market by considering a 1 Night minimum stay, as 35.5% of Molsheim hosts use this setting.
- Explore offering discounts for stays of 30+ nights to attract the 19.4% of the market seeking extended stays.
- Adjust minimum nights based on seasonality – potentially shorter during low season and longer during peak demand periods in Molsheim.
Molsheim Airbnb Cancellation Policy Trends Analysis (2026)
Super Strict 60 Days
1 listings
3.2% of total
Flexible
11 listings
35.5% of total
Moderate
11 listings
35.5% of total
Firm
5 listings
16.1% of total
Strict
3 listings
9.7% of total
Cancellation Policy Insights for Molsheim
- The prevailing Airbnb cancellation policy trend in Molsheim is Flexible, used by 35.5% of listings.
- The market strongly favors guest-friendly terms, with 71.0% of listings offering Flexible or Moderate policies. This suggests guests in Molsheim may expect booking flexibility.
- Strict cancellation policies are quite rare (9.7%), potentially making listings with this policy less competitive unless justified by high demand or property type.
Recommendations for Hosts
- Consider adopting a Flexible policy to align with the 35.5% market standard in Molsheim.
- Using a Strict policy might deter some guests, as only 9.7% of listings use it. Evaluate if potential revenue protection outweighs possible lower booking rates.
- Regularly review your cancellation policy against competitors and market demand shifts in Molsheim.
Molsheim STR Booking Lead Time Analysis (2026)
Average Booking Lead Time by Month
Booking Lead Time Insights for Molsheim
- The overall average booking lead time for vacation rentals in Molsheim is 47 days.
- Guests book furthest in advance for stays during May (average 77 days), likely coinciding with peak travel demand or local events.
- The shortest booking windows occur for stays in February (average 20 days), indicating more last-minute travel plans during this time.
- Seasonally, Summer (54 days avg.) sees the longest lead times, while Fall (41 days avg.) has the shortest, reflecting typical travel planning cycles.
Recommendations for Hosts
- Use the overall average lead time (47 days) as a baseline for your pricing and availability strategy in Molsheim.
- For May stays, consider implementing length-of-stay discounts or slightly higher rates for bookings made less than 77 days out to capitalize on advance planning.
- Target marketing efforts for the Summer season well in advance (at least 54 days) to capture early planners.
- Monitor your own booking lead times against these Molsheim averages to identify opportunities for dynamic pricing adjustments.
Popular & Essential Airbnb Amenities in Molsheim (2026)
Amenity Prevalence
Amenity Insights for Molsheim
- Essential amenities in Molsheim that guests expect include: Heating, Wifi. Lacking these (any) could significantly impact bookings.
- Popular amenities like Hangers, Kitchen, Hot water are common but not universal. Offering these can provide a competitive edge.
Recommendations for Hosts
- Ensure your listing includes all essential amenities for Molsheim: Heating, Wifi.
- Prioritize adding missing essentials: Wifi.
- Consider adding popular differentiators like Hangers or Kitchen to increase appeal.
- Highlight unique or less common amenities you offer (e.g., hot tub, dedicated workspace, EV charger) in your listing description and photos.
- Regularly check competitor amenities in Molsheim to stay competitive.
Molsheim Airbnb Guest Demographics & Profile Analysis (2026)
Guest Profile Summary for Molsheim
- The typical guest profile for Airbnb in Molsheim consists of a mix of domestic (61%) and international guests, often arriving from nearby Nancy, typically belonging to the Post-2000s (Gen Z/Alpha) group (50%), primarily speaking French or English.
- Domestic travelers account for 61.3% of guests.
- Key international markets include France (61.3%) and Germany (16.3%).
- Top languages spoken are French (32.2%) followed by English (31.9%).
- A significant demographic segment is the Post-2000s (Gen Z/Alpha) group, representing 50% of guests.
Recommendations for Hosts
- Target domestic marketing efforts towards travelers from Nancy and Stuttgart.
- Tailor amenities and listing descriptions to appeal to the dominant Post-2000s (Gen Z/Alpha) demographic (e.g., highlight fast WiFi, smart home features, local guides).
- Highlight unique local experiences or amenities relevant to the primary guest profile.
- Consider seasonal promotions aligned with peak travel times for key origin markets.
Nearby Short-Term Rental Market Comparison
How does the Molsheim Airbnb market stack up against its neighbors? Compare key performance metrics like average monthly revenue, ADR, and occupancy rates in surrounding areas to understand the broader regional STR landscape.
| Market | Active Properties | Monthly Revenue | Daily Rate | Avg. Occupancy |
|---|---|---|---|---|
| Ittenheim | 20 | $6,532 | $404.34 | 42% |
| Furdenheim | 14 | $6,054 | $470.22 | 50% |
| Bassersdorf | 16 | $5,337 | $431.59 | 46% |
| Vitznau | 31 | $4,688 | $425.43 | 45% |
| Lucerne | 329 | $4,288 | $310.00 | 53% |
| Le Valtin | 13 | $4,103 | $375.72 | 47% |
| La Forge | 13 | $3,208 | $339.73 | 41% |
| Weggis | 56 | $3,193 | $266.21 | 46% |
| Sattel | 12 | $3,099 | $222.58 | 56% |
| Griesheim-près-Molsheim | 18 | $3,082 | $284.57 | 39% |