Kaysersberg-Vignoble Airbnb Market Analysis 2026: Short Term Rental Data & Vacation Rental Statistics in Grand Est, France
Is Airbnb profitable in Kaysersberg-Vignoble in 2026? Explore comprehensive Airbnb analytics for Kaysersberg-Vignoble, Grand Est, France to uncover income potential. This 2026 STR market report for Kaysersberg-Vignoble, based on AirROI data from February 2025 to January 2026, reveals key trends in the niche market of 188 active listings.
Whether you're considering an Airbnb investment in Kaysersberg-Vignoble, optimizing your existing vacation rental, or exploring rental arbitrage opportunities, understanding the Kaysersberg-Vignoble Airbnb data is crucial. Navigating the high regulation landscape is key to maximizing your short term rental income potential. Let's dive into the specifics.
Key Kaysersberg-Vignoble Airbnb Performance Metrics Overview
Monthly Airbnb Revenue Variations & Income Potential in Kaysersberg-Vignoble (2026)
Understanding the monthly revenue variations for Airbnb listings in Kaysersberg-Vignoble is key to maximizing your short term rental income potential. Seasonality significantly impacts earnings. Our analysis, based on data from the past 12 months, shows that the peak revenue month for STRs in Kaysersberg-Vignoble is typically December, while February often presents the lowest earnings, highlighting opportunities for strategic pricing adjustments during shoulder and low seasons. Explore the typical Airbnb income in Kaysersberg-Vignoble across different performance tiers:
- Best-in-class properties (Top 10%) achieve $3,897+ monthly, often utilizing dynamic pricing and superior guest experiences.
- Strong performing properties (Top 25%) earn $2,732 or more, indicating effective management and desirable locations/amenities.
- Typical properties (Median) generate around $1,679 per month, representing the average market performance.
- Entry-level properties (Bottom 25%) see earnings around $932, often with potential for optimization.
Average Monthly Airbnb Earnings Trend in Kaysersberg-Vignoble
Kaysersberg-Vignoble Airbnb Occupancy Rate Trends (2026)
Maximize your bookings by understanding the Kaysersberg-Vignoble STR occupancy trends. Seasonal demand shifts significantly influence how often properties are booked. Typically, Decembersees the highest demand (peak season occupancy), while January experiences the lowest (low season). Effective strategies, like adjusting minimum stays or offering promotions, can boost occupancy during slower periods. Here's how different property tiers perform in Kaysersberg-Vignoble:
- Best-in-class properties (Top 10%) achieve 80%+ occupancy, indicating high desirability and potentially optimized availability.
- Strong performing properties (Top 25%) maintain 63% or higher occupancy, suggesting good market fit and guest satisfaction.
- Typical properties (Median) have an occupancy rate around 41%.
- Entry-level properties (Bottom 25%) average 22% occupancy, potentially facing higher vacancy.
Average Monthly Occupancy Rate Trend in Kaysersberg-Vignoble
Average Daily Rate (ADR) Airbnb Trends in Kaysersberg-Vignoble (2026)
Effective short term rental pricing strategy in Kaysersberg-Vignoble involves understanding monthly ADR fluctuations. The Average Daily Rate (ADR) for Airbnb in Kaysersberg-Vignoble typically peaks in December and dips lowest during March. Leveraging Airbnb dynamic pricing tools or strategies based on this seasonality can significantly boost revenue. Here's a look at the typical nightly rates achieved:
- Best-in-class properties (Top 10%) command rates of $264+ per night, often due to premium features or locations.
- Strong performing properties (Top 25%) achieve nightly rates of $177 or more.
- Typical properties (Median) charge around $121 per night.
- Entry-level properties (Bottom 25%) earn around $90 per night.
Average Daily Rate (ADR) Trend by Month in Kaysersberg-Vignoble
Get Live Kaysersberg-Vignoble Market Intelligence 👇

Explore Real-time Analytics
Airbnb Seasonality Analysis & Trends in Kaysersberg-Vignoble (2026)
Peak Season (December, August, July)
- Revenue averages $3,058 per month
- Occupancy rates average 56.8%
- Daily rates average $166
Shoulder Season
- Revenue averages $1,921 per month
- Occupancy maintains around 43.4%
- Daily rates hold near $145
Low Season (January, February, March)
- Revenue drops to average $1,178 per month
- Occupancy decreases to average 29.5%
- Daily rates adjust to average $137
Seasonality Insights for Kaysersberg-Vignoble
- The Airbnb seasonality in Kaysersberg-Vignoble shows highly seasonal trends requiring careful strategy. While the sections above show seasonal averages, it's also insightful to look at the extremes:
- During the high season, the absolute peak month showcases Kaysersberg-Vignoble's highest earning potential, with monthly revenues capable of climbing to $4,172, occupancy reaching a high of 63.1%, and ADRs peaking at $193.
- Conversely, the slowest single month of the year, typically falling within the low season, marks the market's lowest point. In this month, revenue might dip to $1,143, occupancy could drop to 23.9%, and ADRs may adjust down to $132.
- Understanding both the seasonal averages and these monthly peaks and troughs in revenue, occupancy, and ADR is crucial for maximizing your Airbnb profit potential in Kaysersberg-Vignoble.
Seasonal Strategies for Maximizing Profit
- Peak Season: Maximize revenue through premium pricing and potentially longer minimum stays. Ensure high availability.
- Low Season: Offer competitive pricing, special promotions (e.g., extended stay discounts), and flexible cancellation policies. Target off-season travelers like remote workers or budget-conscious guests.
- Shoulder Seasons: Implement dynamic pricing that balances peak and low rates. Target weekend travelers or specific events. Offer slightly more flexible terms than peak season.
- Regularly analyze your own performance against these Kaysersberg-Vignoble seasonality benchmarks and adjust your pricing and availability strategy accordingly.
Best Areas for Airbnb Investment in Kaysersberg-Vignoble (2026)
Exploring the top neighborhoods for short-term rentals in Kaysersberg-Vignoble? This section highlights key areas, outlining why they are attractive for hosts and guests, along with notable local attractions. Consider these locations based on your target guest profile and investment strategy.
| Neighborhood / Area | Why Host Here? (Target Guests & Appeal) | Key Attractions & Landmarks |
|---|---|---|
| Kaysersberg town center | The picturesque town center filled with charming half-timbered houses, shops, and cafes. Ideal for tourists wanting to experience the Alsatian culture and architecture firsthand. | Kaysersberg Castle, House of the Templars, St. Croix Church, Museum of the Sugar and Chocolate, Local wine shops, Scenic walking trails |
| Kaysersberg vineyards | Surrounded by beautiful vineyards, this area offers stunning views and wine tasting experiences. Attracts wine enthusiasts and nature lovers looking for a peaceful retreat. | Wine tasting tours, Vineyard hikes, Alsace Wine Route, Local gastronomy, Picturesque landscapes, Cycling routes |
| Riquewihr | A nearby UNESCO World Heritage site known for its medieval architecture and romantic ambiance. Great for tourists seeking a charming and historic atmosphere. | Dolder Tower, Riquewihr Historic Center, Wine tasting cellars, The 12th-century ramparts, Local artisan shops, Scenic viewpoints |
| Eguisheim | Known for its circular layout and colorful buildings, Eguisheim is a fairy-tale village that enchants visitors. Popular among couples and families alike. | Château d'Eguisheim, Local wine taverns, Flower gardens, Historic village square, Walking paths through vineyards, Culinary festivals |
| Turckheim | A tranquil village with a rich history and beautiful surroundings, perfect for those looking for a quiet stay away from the more touristy areas. | The 14th-century ramparts, Old town streets, Local bread and pastry shops, Nearby hiking trails, Historical museums, Scenic wine trails |
| Colmar | Only a short drive away, Colmar is renowned for its well-preserved old town and vibrant cultural scene. A must-visit for tourists exploring the region. | Little Venice, Colmar Unterlinden Museum, Saint-Martin Collegiate Church, Local markets, Traditional Alsatian restaurants, Art installations |
| Orbey | A gateway to hiking in the Vosges mountains, Orbey offers natural beauty and outdoor activities, attracting adventure seekers and nature lovers. | Hiking trails, Lac Blanc, Scenic viewpoints, Outdoor sports activities, Local farms, Traditional festivals |
| Lapoutroie | Known for its scenic beauty and as a point for exploring the Vosges mountains, Lapoutroie is perfect for nature getaways and tranquility. | Mountain trails, Local farms, Cultural heritage sites, Historic churches, Natural parks, Gastronomic experiences |
Understanding Airbnb License Requirements & STR Laws in Kaysersberg-Vignoble (2026)
Yes, Kaysersberg-Vignoble, Grand Est, France enforces high STR regulations. Obtaining a license and ensuring compliance is almost certainly required according to current 2026 STR laws. Always verify the latest short term rental regulations and Airbnb license requirements directly with local government authorities for Kaysersberg-Vignoble to ensure full compliance before hosting.
(Source: AirROI data, 2026, based on 89% licensed listings)
Top Performing Airbnb Properties in Kaysersberg-Vignoble (2026)
Benchmark your potential! Explore examples of top-performing Airbnb properties in Kaysersberg-Vignoblebased on Trailing Twelve Month (TTM) revenue. Analyze their characteristics, revenue, occupancy rate, and ADR to understand what drives success in this market.
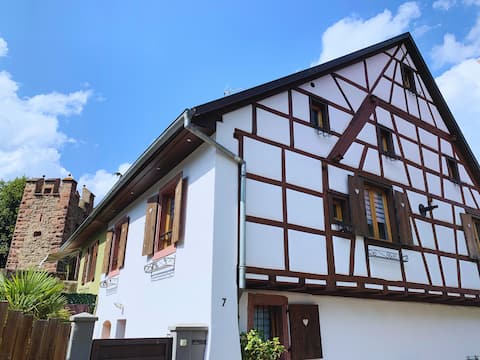
KBJ Alsace – Stylish House in Historic Kaysersberg
Entire Place • 3 bedrooms

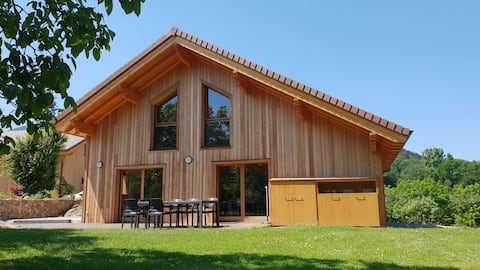
Modern house 10 people with sauna and Spa
Entire Place • 5 bedrooms
Large 4* SPA Chalet facing the castle
Entire Place • 4 bedrooms

Gîte du XVe
Entire Place • 2 bedrooms
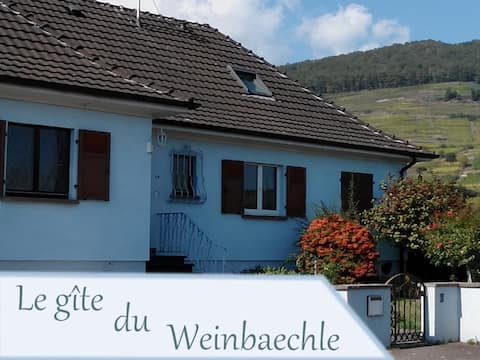
KAYSERSBERG - GITE DU WEINBAECHLE
Entire Place • 5 bedrooms
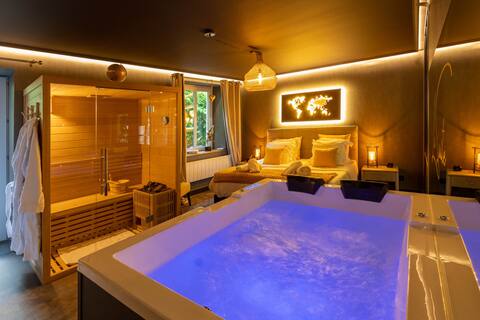
The Suite - Spa & Sauna 4* with parking
Entire Place • 1 bedroom
Note: Performance varies based on location, size, amenities, seasonality, and management quality. Data reflects the past 12 months.
Top Performing Airbnb Hosts in Kaysersberg-Vignoble (2026)
Learn from the best! This table showcases top-performing Airbnb hosts in Kaysersberg-Vignoble based on the number of properties managed and estimated total revenue over the past year. Analyze their scale and performance metrics.
| Host Name | Properties | Grossing Revenue | Stay Reviews | Avg Rating |
|---|---|---|---|---|
| En Apparté | 15 | $337,487 | 370 | 4.67/5.0 |
| Vincent | 3 | $113,034 | 169 | 4.92/5.0 |
| Karine | 5 | $112,341 | 250 | 4.76/5.0 |
| Lison Et Jean | 4 | $110,852 | 908 | 4.93/5.0 |
| Camille | 3 | $105,563 | 562 | 4.90/5.0 |
| Christian | 2 | $94,858 | 319 | 4.89/5.0 |
| Neymi | 3 | $92,498 | 123 | 4.97/5.0 |
| Boris | 1 | $74,975 | 46 | 5.00/5.0 |
| Caroline | 2 | $70,279 | 781 | 4.92/5.0 |
| Thierry | 4 | $69,332 | 274 | 4.61/5.0 |
Analyzing the strategies of top hosts, such as their property selection, pricing, and guest communication, can offer valuable lessons for optimizing your own Airbnb operations in Kaysersberg-Vignoble.
Dive Deeper: Advanced Kaysersberg-Vignoble STR Market Data (2026)
Ready to unlock more insights? AirROI provides access to advanced metrics and comprehensive Airbnb data for Kaysersberg-Vignoble. Explore detailed analytics beyond this report to refine your investment strategy, optimize pricing, and maximize your vacation rental profits.
Explore Advanced MetricsKaysersberg-Vignoble Short-Term Rental Market Composition (2026): Property & Room Types
Room Type Distribution
Property Type Distribution
Market Composition Insights for Kaysersberg-Vignoble
- The Kaysersberg-Vignoble Airbnb market composition is heavily skewed towards Entire Home/Apt listings, which make up 90.4% of the 188 active rentals. This indicates strong guest preference for privacy and space.
- Looking at the property type distribution in Kaysersberg-Vignoble, Apartment/Condo properties are the most common (62.8%), reflecting the local real estate landscape.
- Houses represent a significant 26.6% portion, catering likely to families or larger groups.
- The presence of 9% Hotel/Boutique listings indicates integration with traditional hospitality.
- Smaller segments like others, outdoor/unique (combined 1.6%) offer potential for unique stay experiences.
Kaysersberg-Vignoble Airbnb Room Capacity Analysis (2026): Bedroom Distribution
Distribution of Listings by Number of Bedrooms
Room Capacity Insights for Kaysersberg-Vignoble
- The dominant room capacity in Kaysersberg-Vignoble is 1 bedroom listings, making up 35.6% of the market. This suggests a strong demand for properties suitable for couples or solo travelers.
- Together, 1 bedroom and 2 bedrooms properties represent 67.0% of the active Airbnb listings in Kaysersberg-Vignoble, indicating a high concentration in these sizes.
- A significant 23.4% of listings offer 3+ bedrooms, catering to larger groups and families seeking more space in Kaysersberg-Vignoble.
Kaysersberg-Vignoble Vacation Rental Guest Capacity Trends (2026)
Distribution of Listings by Guest Capacity
Guest Capacity Insights for Kaysersberg-Vignoble
- The most common guest capacity trend in Kaysersberg-Vignoble vacation rentals is listings accommodating 4 guests (28.7%). This suggests the primary traveler segment is likely small families or groups.
- Properties designed for 4 guests and 2 guests dominate the Kaysersberg-Vignoble STR market, accounting for 50.0% of listings.
- 30.9% of properties accommodate 6+ guests, serving the market segment for larger families or group travel in Kaysersberg-Vignoble.
- On average, properties in Kaysersberg-Vignoble are equipped to host 4.1 guests.
Kaysersberg-Vignoble Airbnb Booking Patterns (2026): Available vs. Booked Days
Available Days Distribution
Booked Days Distribution
Booking Pattern Insights for Kaysersberg-Vignoble
- The most common availability pattern in Kaysersberg-Vignoble falls within the 271-366 days range, representing 41.5% of listings. This suggests many properties have significant open periods on their calendars.
- Approximately 72.4% of listings show high availability (181+ days open annually), indicating potential for increased bookings or specific owner usage patterns.
- For booked days, the 91-180 days range is most frequent in Kaysersberg-Vignoble (31.9%), reflecting common guest stay durations or potential owner blocking patterns.
- A notable 28.2% of properties secure long booking periods (181+ days booked per year), highlighting successful long-term rental strategies or significant owner usage.
Kaysersberg-Vignoble Airbnb Minimum Stay Requirements Analysis
Distribution of Listings by Minimum Night Requirement
1 Night
15 listings
8% of total
2 Nights
44 listings
23.4% of total
3 Nights
21 listings
11.2% of total
4-6 Nights
16 listings
8.5% of total
7-29 Nights
4 listings
2.1% of total
30+ Nights
88 listings
46.8% of total
Key Insights
- The most prevalent minimum stay requirement in Kaysersberg-Vignoble is 30+ Nights, adopted by 46.8% of listings. This highlights the market's preference for longer commitments.
- A significant segment (46.8%) caters to monthly stays (30+ nights) in Kaysersberg-Vignoble, pointing to opportunities in the extended-stay market.
Recommendations
- Align with the market by considering a 30+ Nights minimum stay, as 46.8% of Kaysersberg-Vignoble hosts use this setting.
- If feasible, allowing 1-night stays, especially midweek or during low season, could capture last-minute bookings, as only 8% currently do.
- Explore offering discounts for stays of 30+ nights to attract the 46.8% of the market seeking extended stays.
- Adjust minimum nights based on seasonality – potentially shorter during low season and longer during peak demand periods in Kaysersberg-Vignoble.
Kaysersberg-Vignoble Airbnb Cancellation Policy Trends Analysis (2026)
Non-refundable
1 listings
0.5% of total
Limited
3 listings
1.6% of total
Flexible
40 listings
21.3% of total
Moderate
62 listings
33% of total
Firm
68 listings
36.2% of total
Strict
14 listings
7.4% of total
Cancellation Policy Insights for Kaysersberg-Vignoble
- The prevailing Airbnb cancellation policy trend in Kaysersberg-Vignoble is Firm, used by 36.2% of listings.
- There's a relatively balanced mix between guest-friendly (54.3%) and stricter (43.6%) policies, offering choices for different guest needs.
- Strict cancellation policies are quite rare (7.4%), potentially making listings with this policy less competitive unless justified by high demand or property type.
Recommendations for Hosts
- Consider adopting a Firm policy to align with the 36.2% market standard in Kaysersberg-Vignoble.
- Using a Strict policy might deter some guests, as only 7.4% of listings use it. Evaluate if potential revenue protection outweighs possible lower booking rates.
- Regularly review your cancellation policy against competitors and market demand shifts in Kaysersberg-Vignoble.
Kaysersberg-Vignoble STR Booking Lead Time Analysis (2026)
Average Booking Lead Time by Month
Booking Lead Time Insights for Kaysersberg-Vignoble
- The overall average booking lead time for vacation rentals in Kaysersberg-Vignoble is 76 days.
- Guests book furthest in advance for stays during December (average 126 days), likely coinciding with peak travel demand or local events.
- The shortest booking windows occur for stays in February (average 34 days), indicating more last-minute travel plans during this time.
- Seasonally, Fall (82 days avg.) sees the longest lead times, while Spring (65 days avg.) has the shortest, reflecting typical travel planning cycles.
Recommendations for Hosts
- Use the overall average lead time (76 days) as a baseline for your pricing and availability strategy in Kaysersberg-Vignoble.
- For December stays, consider implementing length-of-stay discounts or slightly higher rates for bookings made less than 126 days out to capitalize on advance planning.
- Target marketing efforts for the Fall season well in advance (at least 82 days) to capture early planners.
- Monitor your own booking lead times against these Kaysersberg-Vignoble averages to identify opportunities for dynamic pricing adjustments.
Popular & Essential Airbnb Amenities in Kaysersberg-Vignoble (2026)
Amenity Prevalence
Amenity Insights for Kaysersberg-Vignoble
- Essential amenities in Kaysersberg-Vignoble that guests expect include: Heating. Lacking these (this) could significantly impact bookings.
- Popular amenities like Wifi, Smoke alarm, Hair dryer are common but not universal. Offering these can provide a competitive edge.
- Warning: Wifi is not universally provided but is considered essential globally. Ensure reliable Wifi is offered.
Recommendations for Hosts
- Ensure your listing includes all essential amenities for Kaysersberg-Vignoble: Heating.
- Prioritize adding missing essentials: Heating.
- Consider adding popular differentiators like Wifi or Smoke alarm to increase appeal.
- Highlight unique or less common amenities you offer (e.g., hot tub, dedicated workspace, EV charger) in your listing description and photos.
- Regularly check competitor amenities in Kaysersberg-Vignoble to stay competitive.
Kaysersberg-Vignoble Airbnb Guest Demographics & Profile Analysis (2026)
Guest Profile Summary for Kaysersberg-Vignoble
- The typical guest profile for Airbnb in Kaysersberg-Vignoble consists of a mix of domestic (46%) and international guests, with top international origins including Germany, typically belonging to the Post-2000s (Gen Z/Alpha) group (50%), primarily speaking English or French.
- Domestic travelers account for 45.6% of guests.
- Key international markets include France (45.6%) and Germany (16.9%).
- Top languages spoken are English (35.9%) followed by French (26.3%).
- A significant demographic segment is the Post-2000s (Gen Z/Alpha) group, representing 50% of guests.
Recommendations for Hosts
- Balance marketing efforts between domestic and international channels based on the guest mix.
- Tailor amenities and listing descriptions to appeal to the dominant Post-2000s (Gen Z/Alpha) demographic (e.g., highlight fast WiFi, smart home features, local guides).
- Highlight unique local experiences or amenities relevant to the primary guest profile.
- Consider seasonal promotions aligned with peak travel times for key origin markets.
Nearby Short-Term Rental Market Comparison
How does the Kaysersberg-Vignoble Airbnb market stack up against its neighbors? Compare key performance metrics like average monthly revenue, ADR, and occupancy rates in surrounding areas to understand the broader regional STR landscape.
| Market | Active Properties | Monthly Revenue | Daily Rate | Avg. Occupancy |
|---|---|---|---|---|
| Ittenheim | 20 | $6,532 | $404.34 | 42% |
| Furdenheim | 14 | $6,054 | $470.22 | 50% |
| Bassersdorf | 16 | $5,337 | $431.59 | 46% |
| Vitznau | 31 | $4,688 | $425.43 | 45% |
| Lucerne | 329 | $4,288 | $310.00 | 53% |
| Le Valtin | 13 | $4,103 | $375.72 | 47% |
| La Forge | 13 | $3,208 | $339.73 | 41% |
| Weggis | 56 | $3,193 | $266.21 | 46% |
| Sattel | 12 | $3,099 | $222.58 | 56% |
| Griesheim-près-Molsheim | 18 | $3,082 | $284.57 | 39% |