Furdenheim Airbnb Market Analysis 2025: Short Term Rental Data & Vacation Rental Statistics in Grand Est, France
Is Airbnb profitable in Furdenheim in 2025? Explore comprehensive Airbnb analytics for Furdenheim, Grand Est, France to uncover income potential. This 2025 STR market report for Furdenheim, based on AirROI data from September 2024 to August 2025, reveals key trends in the niche market of 20 active listings.
Whether you're considering an Airbnb investment in Furdenheim, optimizing your existing vacation rental, or exploring rental arbitrage opportunities, understanding the Furdenheim Airbnb data is crucial. Leveraging the low regulation environment is key to maximizing your short term rental income potential. Let's dive into the specifics.
Key Furdenheim Airbnb Performance Metrics Overview
Monthly Airbnb Revenue Variations & Income Potential in Furdenheim (2025)
Understanding the monthly revenue variations for Airbnb listings in Furdenheim is key to maximizing your short term rental income potential. Seasonality significantly impacts earnings. Our analysis, based on data from the past 12 months, shows that the peak revenue month for STRs in Furdenheim is typically August, while January often presents the lowest earnings, highlighting opportunities for strategic pricing adjustments during shoulder and low seasons. Explore the typical Airbnb income in Furdenheim across different performance tiers:
- Best-in-class properties (Top 10%) achieve $14,184+ monthly, often utilizing dynamic pricing and superior guest experiences.
- Strong performing properties (Top 25%) earn $7,980 or more, indicating effective management and desirable locations/amenities.
- Typical properties (Median) generate around $3,882 per month, representing the average market performance.
- Entry-level properties (Bottom 25%) see earnings around $1,034, often with potential for optimization.
Average Monthly Airbnb Earnings Trend in Furdenheim
Furdenheim Airbnb Occupancy Rate Trends (2025)
Maximize your bookings by understanding the Furdenheim STR occupancy trends. Seasonal demand shifts significantly influence how often properties are booked. Typically, Augustsees the highest demand (peak season occupancy), while January experiences the lowest (low season). Effective strategies, like adjusting minimum stays or offering promotions, can boost occupancy during slower periods. Here's how different property tiers perform in Furdenheim:
- Best-in-class properties (Top 10%) achieve 77%+ occupancy, indicating high desirability and potentially optimized availability.
- Strong performing properties (Top 25%) maintain 66% or higher occupancy, suggesting good market fit and guest satisfaction.
- Typical properties (Median) have an occupancy rate around 43%.
- Entry-level properties (Bottom 25%) average 25% occupancy, potentially facing higher vacancy.
Average Monthly Occupancy Rate Trend in Furdenheim
Average Daily Rate (ADR) Airbnb Trends in Furdenheim (2025)
Effective short term rental pricing strategy in Furdenheim involves understanding monthly ADR fluctuations. The Average Daily Rate (ADR) for Airbnb in Furdenheim typically peaks in July and dips lowest during November. Leveraging Airbnb dynamic pricing tools or strategies based on this seasonality can significantly boost revenue. Here's a look at the typical nightly rates achieved:
- Best-in-class properties (Top 10%) command rates of $901+ per night, often due to premium features or locations.
- Strong performing properties (Top 25%) achieve nightly rates of $511 or more.
- Typical properties (Median) charge around $149 per night.
- Entry-level properties (Bottom 25%) earn around $73 per night.
Average Daily Rate (ADR) Trend by Month in Furdenheim
Get Live Furdenheim Market Intelligence 👇

Explore Real-time Analytics
Airbnb Seasonality Analysis & Trends in Furdenheim (2025)
Peak Season (August, July, June)
- Revenue averages $11,010 per month
- Occupancy rates average 57.5%
- Daily rates average $409
Shoulder Season
- Revenue averages $5,149 per month
- Occupancy maintains around 44.6%
- Daily rates hold near $327
Low Season (January, February, September)
- Revenue drops to average $2,833 per month
- Occupancy decreases to average 37.1%
- Daily rates adjust to average $310
Seasonality Insights for Furdenheim
- The Airbnb seasonality in Furdenheim shows highly seasonal trends requiring careful strategy. While the sections above show seasonal averages, it's also insightful to look at the extremes:
- During the high season, the absolute peak month showcases Furdenheim's highest earning potential, with monthly revenues capable of climbing to $12,710, occupancy reaching a high of 67.5%, and ADRs peaking at $419.
- Conversely, the slowest single month of the year, typically falling within the low season, marks the market's lowest point. In this month, revenue might dip to $2,575, occupancy could drop to 26.9%, and ADRs may adjust down to $296.
- Understanding both the seasonal averages and these monthly peaks and troughs in revenue, occupancy, and ADR is crucial for maximizing your Airbnb profit potential in Furdenheim.
Seasonal Strategies for Maximizing Profit
- Peak Season: Maximize revenue through premium pricing and potentially longer minimum stays. Ensure high availability.
- Low Season: Offer competitive pricing, special promotions (e.g., extended stay discounts), and flexible cancellation policies. Target off-season travelers like remote workers or budget-conscious guests.
- Shoulder Seasons: Implement dynamic pricing that balances peak and low rates. Target weekend travelers or specific events. Offer slightly more flexible terms than peak season.
- Regularly analyze your own performance against these Furdenheim seasonality benchmarks and adjust your pricing and availability strategy accordingly.
Best Areas for Airbnb Investment in Furdenheim (2025)
Exploring the top neighborhoods for short-term rentals in Furdenheim? This section highlights key areas, outlining why they are attractive for hosts and guests, along with notable local attractions. Consider these locations based on your target guest profile and investment strategy.
| Neighborhood / Area | Why Host Here? (Target Guests & Appeal) | Key Attractions & Landmarks |
|---|---|---|
| Furdenheim Center | The heart of the village with a charming atmosphere, close to local amenities and attractions. Ideal for tourists exploring the local culture and enjoying a quieter stay. | Local cafes, Church of Furdenheim, Community park, Nearby vineyards, Traditional markets |
| Strasbourg Proximity | Just a short drive from Strasbourg, offering easy access to the city’s attractions while providing a peaceful retreat. Great for those visiting Strasbourg for business or pleasure. | Strasbourg Cathedral, Petite France, European Parliament, Museums, River Ill views |
| Hiking Trails | Surrounded by beautiful nature and hiking opportunities, appealing to outdoor enthusiasts and those looking to escape the city hustle. | Vosges Mountains, Local forests, Bicycle trails, Scenic viewpoints, Nature reserves |
| Local Vineyards | Located near the Alsace wine route, perfect for wine lovers and tourists looking to experience local wine culture and tastings. | Wine tasting tours, Vineyard visits, Wine festivals, Scenic vineyards, Gastronomy experiences |
| Historical Sites | Rich in history, this area attracts history buffs interested in exploring local heritage and cultural landmarks. | Châteaux, Local museums, Historical markers, Architectural tours, Heritage walking paths |
| Family-Friendly Area | Great for families with children, offering parks, activities and kid-friendly attractions nearby. | Playgrounds, Family-oriented restaurants, Cultural events, Outdoor activities, Sports facilities |
| Local Cuisine | Known for its gastronomic offerings, attracting foodies interested in local culinary experiences and dining. | Traditional restaurants, Food markets, Cooking classes, Culinary festivals, Food tours |
| Event Venues | Close to venues for local events and fairs, appealing to those attending regional festivities throughout the year. | Concert halls, Exhibition centers, Local fairs, Seasonal markets, Sporting events |
Understanding Airbnb License Requirements & STR Laws in Furdenheim (2025)
While Furdenheim, Grand Est, France currently shows low STR regulations, specific Airbnb license requirements might still exist or change. Always verify the latest short term rental regulations and Airbnb license requirements directly with local government authorities for Furdenheim to ensure full compliance before hosting.
(Source: AirROI data, 2025, finding no licensed listings among those analyzed)
Top Performing Airbnb Properties in Furdenheim (2025)
Benchmark your potential! Explore examples of top-performing Airbnb properties in Furdenheimbased on Trailing Twelve Month (TTM) revenue. Analyze their characteristics, revenue, occupancy rate, and ADR to understand what drives success in this market.
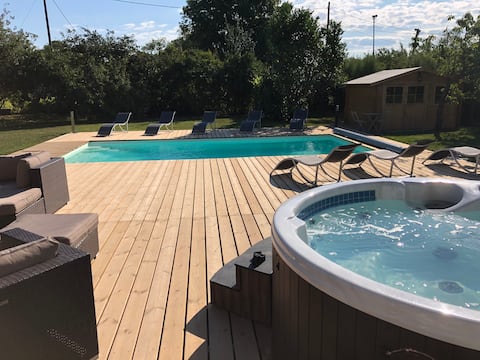
Domaine des 4 ROSES -SPA 17 minutes from Strasbourg
Entire Place • 8 bedrooms

Villa des Collines Spa Pool Sports and Luxury
Entire Place • 5 bedrooms
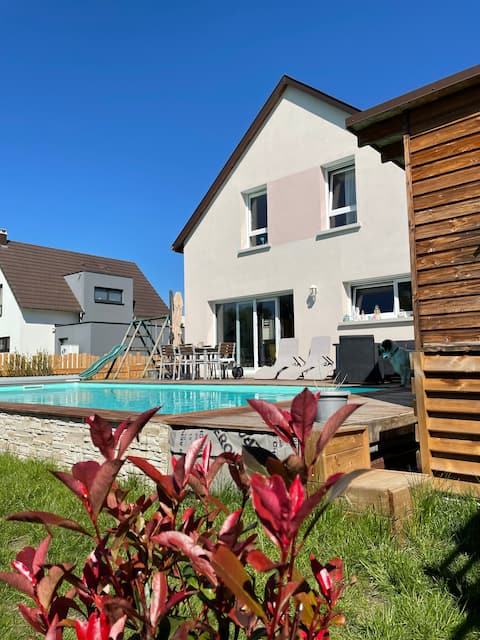
House with pool and 4 bedrooms
Entire Place • 4 bedrooms

The Cottage
Entire Place • 5 bedrooms

Private jacuzzi, sauna, arcade machine,terrace, AC
Entire Place • 3 bedrooms

Villa | heated swimming pool, private ac jacuzzi
Entire Place • 4 bedrooms
Note: Performance varies based on location, size, amenities, seasonality, and management quality. Data reflects the past 12 months.
Top Performing Airbnb Hosts in Furdenheim (2025)
Learn from the best! This table showcases top-performing Airbnb hosts in Furdenheim based on the number of properties managed and estimated total revenue over the past year. Analyze their scale and performance metrics.
| Host Name | Properties | Grossing Revenue | Stay Reviews | Avg Rating |
|---|---|---|---|---|
| Jean | 3 | $431,264 | 108 | 4.97/5.0 |
| Arnaud | 2 | $146,261 | 308 | 4.93/5.0 |
| Christophe | 1 | $80,045 | 20 | 4.90/5.0 |
| Fabrice | 1 | $77,957 | 63 | 4.98/5.0 |
| Dan | 1 | $70,219 | 50 | 4.82/5.0 |
| Magali | 1 | $28,352 | 11 | 4.64/5.0 |
| Host #28958403 | 3 | $26,412 | 169 | 4.95/5.0 |
| Philippe | 1 | $25,516 | 122 | 4.79/5.0 |
| Dominique | 1 | $18,689 | 16 | 5.00/5.0 |
| Pascal | 1 | $13,141 | 28 | 4.86/5.0 |
Analyzing the strategies of top hosts, such as their property selection, pricing, and guest communication, can offer valuable lessons for optimizing your own Airbnb operations in Furdenheim.
Dive Deeper: Advanced Furdenheim STR Market Data (2025)
Ready to unlock more insights? AirROI provides access to advanced metrics and comprehensive Airbnb data for Furdenheim. Explore detailed analytics beyond this report to refine your investment strategy, optimize pricing, and maximize your vacation rental profits.
Explore Advanced MetricsFurdenheim Short-Term Rental Market Composition (2025): Property & Room Types
Room Type Distribution
Property Type Distribution
Market Composition Insights for Furdenheim
- The Furdenheim Airbnb market composition is heavily skewed towards Entire Home/Apt listings, which make up 95% of the 20 active rentals. This indicates strong guest preference for privacy and space.
- Looking at the property type distribution in Furdenheim, Apartment/Condo properties are the most common (50%), reflecting the local real estate landscape.
- Houses represent a significant 45% portion, catering likely to families or larger groups.
Furdenheim Airbnb Room Capacity Analysis (2025): Bedroom Distribution
Distribution of Listings by Number of Bedrooms
Room Capacity Insights for Furdenheim
- The dominant room capacity in Furdenheim is 1 bedroom listings, making up 25% of the market. This suggests a strong demand for properties suitable for couples or solo travelers.
- Together, 1 bedroom and 3 bedrooms properties represent 50.0% of the active Airbnb listings in Furdenheim, indicating a high concentration in these sizes.
- A significant 60.0% of listings offer 3+ bedrooms, catering to larger groups and families seeking more space in Furdenheim.
Furdenheim Vacation Rental Guest Capacity Trends (2025)
Distribution of Listings by Guest Capacity
Guest Capacity Insights for Furdenheim
- The most common guest capacity trend in Furdenheim vacation rentals is listings accommodating 8+ guests (40%). This suggests the primary traveler segment is likely larger groups.
- Properties designed for 8+ guests and 6 guests dominate the Furdenheim STR market, accounting for 60.0% of listings.
- 70.0% of properties accommodate 6+ guests, serving the market segment for larger families or group travel in Furdenheim.
- On average, properties in Furdenheim are equipped to host 6.2 guests.
Furdenheim Airbnb Booking Patterns (2025): Available vs. Booked Days
Available Days Distribution
Booked Days Distribution
Booking Pattern Insights for Furdenheim
- The most common availability pattern in Furdenheim falls within the 181-270 days range, representing 40% of listings. This suggests many properties have significant open periods on their calendars.
- Approximately 80.0% of listings show high availability (181+ days open annually), indicating potential for increased bookings or specific owner usage patterns.
- For booked days, the 91-180 days range is most frequent in Furdenheim (45%), reflecting common guest stay durations or potential owner blocking patterns.
- A notable 20.0% of properties secure long booking periods (181+ days booked per year), highlighting successful long-term rental strategies or significant owner usage.
Furdenheim Airbnb Minimum Stay Requirements Analysis
Distribution of Listings by Minimum Night Requirement
1 Night
4 listings
23.5% of total
2 Nights
4 listings
23.5% of total
3 Nights
1 listings
5.9% of total
30+ Nights
8 listings
47.1% of total
Key Insights
- The most prevalent minimum stay requirement in Furdenheim is 30+ Nights, adopted by 47.1% of listings. This highlights the market's preference for longer commitments.
- A significant segment (47.1%) caters to monthly stays (30+ nights) in Furdenheim, pointing to opportunities in the extended-stay market.
Recommendations
- Align with the market by considering a 30+ Nights minimum stay, as 47.1% of Furdenheim hosts use this setting.
- If feasible, allowing 1-night stays, especially midweek or during low season, could capture last-minute bookings, as only 23.5% currently do.
- Explore offering discounts for stays of 30+ nights to attract the 47.1% of the market seeking extended stays.
- Adjust minimum nights based on seasonality – potentially shorter during low season and longer during peak demand periods in Furdenheim.
Furdenheim Airbnb Cancellation Policy Trends Analysis (2025)
Flexible
4 listings
25% of total
Moderate
5 listings
31.3% of total
Firm
3 listings
18.8% of total
Strict
4 listings
25% of total
Cancellation Policy Insights for Furdenheim
- The prevailing Airbnb cancellation policy trend in Furdenheim is Moderate, used by 31.3% of listings.
- There's a relatively balanced mix between guest-friendly (56.3%) and stricter (43.8%) policies, offering choices for different guest needs.
Recommendations for Hosts
- Consider adopting a Moderate policy to align with the 31.3% market standard in Furdenheim.
- Regularly review your cancellation policy against competitors and market demand shifts in Furdenheim.
Furdenheim STR Booking Lead Time Analysis (2025)
Average Booking Lead Time by Month
Booking Lead Time Insights for Furdenheim
- The overall average booking lead time for vacation rentals in Furdenheim is 87 days.
- Guests book furthest in advance for stays during May (average 129 days), likely coinciding with peak travel demand or local events.
- The shortest booking windows occur for stays in March (average 23 days), indicating more last-minute travel plans during this time.
- Seasonally, Summer (123 days avg.) sees the longest lead times, while Winter (59 days avg.) has the shortest, reflecting typical travel planning cycles.
Recommendations for Hosts
- Use the overall average lead time (87 days) as a baseline for your pricing and availability strategy in Furdenheim.
- For May stays, consider implementing length-of-stay discounts or slightly higher rates for bookings made less than 129 days out to capitalize on advance planning.
- Target marketing efforts for the Summer season well in advance (at least 123 days) to capture early planners.
- Monitor your own booking lead times against these Furdenheim averages to identify opportunities for dynamic pricing adjustments.
Popular & Essential Airbnb Amenities in Furdenheim (2025)
Amenity Prevalence
Amenity Insights for Furdenheim
- Essential amenities in Furdenheim that guests expect include: Kitchen, Heating, Wifi, Dishes and silverware, Oven, Hot water, Smoke alarm, Refrigerator, TV, Microwave. Lacking these (any) could significantly impact bookings.
Recommendations for Hosts
- Ensure your listing includes all essential amenities for Furdenheim: Kitchen, Heating, Wifi, Dishes and silverware, Oven, Hot water, Smoke alarm, Refrigerator, TV, Microwave.
- Prioritize adding missing essentials: Oven, Hot water, Smoke alarm, Refrigerator, TV, Microwave.
- Highlight unique or less common amenities you offer (e.g., hot tub, dedicated workspace, EV charger) in your listing description and photos.
- Regularly check competitor amenities in Furdenheim to stay competitive.
Furdenheim Airbnb Guest Demographics & Profile Analysis (2025)
Guest Profile Summary for Furdenheim
- The typical guest profile for Airbnb in Furdenheim consists of a mix of domestic (54%) and international guests, often arriving from nearby Paris, typically belonging to the Post-2000s (Gen Z/Alpha) group (50%), primarily speaking English or French.
- Domestic travelers account for 53.9% of guests.
- Key international markets include France (53.9%) and Germany (25.8%).
- Top languages spoken are English (35.5%) followed by French (31%).
- A significant demographic segment is the Post-2000s (Gen Z/Alpha) group, representing 50% of guests.
Recommendations for Hosts
- Balance marketing efforts between domestic and international channels based on the guest mix.
- Tailor amenities and listing descriptions to appeal to the dominant Post-2000s (Gen Z/Alpha) demographic (e.g., highlight fast WiFi, smart home features, local guides).
- Highlight unique local experiences or amenities relevant to the primary guest profile.
- Consider seasonal promotions aligned with peak travel times for key origin markets.
Nearby Short-Term Rental Market Comparison
How does the Furdenheim Airbnb market stack up against its neighbors? Compare key performance metrics like average monthly revenue, ADR, and occupancy rates in surrounding areas to understand the broader regional STR landscape.
| Market | Active Properties | Monthly Revenue | Daily Rate | Avg. Occupancy |
|---|---|---|---|---|
| Rothenburg | 11 | $5,709 | $293.66 | 64% |
| Bassersdorf | 16 | $4,604 | $383.02 | 49% |
| Ittenheim | 21 | $4,514 | $279.01 | 42% |
| Vitznau | 31 | $4,346 | $414.25 | 47% |
| Lucerne | 339 | $3,934 | $284.83 | 52% |
| Le Valtin | 14 | $3,280 | $372.84 | 39% |
| Sattel | 12 | $3,279 | $217.29 | 57% |
| Weggis | 54 | $3,262 | $263.35 | 46% |
| Osenbach | 24 | $3,207 | $287.45 | 37% |
| Sempach | 14 | $3,197 | $219.39 | 52% |