Bora-Bora Airbnb Market Analysis 2026: Short Term Rental Data & Vacation Rental Statistics in French Polynesia, France
Is Airbnb profitable in Bora-Bora in 2026? Explore comprehensive Airbnb analytics for Bora-Bora, French Polynesia, France to uncover income potential. This 2026 STR market report for Bora-Bora, based on AirROI data from February 2025 to January 2026, reveals key trends in the niche market of 200 active listings.
Whether you're considering an Airbnb investment in Bora-Bora, optimizing your existing vacation rental, or exploring rental arbitrage opportunities, understanding the Bora-Bora Airbnb data is crucial. Navigating the high regulation landscape is key to maximizing your short term rental income potential. Let's dive into the specifics.
Key Bora-Bora Airbnb Performance Metrics Overview
Monthly Airbnb Revenue Variations & Income Potential in Bora-Bora (2026)
Understanding the monthly revenue variations for Airbnb listings in Bora-Bora is key to maximizing your short term rental income potential. Seasonality significantly impacts earnings. Our analysis, based on data from the past 12 months, shows that the peak revenue month for STRs in Bora-Bora is typically August, while February often presents the lowest earnings, highlighting opportunities for strategic pricing adjustments during shoulder and low seasons. Explore the typical Airbnb income in Bora-Bora across different performance tiers:
- Best-in-class properties (Top 10%) achieve $10,346+ monthly, often utilizing dynamic pricing and superior guest experiences.
- Strong performing properties (Top 25%) earn $5,265 or more, indicating effective management and desirable locations/amenities.
- Typical properties (Median) generate around $2,666 per month, representing the average market performance.
- Entry-level properties (Bottom 25%) see earnings around $1,433, often with potential for optimization.
Average Monthly Airbnb Earnings Trend in Bora-Bora
Bora-Bora Airbnb Occupancy Rate Trends (2026)
Maximize your bookings by understanding the Bora-Bora STR occupancy trends. Seasonal demand shifts significantly influence how often properties are booked. Typically, Julysees the highest demand (peak season occupancy), while January experiences the lowest (low season). Effective strategies, like adjusting minimum stays or offering promotions, can boost occupancy during slower periods. Here's how different property tiers perform in Bora-Bora:
- Best-in-class properties (Top 10%) achieve 81%+ occupancy, indicating high desirability and potentially optimized availability.
- Strong performing properties (Top 25%) maintain 66% or higher occupancy, suggesting good market fit and guest satisfaction.
- Typical properties (Median) have an occupancy rate around 47%.
- Entry-level properties (Bottom 25%) average 24% occupancy, potentially facing higher vacancy.
Average Monthly Occupancy Rate Trend in Bora-Bora
Average Daily Rate (ADR) Airbnb Trends in Bora-Bora (2026)
Effective short term rental pricing strategy in Bora-Bora involves understanding monthly ADR fluctuations. The Average Daily Rate (ADR) for Airbnb in Bora-Bora typically peaks in September and dips lowest during February. Leveraging Airbnb dynamic pricing tools or strategies based on this seasonality can significantly boost revenue. Here's a look at the typical nightly rates achieved:
- Best-in-class properties (Top 10%) command rates of $690+ per night, often due to premium features or locations.
- Strong performing properties (Top 25%) achieve nightly rates of $349 or more.
- Typical properties (Median) charge around $195 per night.
- Entry-level properties (Bottom 25%) earn around $137 per night.
Average Daily Rate (ADR) Trend by Month in Bora-Bora
Get Live Bora-Bora Market Intelligence 👇

Explore Real-time Analytics
Airbnb Seasonality Analysis & Trends in Bora-Bora (2026)
Peak Season (August, July, September)
- Revenue averages $5,780 per month
- Occupancy rates average 60.9%
- Daily rates average $310
Shoulder Season
- Revenue averages $4,110 per month
- Occupancy maintains around 45.6%
- Daily rates hold near $306
Low Season (January, February, March)
- Revenue drops to average $2,966 per month
- Occupancy decreases to average 32.3%
- Daily rates adjust to average $293
Seasonality Insights for Bora-Bora
- The Airbnb seasonality in Bora-Bora shows highly seasonal trends requiring careful strategy. While the sections above show seasonal averages, it's also insightful to look at the extremes:
- During the high season, the absolute peak month showcases Bora-Bora's highest earning potential, with monthly revenues capable of climbing to $6,012, occupancy reaching a high of 61.3%, and ADRs peaking at $326.
- Conversely, the slowest single month of the year, typically falling within the low season, marks the market's lowest point. In this month, revenue might dip to $2,606, occupancy could drop to 26.7%, and ADRs may adjust down to $281.
- Understanding both the seasonal averages and these monthly peaks and troughs in revenue, occupancy, and ADR is crucial for maximizing your Airbnb profit potential in Bora-Bora.
Seasonal Strategies for Maximizing Profit
- Peak Season: Maximize revenue through premium pricing and potentially longer minimum stays. Ensure high availability.
- Low Season: Offer competitive pricing, special promotions (e.g., extended stay discounts), and flexible cancellation policies. Target off-season travelers like remote workers or budget-conscious guests.
- Shoulder Seasons: Implement dynamic pricing that balances peak and low rates. Target weekend travelers or specific events. Offer slightly more flexible terms than peak season.
- Regularly analyze your own performance against these Bora-Bora seasonality benchmarks and adjust your pricing and availability strategy accordingly.
Best Areas for Airbnb Investment in Bora-Bora (2026)
Exploring the top neighborhoods for short-term rentals in Bora-Bora? This section highlights key areas, outlining why they are attractive for hosts and guests, along with notable local attractions. Consider these locations based on your target guest profile and investment strategy.
| Neighborhood / Area | Why Host Here? (Target Guests & Appeal) | Key Attractions & Landmarks |
|---|---|---|
| Matira Beach | Famous for its stunning white sand and turquoise waters, Matira Beach is the most famous public beach in Bora Bora, ideal for romantic getaways and water activities. | Matira Point, Coral gardens, Lagoon tours, Snorkeling spots, Beachfront restaurants |
| Vaitape | The main town on the island and the gateway to explore Bora Bora. It’s perfect for those looking to experience local culture while still being close to the beaches. | Bora Bora Yacht Club, Vaitape Market, Historical Museum, Lagoonarium, Local shops and eateries |
| Pahia | Known for its breathtaking views of Mount Otemanu, Pahia offers a more tranquil experience away from the hustle and bustle. It's great for relaxation and inner exploration. | Hiking trails, Scenic viewpoints, Moorea Island views, Local village life, Water sports |
| Anau | A peaceful area with access to the beautiful lagoon, ideal for those looking for luxury stays and relaxation in a serene environment. | Lagoon cruises, Private beach access, Sunset views, Bora Bora Coral Garden, Multi-day boat tours |
| Faanui | A quaint village with a glimpse into local life, Faanui is great for guests seeking authenticity and cultural experiences in a scenic location. | Local churches, Cultural sites, Bora Bora Lagoon, Adventures on the water, Traditional Polynesian fare |
| Bora Bora Pearl Beach Resort | This luxurious resort area offers a unique experience with overwater bungalows and direct access to stunning lagoons, perfect for high-end Airbnb options. | Spa facilities, Dining options, Water sports activities, Private beaches, Romantic settings |
| Sofitel Bora Bora Private Island | An exclusive private island offering a unique getaway experience with luxurious amenities and privacy, ideal for couples and honeymooners. | Private beaches, Bora Bora Lagoon, Luxurious dining, Spa treatments, Water activities |
| Temaru | A secluded area that provides a peaceful retreat experience, perfect for those looking to disconnect and recharge, amidst beautiful natural surroundings. | Quiet beaches, Nature trails, Kayaking opportunities, Adventurous exploration, Bora Bora sunsets |
Understanding Airbnb License Requirements & STR Laws in Bora-Bora (2026)
Yes, Bora-Bora, French Polynesia, France enforces high STR regulations. Obtaining a license and ensuring compliance is almost certainly required according to current 2026 STR laws. Always verify the latest short term rental regulations and Airbnb license requirements directly with local government authorities for Bora-Bora to ensure full compliance before hosting.
(Source: AirROI data, 2026, based on 95% licensed listings)
Top Performing Airbnb Properties in Bora-Bora (2026)
Benchmark your potential! Explore examples of top-performing Airbnb properties in Bora-Borabased on Trailing Twelve Month (TTM) revenue. Analyze their characteristics, revenue, occupancy rate, and ADR to understand what drives success in this market.

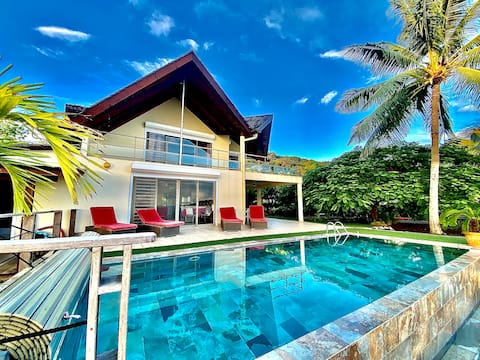
Ouma Villa on Matira Beach
Entire Place • 2 bedrooms
Vini Villa Bora - Your luxury Villa in Bora Bora
Entire Place • 3 bedrooms
Matira Beach House
Entire Place • 3 bedrooms
Overwater Bungalow N3
Entire Place • 1 bedroom
Catamaran in Paradise
Entire Place • 3 bedrooms
Octopus Villa – Lagoon Access and Private Pool
Entire Place • 3 bedrooms
Note: Performance varies based on location, size, amenities, seasonality, and management quality. Data reflects the past 12 months.
Top Performing Airbnb Hosts in Bora-Bora (2026)
Learn from the best! This table showcases top-performing Airbnb hosts in Bora-Bora based on the number of properties managed and estimated total revenue over the past year. Analyze their scale and performance metrics.
| Host Name | Properties | Grossing Revenue | Stay Reviews | Avg Rating |
|---|---|---|---|---|
| Bora Bora Enjoy | 16 | $1,082,485 | 491 | 4.78/5.0 |
| Jessica | 5 | $487,535 | 400 | 4.93/5.0 |
| Pascal | 2 | $301,883 | 108 | 4.96/5.0 |
| Richard | 3 | $291,379 | 129 | 4.81/5.0 |
| Pierre | 3 | $269,318 | 293 | 4.88/5.0 |
| Nicolas | 1 | $261,706 | 118 | 4.97/5.0 |
| Jenny | 2 | $238,436 | 390 | 4.96/5.0 |
| Tino | 11 | $223,973 | 69 | 4.72/5.0 |
| Ingrid | 2 | $222,511 | 113 | 4.98/5.0 |
| Romain | 2 | $218,811 | 169 | 4.95/5.0 |
Analyzing the strategies of top hosts, such as their property selection, pricing, and guest communication, can offer valuable lessons for optimizing your own Airbnb operations in Bora-Bora.
Dive Deeper: Advanced Bora-Bora STR Market Data (2026)
Ready to unlock more insights? AirROI provides access to advanced metrics and comprehensive Airbnb data for Bora-Bora. Explore detailed analytics beyond this report to refine your investment strategy, optimize pricing, and maximize your vacation rental profits.
Explore Advanced MetricsBora-Bora Short-Term Rental Market Composition (2026): Property & Room Types
Room Type Distribution
Property Type Distribution
Market Composition Insights for Bora-Bora
- The Bora-Bora Airbnb market composition is heavily skewed towards Entire Home/Apt listings, which make up 85% of the 200 active rentals. This indicates strong guest preference for privacy and space.
- Looking at the property type distribution in Bora-Bora, House properties are the most common (53.5%), reflecting the local real estate landscape.
- Houses represent a significant 53.5% portion, catering likely to families or larger groups.
- The presence of 9.5% Hotel/Boutique listings indicates integration with traditional hospitality.
- Smaller segments like others, unique stays (combined 2.5%) offer potential for unique stay experiences.
Bora-Bora Airbnb Room Capacity Analysis (2026): Bedroom Distribution
Distribution of Listings by Number of Bedrooms
Room Capacity Insights for Bora-Bora
- The dominant room capacity in Bora-Bora is 1 bedroom listings, making up 46% of the market. This suggests a strong demand for properties suitable for couples or solo travelers.
- Together, 1 bedroom and 2 bedrooms properties represent 68.5% of the active Airbnb listings in Bora-Bora, indicating a high concentration in these sizes.
Bora-Bora Vacation Rental Guest Capacity Trends (2026)
Distribution of Listings by Guest Capacity
Guest Capacity Insights for Bora-Bora
- The most common guest capacity trend in Bora-Bora vacation rentals is listings accommodating 2 guests (37.5%). This suggests the primary traveler segment is likely couples or solo travelers.
- Properties designed for 2 guests and 4 guests dominate the Bora-Bora STR market, accounting for 66.0% of listings.
- 15.5% of properties accommodate 6+ guests, serving the market segment for larger families or group travel in Bora-Bora.
- On average, properties in Bora-Bora are equipped to host 3.3 guests.
Bora-Bora Airbnb Booking Patterns (2026): Available vs. Booked Days
Available Days Distribution
Booked Days Distribution
Booking Pattern Insights for Bora-Bora
- The most common availability pattern in Bora-Bora falls within the 271-366 days range, representing 35.5% of listings. This suggests many properties have significant open periods on their calendars.
- Approximately 66.0% of listings show high availability (181+ days open annually), indicating potential for increased bookings or specific owner usage patterns.
- For booked days, the 91-180 days range is most frequent in Bora-Bora (30.5%), reflecting common guest stay durations or potential owner blocking patterns.
- A notable 35.0% of properties secure long booking periods (181+ days booked per year), highlighting successful long-term rental strategies or significant owner usage.
Bora-Bora Airbnb Minimum Stay Requirements Analysis
Distribution of Listings by Minimum Night Requirement
1 Night
60 listings
30% of total
2 Nights
73 listings
36.5% of total
3 Nights
20 listings
10% of total
4-6 Nights
1 listings
0.5% of total
30+ Nights
46 listings
23% of total
Key Insights
- The most prevalent minimum stay requirement in Bora-Bora is 2 Nights, adopted by 36.5% of listings. This highlights the market's preference for shorter, flexible bookings.
- A strong majority (66.5%) of the Bora-Bora Airbnb data shows acceptance of very short stays (1-2 nights), indicating a dynamic, high-turnover market.
- A significant segment (23%) caters to monthly stays (30+ nights) in Bora-Bora, pointing to opportunities in the extended-stay market.
Recommendations
- Align with the market by considering a 2 Nights minimum stay, as 36.5% of Bora-Bora hosts use this setting.
- Explore offering discounts for stays of 30+ nights to attract the 23% of the market seeking extended stays.
- Adjust minimum nights based on seasonality – potentially shorter during low season and longer during peak demand periods in Bora-Bora.
Bora-Bora Airbnb Cancellation Policy Trends Analysis (2026)
Limited
2 listings
1% of total
Super Strict 60 Days
5 listings
2.5% of total
Super Strict 30 Days
4 listings
2% of total
Flexible
23 listings
11.5% of total
Moderate
47 listings
23.5% of total
Firm
99 listings
49.5% of total
Strict
20 listings
10% of total
Cancellation Policy Insights for Bora-Bora
- The prevailing Airbnb cancellation policy trend in Bora-Bora is Firm, used by 49.5% of listings.
- A majority (59.5%) of hosts in Bora-Bora utilize Firm or Strict policies, indicating a market where hosts prioritize booking security.
Recommendations for Hosts
- Consider adopting a Firm policy to align with the 49.5% market standard in Bora-Bora.
- Using a Strict policy might deter some guests, as only 10% of listings use it. Evaluate if potential revenue protection outweighs possible lower booking rates.
- Regularly review your cancellation policy against competitors and market demand shifts in Bora-Bora.
Bora-Bora STR Booking Lead Time Analysis (2026)
Average Booking Lead Time by Month
Booking Lead Time Insights for Bora-Bora
- The overall average booking lead time for vacation rentals in Bora-Bora is 85 days.
- Guests book furthest in advance for stays during August (average 121 days), likely coinciding with peak travel demand or local events.
- The shortest booking windows occur for stays in February (average 60 days), indicating more last-minute travel plans during this time.
- Seasonally, Summer (106 days avg.) sees the longest lead times, while Winter (72 days avg.) has the shortest, reflecting typical travel planning cycles.
Recommendations for Hosts
- Use the overall average lead time (85 days) as a baseline for your pricing and availability strategy in Bora-Bora.
- For August stays, consider implementing length-of-stay discounts or slightly higher rates for bookings made less than 121 days out to capitalize on advance planning.
- Target marketing efforts for the Summer season well in advance (at least 106 days) to capture early planners.
- Monitor your own booking lead times against these Bora-Bora averages to identify opportunities for dynamic pricing adjustments.
Popular & Essential Airbnb Amenities in Bora-Bora (2026)
Amenity Prevalence
Amenity Insights for Bora-Bora
- Essential amenities in Bora-Bora that guests expect include: Wifi. Lacking these (this) could significantly impact bookings.
- Popular amenities like Kitchen, Air conditioning, Free parking on premises are common but not universal. Offering these can provide a competitive edge.
Recommendations for Hosts
- Ensure your listing includes all essential amenities for Bora-Bora: Wifi.
- Prioritize adding missing essentials: Wifi.
- Consider adding popular differentiators like Kitchen or Air conditioning to increase appeal.
- Highlight unique or less common amenities you offer (e.g., hot tub, dedicated workspace, EV charger) in your listing description and photos.
- Regularly check competitor amenities in Bora-Bora to stay competitive.
Bora-Bora Airbnb Guest Demographics & Profile Analysis (2026)
Guest Profile Summary for Bora-Bora
- The typical guest profile for Airbnb in Bora-Bora consists of a mix of domestic (46%) and international guests, with top international origins including United States, typically belonging to the Post-2000s (Gen Z/Alpha) group (50%), primarily speaking English or French.
- Domestic travelers account for 45.5% of guests.
- Key international markets include France (45.5%) and United States (23.1%).
- Top languages spoken are English (42.1%) followed by French (29.8%).
- A significant demographic segment is the Post-2000s (Gen Z/Alpha) group, representing 50% of guests.
Recommendations for Hosts
- Balance marketing efforts between domestic and international channels based on the guest mix.
- Tailor amenities and listing descriptions to appeal to the dominant Post-2000s (Gen Z/Alpha) demographic (e.g., highlight fast WiFi, smart home features, local guides).
- Highlight unique local experiences or amenities relevant to the primary guest profile.
- Consider seasonal promotions aligned with peak travel times for key origin markets.
Nearby Short-Term Rental Market Comparison
How does the Bora-Bora Airbnb market stack up against its neighbors? Compare key performance metrics like average monthly revenue, ADR, and occupancy rates in surrounding areas to understand the broader regional STR landscape.