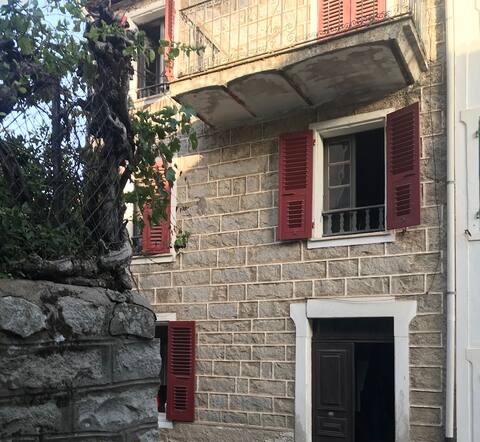
Évisa Airbnb Market Analysis 2026: Short Term Rental Data & Vacation Rental Statistics in Corsica, France
Is Airbnb profitable in Évisa in 2026? Explore comprehensive Airbnb analytics for Évisa, Corsica, France to uncover income potential. This 2026 STR market report for Évisa, based on AirROI data from February 2025 to January 2026, reveals key trends in the niche market of 20 active listings.
Whether you're considering an Airbnb investment in Évisa, optimizing your existing vacation rental, or exploring rental arbitrage opportunities, understanding the Évisa Airbnb data is crucial. Leveraging the low regulation environment is key to maximizing your short term rental income potential. Let's dive into the specifics.
Key Évisa Airbnb Performance Metrics Overview
Monthly Airbnb Revenue Variations & Income Potential in Évisa (2026)
Understanding the monthly revenue variations for Airbnb listings in Évisa is key to maximizing your short term rental income potential. Seasonality significantly impacts earnings. Our analysis, based on data from the past 12 months, shows that the peak revenue month for STRs in Évisa is typically August, while January often presents the lowest earnings, highlighting opportunities for strategic pricing adjustments during shoulder and low seasons. Explore the typical Airbnb income in Évisa across different performance tiers:
- Best-in-class properties (Top 10%) achieve $2,630+ monthly, often utilizing dynamic pricing and superior guest experiences.
- Strong performing properties (Top 25%) earn $1,632 or more, indicating effective management and desirable locations/amenities.
- Typical properties (Median) generate around $1,162 per month, representing the average market performance.
- Entry-level properties (Bottom 25%) see earnings around $671, often with potential for optimization.
Average Monthly Airbnb Earnings Trend in Évisa
Évisa Airbnb Occupancy Rate Trends (2026)
Maximize your bookings by understanding the Évisa STR occupancy trends. Seasonal demand shifts significantly influence how often properties are booked. Typically, Augustsees the highest demand (peak season occupancy), while January experiences the lowest (low season). Effective strategies, like adjusting minimum stays or offering promotions, can boost occupancy during slower periods. Here's how different property tiers perform in Évisa:
- Best-in-class properties (Top 10%) achieve 70%+ occupancy, indicating high desirability and potentially optimized availability.
- Strong performing properties (Top 25%) maintain 62% or higher occupancy, suggesting good market fit and guest satisfaction.
- Typical properties (Median) have an occupancy rate around 42%.
- Entry-level properties (Bottom 25%) average 22% occupancy, potentially facing higher vacancy.
Average Monthly Occupancy Rate Trend in Évisa
Average Daily Rate (ADR) Airbnb Trends in Évisa (2026)
Effective short term rental pricing strategy in Évisa involves understanding monthly ADR fluctuations. The Average Daily Rate (ADR) for Airbnb in Évisa typically peaks in August and dips lowest during December. Leveraging Airbnb dynamic pricing tools or strategies based on this seasonality can significantly boost revenue. Here's a look at the typical nightly rates achieved:
- Best-in-class properties (Top 10%) command rates of $184+ per night, often due to premium features or locations.
- Strong performing properties (Top 25%) achieve nightly rates of $128 or more.
- Typical properties (Median) charge around $102 per night.
- Entry-level properties (Bottom 25%) earn around $77 per night.
Average Daily Rate (ADR) Trend by Month in Évisa
Get Live Évisa Market Intelligence 👇

Explore Real-time Analytics
Airbnb Seasonality Analysis & Trends in Évisa (2026)
Peak Season (August, July, September)
- Revenue averages $2,041 per month
- Occupancy rates average 59.9%
- Daily rates average $119
Shoulder Season
- Revenue averages $1,328 per month
- Occupancy maintains around 44.1%
- Daily rates hold near $111
Low Season (January, November, December)
- Revenue drops to average $685 per month
- Occupancy decreases to average 26.3%
- Daily rates adjust to average $100
Seasonality Insights for Évisa
- The Airbnb seasonality in Évisa shows highly seasonal trends requiring careful strategy. While the sections above show seasonal averages, it's also insightful to look at the extremes:
- During the high season, the absolute peak month showcases Évisa's highest earning potential, with monthly revenues capable of climbing to $2,262, occupancy reaching a high of 61.5%, and ADRs peaking at $126.
- Conversely, the slowest single month of the year, typically falling within the low season, marks the market's lowest point. In this month, revenue might dip to $481, occupancy could drop to 18.6%, and ADRs may adjust down to $100.
- Understanding both the seasonal averages and these monthly peaks and troughs in revenue, occupancy, and ADR is crucial for maximizing your Airbnb profit potential in Évisa.
Seasonal Strategies for Maximizing Profit
- Peak Season: Maximize revenue through premium pricing and potentially longer minimum stays. Ensure high availability.
- Low Season: Offer competitive pricing, special promotions (e.g., extended stay discounts), and flexible cancellation policies. Target off-season travelers like remote workers or budget-conscious guests.
- Shoulder Seasons: Implement dynamic pricing that balances peak and low rates. Target weekend travelers or specific events. Offer slightly more flexible terms than peak season.
- Regularly analyze your own performance against these Évisa seasonality benchmarks and adjust your pricing and availability strategy accordingly.
Best Areas for Airbnb Investment in Évisa (2026)
Exploring the top neighborhoods for short-term rentals in Évisa? This section highlights key areas, outlining why they are attractive for hosts and guests, along with notable local attractions. Consider these locations based on your target guest profile and investment strategy.
| Neighborhood / Area | Why Host Here? (Target Guests & Appeal) | Key Attractions & Landmarks |
|---|---|---|
| Port d'Évisa | Charming harbor area known for its picturesque views and proximity to local restaurants and shops. Ideal for travelers seeking a relaxing atmosphere with access to water activities. | Évisa Marina, La Plage de Porto, Hiking Trails, Local Seafood Restaurants |
| Les Calanches | Breathtaking natural scenery with striking rock formations and coastal views. A popular spot for hikers and nature lovers, perfect for those seeking adventure. | Calanche de Piana, Hiking Trails, Scenic Viewpoints, Boat Tours |
| Évisa Village | Quaint village in the mountains known for its traditional Corsican architecture and stunning views. Attractive to visitors wanting an authentic and tranquil Corsican experience. | Local Craft Shops, Corsican Cuisine, Hiking Paths, Cultural Festivals |
| Cascades des Anglais | A beautiful natural site featuring stunning waterfalls and lush surroundings, ideal for visitors looking for a scenic escape and nature activities. | Waterfall Hikes, Picnic Areas, Wildlife Watching |
| Col de Vergio | High mountain pass offering panoramic views and access to ski resorts in winter and hiking in summer. Great for outdoor enthusiasts year-round. | Ski Resorts, Hiking Trails, Nature Reserves |
| Platja de Porto | Beautiful beach area known for its clear waters and soft sand, perfect for sunbathing and swimming, catering to families and beach lovers. | Beach Activities, Swimming, Water Sports, Restaurants Nearby |
| Nature Reserve of Scandola | A UNESCO World Heritage site known for its unique biodiversity and stunning landscapes, attracting eco-tourists and nature lovers. | Boat Tours, Wildlife Viewing, Hiking, Scenic Views |
| Gorges de Spelunca | Spectacular gorge offering dramatic landscapes and hiking opportunities, popular with adventure seekers and nature lovers. | Hiking Trails, Canyon Views, Natural Rock Formations |
Understanding Airbnb License Requirements & STR Laws in Évisa (2026)
While Évisa, Corsica, France currently shows low STR regulations, specific Airbnb license requirements might still exist or change. Always verify the latest short term rental regulations and Airbnb license requirements directly with local government authorities for Évisa to ensure full compliance before hosting.
(Source: AirROI data, 2026, based on 5% licensed listings)
Top Performing Airbnb Properties in Évisa (2026)
Benchmark your potential! Explore examples of top-performing Airbnb properties in Évisabased on Trailing Twelve Month (TTM) revenue. Analyze their characteristics, revenue, occupancy rate, and ADR to understand what drives success in this market.

Casa Lucia Evisa
Entire Place • 2 bedrooms

Bed and breakfast: A Tiusella
Private Room • N/A

Bed and breakfast: A Tiusella
Private Room • N/A
Evisa village house "chez Minouchette"
Entire Place • 4 bedrooms
Room for 2 people in Evisa!
Private Room • 1 bedroom
Charming room in Evisa
Private Room • 1 bedroom
Note: Performance varies based on location, size, amenities, seasonality, and management quality. Data reflects the past 12 months.
Top Performing Airbnb Hosts in Évisa (2026)
Learn from the best! This table showcases top-performing Airbnb hosts in Évisa based on the number of properties managed and estimated total revenue over the past year. Analyze their scale and performance metrics.
| Host Name | Properties | Grossing Revenue | Stay Reviews | Avg Rating |
|---|---|---|---|---|
| Catherine | 2 | $37,873 | 287 | 4.84/5.0 |
| Christophe | 1 | $37,032 | 16 | 5.00/5.0 |
| Frederic | 2 | $28,012 | 31 | 4.93/5.0 |
| Le Belvedere | 4 | $27,282 | 262 | 4.89/5.0 |
| Alexia | 1 | $15,875 | 50 | 4.78/5.0 |
| Pascale | 1 | $13,521 | 51 | 4.75/5.0 |
| Patrice | 1 | $9,519 | 67 | 4.70/5.0 |
| Clarisse | 1 | $8,004 | 89 | 4.45/5.0 |
| Delphine | 1 | $7,734 | 18 | 4.56/5.0 |
| Véronique Et Richard | 1 | $6,879 | 2 | Not Rated |
Analyzing the strategies of top hosts, such as their property selection, pricing, and guest communication, can offer valuable lessons for optimizing your own Airbnb operations in Évisa.
Dive Deeper: Advanced Évisa STR Market Data (2026)
Ready to unlock more insights? AirROI provides access to advanced metrics and comprehensive Airbnb data for Évisa. Explore detailed analytics beyond this report to refine your investment strategy, optimize pricing, and maximize your vacation rental profits.
Explore Advanced MetricsÉvisa Short-Term Rental Market Composition (2026): Property & Room Types
Room Type Distribution
Property Type Distribution
Market Composition Insights for Évisa
- The Évisa Airbnb market composition is heavily skewed towards Entire Home/Apt listings, which make up 80% of the 20 active rentals. This indicates strong guest preference for privacy and space.
- Looking at the property type distribution in Évisa, House properties are the most common (50%), reflecting the local real estate landscape.
- Houses represent a significant 50% portion, catering likely to families or larger groups.
- The presence of 20% Hotel/Boutique listings indicates integration with traditional hospitality.
Évisa Airbnb Room Capacity Analysis (2026): Bedroom Distribution
Distribution of Listings by Number of Bedrooms
Room Capacity Insights for Évisa
- The dominant room capacity in Évisa is 2 bedrooms listings, making up 45% of the market. This suggests a strong demand for properties suitable for couples or solo travelers.
- Together, 2 bedrooms and 1 bedroom properties represent 75.0% of the active Airbnb listings in Évisa, indicating a high concentration in these sizes.
Évisa Vacation Rental Guest Capacity Trends (2026)
Distribution of Listings by Guest Capacity
Guest Capacity Insights for Évisa
- The most common guest capacity trend in Évisa vacation rentals is listings accommodating 2 guests (30%). This suggests the primary traveler segment is likely couples or solo travelers.
- Properties designed for 2 guests and 4 guests dominate the Évisa STR market, accounting for 55.0% of listings.
- 25.0% of properties accommodate 6+ guests, serving the market segment for larger families or group travel in Évisa.
- On average, properties in Évisa are equipped to host 3.8 guests.
Évisa Airbnb Booking Patterns (2026): Available vs. Booked Days
Available Days Distribution
Booked Days Distribution
Booking Pattern Insights for Évisa
- The most common availability pattern in Évisa falls within the 271-366 days range, representing 50% of listings. This suggests many properties have significant open periods on their calendars.
- Approximately 90.0% of listings show high availability (181+ days open annually), indicating potential for increased bookings or specific owner usage patterns.
- For booked days, the 91-180 days range is most frequent in Évisa (40%), reflecting common guest stay durations or potential owner blocking patterns.
- A notable 10.0% of properties secure long booking periods (181+ days booked per year), highlighting successful long-term rental strategies or significant owner usage.
Évisa Airbnb Minimum Stay Requirements Analysis
Distribution of Listings by Minimum Night Requirement
1 Night
4 listings
20% of total
2 Nights
2 listings
10% of total
3 Nights
2 listings
10% of total
4-6 Nights
7 listings
35% of total
7-29 Nights
3 listings
15% of total
30+ Nights
2 listings
10% of total
Key Insights
- The most prevalent minimum stay requirement in Évisa is 4-6 Nights, adopted by 35% of listings. This highlights the market's preference for longer commitments.
Recommendations
- Align with the market by considering a 4-6 Nights minimum stay, as 35% of Évisa hosts use this setting.
- If feasible, allowing 1-night stays, especially midweek or during low season, could capture last-minute bookings, as only 20% currently do.
- Explore offering discounts for stays of 30+ nights to attract the 10% of the market seeking extended stays.
- Adjust minimum nights based on seasonality – potentially shorter during low season and longer during peak demand periods in Évisa.
Évisa Airbnb Cancellation Policy Trends Analysis (2026)
Flexible
9 listings
45% of total
Moderate
2 listings
10% of total
Firm
5 listings
25% of total
Strict
4 listings
20% of total
Cancellation Policy Insights for Évisa
- The prevailing Airbnb cancellation policy trend in Évisa is Flexible, used by 45% of listings.
- There's a relatively balanced mix between guest-friendly (55.0%) and stricter (45.0%) policies, offering choices for different guest needs.
Recommendations for Hosts
- Consider adopting a Flexible policy to align with the 45% market standard in Évisa.
- Regularly review your cancellation policy against competitors and market demand shifts in Évisa.
Évisa STR Booking Lead Time Analysis (2026)
Average Booking Lead Time by Month
Booking Lead Time Insights for Évisa
- The overall average booking lead time for vacation rentals in Évisa is 86 days.
- Guests book furthest in advance for stays during February (average 138 days), likely coinciding with peak travel demand or local events.
- The shortest booking windows occur for stays in January (average 1 days), indicating more last-minute travel plans during this time.
- Seasonally, Spring (89 days avg.) sees the longest lead times, while Winter (49 days avg.) has the shortest, reflecting typical travel planning cycles.
Recommendations for Hosts
- Use the overall average lead time (86 days) as a baseline for your pricing and availability strategy in Évisa.
- For February stays, consider implementing length-of-stay discounts or slightly higher rates for bookings made less than 138 days out to capitalize on advance planning.
- During January, focus on last-minute booking availability and promotions, as guests book with very short notice (1 days avg.).
- Target marketing efforts for the Spring season well in advance (at least 89 days) to capture early planners.
- Monitor your own booking lead times against these Évisa averages to identify opportunities for dynamic pricing adjustments.
Popular & Essential Airbnb Amenities in Évisa (2026)
Amenity Prevalence
Amenity Insights for Évisa
- Popular amenities like Washer, Hangers, Kitchen are common but not universal. Offering these can provide a competitive edge.
Recommendations for Hosts
- Consider adding popular differentiators like Washer or Hangers to increase appeal.
- Highlight unique or less common amenities you offer (e.g., hot tub, dedicated workspace, EV charger) in your listing description and photos.
- Regularly check competitor amenities in Évisa to stay competitive.
Évisa Airbnb Guest Demographics & Profile Analysis (2026)
Guest Profile Summary for Évisa
- The typical guest profile for Airbnb in Évisa consists of primarily domestic travelers (72%), often arriving from nearby Paris, typically belonging to the Post-2000s (Gen Z/Alpha) group (50%), primarily speaking French or English.
- Domestic travelers account for 72.2% of guests.
- Key international markets include France (72.2%) and Switzerland (6.5%).
- Top languages spoken are French (36.3%) followed by English (36.3%).
- A significant demographic segment is the Post-2000s (Gen Z/Alpha) group, representing 50% of guests.
Recommendations for Hosts
- Target domestic marketing efforts towards travelers from Paris and Bordeaux.
- Tailor amenities and listing descriptions to appeal to the dominant Post-2000s (Gen Z/Alpha) demographic (e.g., highlight fast WiFi, smart home features, local guides).
- Highlight unique local experiences or amenities relevant to the primary guest profile.
- Consider seasonal promotions aligned with peak travel times for key origin markets.
Nearby Short-Term Rental Market Comparison
How does the Évisa Airbnb market stack up against its neighbors? Compare key performance metrics like average monthly revenue, ADR, and occupancy rates in surrounding areas to understand the broader regional STR landscape.
| Market | Active Properties | Monthly Revenue | Daily Rate | Avg. Occupancy |
|---|---|---|---|---|
| Saint-Jean-Cap-Ferrat | 114 | $3,894 | $465.00 | 44% |
| Porto Cervo | 195 | $3,256 | $555.32 | 40% |
| Monaco | 193 | $3,208 | $490.13 | 36% |
| Villefranche-sur-Mer | 494 | $3,095 | $295.76 | 50% |
| Tourrettes-sur-Loup | 168 | $3,021 | $399.67 | 44% |
| Èze | 167 | $2,961 | $366.26 | 44% |
| Cap-d'Ail | 208 | $2,898 | $353.36 | 42% |
| Falicon | 17 | $2,877 | $429.86 | 38% |
| Beausoleil | 654 | $2,820 | $281.81 | 45% |
| Saint-Paul-de-Vence | 158 | $2,762 | $361.67 | 41% |