Olmeto Airbnb Market Analysis 2026: Short Term Rental Data & Vacation Rental Statistics in Corsica, France
Is Airbnb profitable in Olmeto in 2026? Explore comprehensive Airbnb analytics for Olmeto, Corsica, France to uncover income potential. This 2026 STR market report for Olmeto, based on AirROI data from February 2025 to January 2026, reveals key trends in the market of 288 active listings.
Whether you're considering an Airbnb investment in Olmeto, optimizing your existing vacation rental, or exploring rental arbitrage opportunities, understanding the Olmeto Airbnb data is crucial. Leveraging the low regulation environment is key to maximizing your short term rental income potential. Let's dive into the specifics.
Key Olmeto Airbnb Performance Metrics Overview
Monthly Airbnb Revenue Variations & Income Potential in Olmeto (2026)
Understanding the monthly revenue variations for Airbnb listings in Olmeto is key to maximizing your short term rental income potential. Seasonality significantly impacts earnings. Our analysis, based on data from the past 12 months, shows that the peak revenue month for STRs in Olmeto is typically August, while January often presents the lowest earnings, highlighting opportunities for strategic pricing adjustments during shoulder and low seasons. Explore the typical Airbnb income in Olmeto across different performance tiers:
- Best-in-class properties (Top 10%) achieve $5,792+ monthly, often utilizing dynamic pricing and superior guest experiences.
- Strong performing properties (Top 25%) earn $2,887 or more, indicating effective management and desirable locations/amenities.
- Typical properties (Median) generate around $1,668 per month, representing the average market performance.
- Entry-level properties (Bottom 25%) see earnings around $866, often with potential for optimization.
Average Monthly Airbnb Earnings Trend in Olmeto
Olmeto Airbnb Occupancy Rate Trends (2026)
Maximize your bookings by understanding the Olmeto STR occupancy trends. Seasonal demand shifts significantly influence how often properties are booked. Typically, Augustsees the highest demand (peak season occupancy), while February experiences the lowest (low season). Effective strategies, like adjusting minimum stays or offering promotions, can boost occupancy during slower periods. Here's how different property tiers perform in Olmeto:
- Best-in-class properties (Top 10%) achieve 71%+ occupancy, indicating high desirability and potentially optimized availability.
- Strong performing properties (Top 25%) maintain 58% or higher occupancy, suggesting good market fit and guest satisfaction.
- Typical properties (Median) have an occupancy rate around 38%.
- Entry-level properties (Bottom 25%) average 20% occupancy, potentially facing higher vacancy.
Average Monthly Occupancy Rate Trend in Olmeto
Average Daily Rate (ADR) Airbnb Trends in Olmeto (2026)
Effective short term rental pricing strategy in Olmeto involves understanding monthly ADR fluctuations. The Average Daily Rate (ADR) for Airbnb in Olmeto typically peaks in August and dips lowest during April. Leveraging Airbnb dynamic pricing tools or strategies based on this seasonality can significantly boost revenue. Here's a look at the typical nightly rates achieved:
- Best-in-class properties (Top 10%) command rates of $470+ per night, often due to premium features or locations.
- Strong performing properties (Top 25%) achieve nightly rates of $257 or more.
- Typical properties (Median) charge around $144 per night.
- Entry-level properties (Bottom 25%) earn around $102 per night.
Average Daily Rate (ADR) Trend by Month in Olmeto
Get Live Olmeto Market Intelligence 👇

Explore Real-time Analytics
Airbnb Seasonality Analysis & Trends in Olmeto (2026)
Peak Season (August, July, June)
- Revenue averages $4,602 per month
- Occupancy rates average 58.9%
- Daily rates average $264
Shoulder Season
- Revenue averages $2,364 per month
- Occupancy maintains around 40.6%
- Daily rates hold near $214
Low Season (January, February, December)
- Revenue drops to average $1,011 per month
- Occupancy decreases to average 16.4%
- Daily rates adjust to average $221
Seasonality Insights for Olmeto
- The Airbnb seasonality in Olmeto shows highly seasonal trends requiring careful strategy. While the sections above show seasonal averages, it's also insightful to look at the extremes:
- During the high season, the absolute peak month showcases Olmeto's highest earning potential, with monthly revenues capable of climbing to $5,751, occupancy reaching a high of 69.9%, and ADRs peaking at $276.
- Conversely, the slowest single month of the year, typically falling within the low season, marks the market's lowest point. In this month, revenue might dip to $928, occupancy could drop to 15.2%, and ADRs may adjust down to $203.
- Understanding both the seasonal averages and these monthly peaks and troughs in revenue, occupancy, and ADR is crucial for maximizing your Airbnb profit potential in Olmeto.
Seasonal Strategies for Maximizing Profit
- Peak Season: Maximize revenue through premium pricing and potentially longer minimum stays. Ensure high availability.
- Low Season: Offer competitive pricing, special promotions (e.g., extended stay discounts), and flexible cancellation policies. Target off-season travelers like remote workers or budget-conscious guests.
- Shoulder Seasons: Implement dynamic pricing that balances peak and low rates. Target weekend travelers or specific events. Offer slightly more flexible terms than peak season.
- Regularly analyze your own performance against these Olmeto seasonality benchmarks and adjust your pricing and availability strategy accordingly.
Best Areas for Airbnb Investment in Olmeto (2026)
Exploring the top neighborhoods for short-term rentals in Olmeto? This section highlights key areas, outlining why they are attractive for hosts and guests, along with notable local attractions. Consider these locations based on your target guest profile and investment strategy.
| Neighborhood / Area | Why Host Here? (Target Guests & Appeal) | Key Attractions & Landmarks |
|---|---|---|
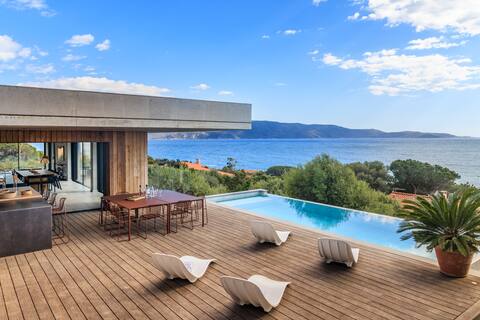
| Plage d'Olmeto | A stunning beach area known for its clear waters and golden sands. Ideal for tourists seeking relaxation and sunbathing, with nearby beachfront restaurants and activities. | Le Roc des Gozzi, Plage de Baracci, Scenic coastal walks, Water sports activities, Local seafood restaurants |
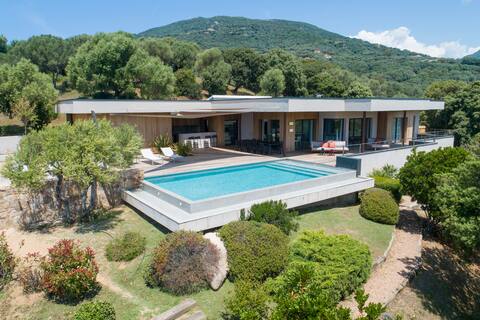
| Olmeto Village | A picturesque village perched on a hill, offering a blend of traditional Corsican architecture and stunning views of the coastline. Great for travelers seeking an authentic cultural experience. | Historic church of Saint George, Local artisan shops, Unique panoramic views, Corsican cuisine experiences, Cultural festivals |
| Campa di u Figu | A tranquil rural area near Olmeto, perfect for nature lovers and those looking to escape the hustle and bustle. Offers hiking and outdoor activities, attracting visitors looking for peace. | Hiking trails, Olive groves, Scenic nature spots, Wildlife observation, Traditional Corsican landscapes |
| Propriano | A nearby town known for its vibrant harbor and lively atmosphere. Offers various dining, shopping, and entertainment options, making it attractive for tourists looking for activities. | Propriano Marina, Local markets, Beaches with restaurants, Cultural events, Water sports opportunities |
| Calo de foïta | A secluded beach area popular for its natural beauty and calm waters, ideal for families and couples. Attracts visitors looking to unwind in a peaceful environment. | Calo de foïta beach, Snorkeling spots, Beachside cafés, Quiet picnic areas, Scenic cliffs |
| Montage de Coti | A mountainous area offering stunning views and opportunities for hiking and exploration. Great for tourists who enjoy outdoor adventures and scenic landscapes. | Hiking trails, Breathtaking vistas, Flora and fauna diversity, Photography spots, Outdoor picnic areas |
| Les Bains de Baracci | A well-known thermal resort with wellness options. Attracts visitors looking for relaxation and rejuvenation, making it a great spot for health-oriented tourism. | Thermal baths, Wellness treatments, Spa facilities, Natural hot springs, Relaxation spaces |
| Sartène | A historic town with rich Corsican culture and heritage. Offers a captivating glimpse into the island's past, perfect for tourists interested in history and culture. | Sartène historical center, Museums, Local festivals, Traditional Corsican architecture, Shopping for local crafts |
Understanding Airbnb License Requirements & STR Laws in Olmeto (2026)
While Olmeto, Corsica, France currently shows low STR regulations, specific Airbnb license requirements might still exist or change. Always verify the latest short term rental regulations and Airbnb license requirements directly with local government authorities for Olmeto to ensure full compliance before hosting.
(Source: AirROI data, 2026, based on 7% licensed listings)
Top Performing Airbnb Properties in Olmeto (2026)
Benchmark your potential! Explore examples of top-performing Airbnb properties in Olmetobased on Trailing Twelve Month (TTM) revenue. Analyze their characteristics, revenue, occupancy rate, and ADR to understand what drives success in this market.
CASA NINA sea view beach access heated pool
Entire Place • 5 bedrooms

MIRAY Luxury Villa: Pool, Beach within Walking Distance, View
Entire Place • 5 bedrooms
Casa Leone - Waterfront Villa
Entire Place • 5 bedrooms

Casa Lilia 8 pax sea view heated pool and spa
Entire Place • 4 bedrooms
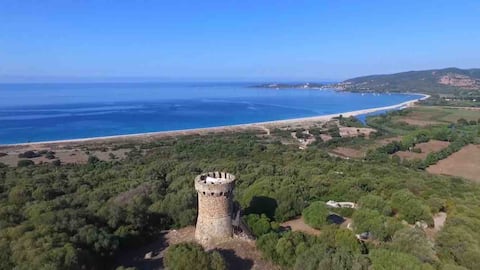
Genoese Tower of Micalona Domaine de l'Ogliastru
Entire Place • 3 bedrooms

Villa with large heated pool and sea view
Entire Place • 2 bedrooms
Note: Performance varies based on location, size, amenities, seasonality, and management quality. Data reflects the past 12 months.
Top Performing Airbnb Hosts in Olmeto (2026)
Learn from the best! This table showcases top-performing Airbnb hosts in Olmeto based on the number of properties managed and estimated total revenue over the past year. Analyze their scale and performance metrics.
| Host Name | Properties | Grossing Revenue | Stay Reviews | Avg Rating |
|---|---|---|---|---|
| Thierry | 6 | $533,227 | 517 | 4.94/5.0 |
| Myriam | 13 | $342,618 | 596 | 4.83/5.0 |
| Muriel | 7 | $242,057 | 156 | 4.95/5.0 |
| Laetitia | 11 | $207,601 | 218 | 4.92/5.0 |
| Jenny | 2 | $183,404 | 60 | 4.99/5.0 |
| Florent | 2 | $176,191 | 74 | 4.83/5.0 |
| Pierrine | 1 | $140,771 | 21 | 5.00/5.0 |
| Mélanie | 6 | $139,421 | 198 | 4.93/5.0 |
| Daniel | 7 | $126,739 | 289 | 4.69/5.0 |
| Marie Pierre | 1 | $122,177 | 47 | 5.00/5.0 |
Analyzing the strategies of top hosts, such as their property selection, pricing, and guest communication, can offer valuable lessons for optimizing your own Airbnb operations in Olmeto.
Dive Deeper: Advanced Olmeto STR Market Data (2026)
Ready to unlock more insights? AirROI provides access to advanced metrics and comprehensive Airbnb data for Olmeto. Explore detailed analytics beyond this report to refine your investment strategy, optimize pricing, and maximize your vacation rental profits.
Explore Advanced MetricsOlmeto Short-Term Rental Market Composition (2026): Property & Room Types
Room Type Distribution
Property Type Distribution
Market Composition Insights for Olmeto
- The Olmeto Airbnb market composition is heavily skewed towards Entire Home/Apt listings, which make up 97.9% of the 288 active rentals. This indicates strong guest preference for privacy and space.
- Looking at the property type distribution in Olmeto, House properties are the most common (58.3%), reflecting the local real estate landscape.
- Houses represent a significant 58.3% portion, catering likely to families or larger groups.
- Smaller segments like hotel/boutique, outdoor/unique, unique stays (combined 5.9%) offer potential for unique stay experiences.
Olmeto Airbnb Room Capacity Analysis (2026): Bedroom Distribution
Distribution of Listings by Number of Bedrooms
Room Capacity Insights for Olmeto
- The dominant room capacity in Olmeto is 2 bedrooms listings, making up 35.4% of the market. This suggests a strong demand for properties suitable for couples or solo travelers.
- Together, 2 bedrooms and 1 bedroom properties represent 63.5% of the active Airbnb listings in Olmeto, indicating a high concentration in these sizes.
- A significant 29.9% of listings offer 3+ bedrooms, catering to larger groups and families seeking more space in Olmeto.
Olmeto Vacation Rental Guest Capacity Trends (2026)
Distribution of Listings by Guest Capacity
Guest Capacity Insights for Olmeto
- The most common guest capacity trend in Olmeto vacation rentals is listings accommodating 4 guests (38.9%). This suggests the primary traveler segment is likely small families or groups.
- Properties designed for 4 guests and 6 guests dominate the Olmeto STR market, accounting for 56.3% of listings.
- 36.1% of properties accommodate 6+ guests, serving the market segment for larger families or group travel in Olmeto.
- On average, properties in Olmeto are equipped to host 4.8 guests.
Olmeto Airbnb Booking Patterns (2026): Available vs. Booked Days
Available Days Distribution
Booked Days Distribution
Booking Pattern Insights for Olmeto
- The most common availability pattern in Olmeto falls within the 271-366 days range, representing 59.7% of listings. This suggests many properties have significant open periods on their calendars.
- Approximately 89.6% of listings show high availability (181+ days open annually), indicating potential for increased bookings or specific owner usage patterns.
- For booked days, the 31-90 days range is most frequent in Olmeto (32.6%), reflecting common guest stay durations or potential owner blocking patterns.
- A notable 10.7% of properties secure long booking periods (181+ days booked per year), highlighting successful long-term rental strategies or significant owner usage.
Olmeto Airbnb Minimum Stay Requirements Analysis
Distribution of Listings by Minimum Night Requirement
1 Night
16 listings
5.6% of total
2 Nights
7 listings
2.4% of total
3 Nights
24 listings
8.3% of total
4-6 Nights
97 listings
33.7% of total
7-29 Nights
50 listings
17.4% of total
30+ Nights
94 listings
32.6% of total
Key Insights
- The most prevalent minimum stay requirement in Olmeto is 4-6 Nights, adopted by 33.7% of listings. This highlights the market's preference for longer commitments.
- Very short stays (1-2 nights) are less common (8.0%), suggesting hosts prefer slightly longer bookings to optimize turnover.
- A significant segment (32.6%) caters to monthly stays (30+ nights) in Olmeto, pointing to opportunities in the extended-stay market.
Recommendations
- Align with the market by considering a 4-6 Nights minimum stay, as 33.7% of Olmeto hosts use this setting.
- If feasible, allowing 1-night stays, especially midweek or during low season, could capture last-minute bookings, as only 5.6% currently do.
- Explore offering discounts for stays of 30+ nights to attract the 32.6% of the market seeking extended stays.
- Adjust minimum nights based on seasonality – potentially shorter during low season and longer during peak demand periods in Olmeto.
Olmeto Airbnb Cancellation Policy Trends Analysis (2026)
Super Strict 30 Days
4 listings
1.4% of total
Super Strict 60 Days
2 listings
0.7% of total
Flexible
51 listings
17.7% of total
Moderate
24 listings
8.3% of total
Firm
131 listings
45.5% of total
Strict
76 listings
26.4% of total
Cancellation Policy Insights for Olmeto
- The prevailing Airbnb cancellation policy trend in Olmeto is Firm, used by 45.5% of listings.
- A majority (71.9%) of hosts in Olmeto utilize Firm or Strict policies, indicating a market where hosts prioritize booking security.
Recommendations for Hosts
- Consider adopting a Firm policy to align with the 45.5% market standard in Olmeto.
- Regularly review your cancellation policy against competitors and market demand shifts in Olmeto.
Olmeto STR Booking Lead Time Analysis (2026)
Average Booking Lead Time by Month
Booking Lead Time Insights for Olmeto
- The overall average booking lead time for vacation rentals in Olmeto is 90 days.
- Guests book furthest in advance for stays during August (average 124 days), likely coinciding with peak travel demand or local events.
- The shortest booking windows occur for stays in December (average 29 days), indicating more last-minute travel plans during this time.
- Seasonally, Summer (111 days avg.) sees the longest lead times, while Winter (38 days avg.) has the shortest, reflecting typical travel planning cycles.
Recommendations for Hosts
- Use the overall average lead time (90 days) as a baseline for your pricing and availability strategy in Olmeto.
- For August stays, consider implementing length-of-stay discounts or slightly higher rates for bookings made less than 124 days out to capitalize on advance planning.
- Target marketing efforts for the Summer season well in advance (at least 111 days) to capture early planners.
- Monitor your own booking lead times against these Olmeto averages to identify opportunities for dynamic pricing adjustments.
Popular & Essential Airbnb Amenities in Olmeto (2026)
Amenity Prevalence
Amenity Insights for Olmeto
- Popular amenities like Kitchen, Free parking on premises, Washer are common but not universal. Offering these can provide a competitive edge.
Recommendations for Hosts
- Consider adding popular differentiators like Kitchen or Free parking on premises to increase appeal.
- Highlight unique or less common amenities you offer (e.g., hot tub, dedicated workspace, EV charger) in your listing description and photos.
- Regularly check competitor amenities in Olmeto to stay competitive.
Olmeto Airbnb Guest Demographics & Profile Analysis (2026)
Guest Profile Summary for Olmeto
- The typical guest profile for Airbnb in Olmeto consists of primarily domestic travelers (70%), often arriving from nearby Paris, typically belonging to the Post-2000s (Gen Z/Alpha) group (50%), primarily speaking French or English.
- Domestic travelers account for 69.5% of guests.
- Key international markets include France (69.5%) and Germany (9.9%).
- Top languages spoken are French (38%) followed by English (34.3%).
- A significant demographic segment is the Post-2000s (Gen Z/Alpha) group, representing 50% of guests.
Recommendations for Hosts
- Target domestic marketing efforts towards travelers from Paris and Nantes.
- Tailor amenities and listing descriptions to appeal to the dominant Post-2000s (Gen Z/Alpha) demographic (e.g., highlight fast WiFi, smart home features, local guides).
- Highlight unique local experiences or amenities relevant to the primary guest profile.
- Consider seasonal promotions aligned with peak travel times for key origin markets.
Nearby Short-Term Rental Market Comparison
How does the Olmeto Airbnb market stack up against its neighbors? Compare key performance metrics like average monthly revenue, ADR, and occupancy rates in surrounding areas to understand the broader regional STR landscape.
| Market | Active Properties | Monthly Revenue | Daily Rate | Avg. Occupancy |
|---|---|---|---|---|
| Porto Cervo | 195 | $3,256 | $555.32 | 40% |
| Poltu Quatu | 53 | $2,363 | $299.65 | 43% |
| Alzachèna/Arzachena | 341 | $2,156 | $337.95 | 42% |
| Lecci | 596 | $2,094 | $281.02 | 45% |
| Zonza | 761 | $2,049 | $304.05 | 42% |
| Baja Sardinia | 123 | $2,046 | $307.54 | 42% |
| Pittulongu | 22 | $2,036 | $399.40 | 45% |
| Golfo Aranci | 36 | $1,963 | $362.29 | 46% |
| Sotta | 189 | $1,917 | $205.74 | 51% |
| Bonifacio / Bunifaziu | 527 | $1,892 | $237.98 | 46% |