Corbara Airbnb Market Analysis 2026: Short Term Rental Data & Vacation Rental Statistics in Corsica, France
Is Airbnb profitable in Corbara in 2026? Explore comprehensive Airbnb analytics for Corbara, Corsica, France to uncover income potential. This 2026 STR market report for Corbara, based on AirROI data from February 2025 to January 2026, reveals key trends in the niche market of 179 active listings.
Whether you're considering an Airbnb investment in Corbara, optimizing your existing vacation rental, or exploring rental arbitrage opportunities, understanding the Corbara Airbnb data is crucial. Leveraging the low regulation environment is key to maximizing your short term rental income potential. Let's dive into the specifics.
Key Corbara Airbnb Performance Metrics Overview
Monthly Airbnb Revenue Variations & Income Potential in Corbara (2026)
Understanding the monthly revenue variations for Airbnb listings in Corbara is key to maximizing your short term rental income potential. Seasonality significantly impacts earnings. Our analysis, based on data from the past 12 months, shows that the peak revenue month for STRs in Corbara is typically August, while February often presents the lowest earnings, highlighting opportunities for strategic pricing adjustments during shoulder and low seasons. Explore the typical Airbnb income in Corbara across different performance tiers:
- Best-in-class properties (Top 10%) achieve $6,999+ monthly, often utilizing dynamic pricing and superior guest experiences.
- Strong performing properties (Top 25%) earn $3,540 or more, indicating effective management and desirable locations/amenities.
- Typical properties (Median) generate around $1,888 per month, representing the average market performance.
- Entry-level properties (Bottom 25%) see earnings around $998, often with potential for optimization.
Average Monthly Airbnb Earnings Trend in Corbara
Corbara Airbnb Occupancy Rate Trends (2026)
Maximize your bookings by understanding the Corbara STR occupancy trends. Seasonal demand shifts significantly influence how often properties are booked. Typically, Augustsees the highest demand (peak season occupancy), while January experiences the lowest (low season). Effective strategies, like adjusting minimum stays or offering promotions, can boost occupancy during slower periods. Here's how different property tiers perform in Corbara:
- Best-in-class properties (Top 10%) achieve 70%+ occupancy, indicating high desirability and potentially optimized availability.
- Strong performing properties (Top 25%) maintain 55% or higher occupancy, suggesting good market fit and guest satisfaction.
- Typical properties (Median) have an occupancy rate around 36%.
- Entry-level properties (Bottom 25%) average 19% occupancy, potentially facing higher vacancy.
Average Monthly Occupancy Rate Trend in Corbara
Average Daily Rate (ADR) Airbnb Trends in Corbara (2026)
Effective short term rental pricing strategy in Corbara involves understanding monthly ADR fluctuations. The Average Daily Rate (ADR) for Airbnb in Corbara typically peaks in July and dips lowest during February. Leveraging Airbnb dynamic pricing tools or strategies based on this seasonality can significantly boost revenue. Here's a look at the typical nightly rates achieved:
- Best-in-class properties (Top 10%) command rates of $557+ per night, often due to premium features or locations.
- Strong performing properties (Top 25%) achieve nightly rates of $364 or more.
- Typical properties (Median) charge around $177 per night.
- Entry-level properties (Bottom 25%) earn around $111 per night.
Average Daily Rate (ADR) Trend by Month in Corbara
Get Live Corbara Market Intelligence 👇

Explore Real-time Analytics
Airbnb Seasonality Analysis & Trends in Corbara (2026)
Peak Season (August, July, June)
- Revenue averages $5,414 per month
- Occupancy rates average 60.9%
- Daily rates average $297
Shoulder Season
- Revenue averages $2,568 per month
- Occupancy maintains around 38.3%
- Daily rates hold near $258
Low Season (January, February, December)
- Revenue drops to average $1,142 per month
- Occupancy decreases to average 17.6%
- Daily rates adjust to average $254
Seasonality Insights for Corbara
- The Airbnb seasonality in Corbara shows highly seasonal trends requiring careful strategy. While the sections above show seasonal averages, it's also insightful to look at the extremes:
- During the high season, the absolute peak month showcases Corbara's highest earning potential, with monthly revenues capable of climbing to $6,789, occupancy reaching a high of 74.6%, and ADRs peaking at $307.
- Conversely, the slowest single month of the year, typically falling within the low season, marks the market's lowest point. In this month, revenue might dip to $972, occupancy could drop to 14.5%, and ADRs may adjust down to $242.
- Understanding both the seasonal averages and these monthly peaks and troughs in revenue, occupancy, and ADR is crucial for maximizing your Airbnb profit potential in Corbara.
Seasonal Strategies for Maximizing Profit
- Peak Season: Maximize revenue through premium pricing and potentially longer minimum stays. Ensure high availability.
- Low Season: Offer competitive pricing, special promotions (e.g., extended stay discounts), and flexible cancellation policies. Target off-season travelers like remote workers or budget-conscious guests.
- Shoulder Seasons: Implement dynamic pricing that balances peak and low rates. Target weekend travelers or specific events. Offer slightly more flexible terms than peak season.
- Regularly analyze your own performance against these Corbara seasonality benchmarks and adjust your pricing and availability strategy accordingly.
Best Areas for Airbnb Investment in Corbara (2026)
Exploring the top neighborhoods for short-term rentals in Corbara? This section highlights key areas, outlining why they are attractive for hosts and guests, along with notable local attractions. Consider these locations based on your target guest profile and investment strategy.
| Neighborhood / Area | Why Host Here? (Target Guests & Appeal) | Key Attractions & Landmarks |
|---|---|---|
| Corbara Village | Quaint village with historical charm and scenic views. It attracts tourists looking for a peaceful stay close to nature and traditional Corsican culture. | Sant'Appiano Church, Hiking trails, Local vineyards, Secluded beaches |
| Algajola | Coastal town known for its beautiful beaches and historic fortress. Popular with families and beachgoers seeking relaxation and water activities. | Algajola Beach, Genovese Castle, Water sports activities, Local restaurants overlooking the sea |
| L'Île-Rousse | A vibrant town with a lively market and stunning coastal scenery. Great for tourists wanting access to beautiful beaches and a bustling atmosphere. | L'Île-Rousse Beach, Piazza Paoli, Local shops and markets, Night markets, Scenic coastal walks |
| Saint-Florent | Charming harbor town that serves as the gateway to the Nebbio region. Attracts those interested in history, wine, and beautiful landscapes. | Saint-Florent Port, Wine tours in the surrounding areas, Historic citadel, Beaches nearby |
| Borgo | A small coastal town offering pristine beaches and a relaxed atmosphere. Ideal for tourists looking for a quieter retreat near the sea. | Borgo Beach, Local seafood restaurants, Hiking trails in surrounding nature |
| Corte | Located in the heart of Corsica, this town is rich in history and nature, making it appealing for nature lovers and history enthusiasts. | Museum of Corsica, Restonica Valley, Corte citadel, Hiking opportunities |
| Pigna | Known for its artisan community and traditional Corsican music. Visitors seeking cultural experiences are drawn here for workshops and folklore. | Handicraft shops, Artisan workshops, Live music events, Beautiful walking paths |
| Bastia | As Corsica's second-largest city, Bastia offers a vibrant cultural scene and bustling port, attracting both leisure and business travelers. | Vieux Port, Saint-Nicolas Square, Historic museums, Cultural festivals |
Understanding Airbnb License Requirements & STR Laws in Corbara (2026)
While Corbara, Corsica, France currently shows low STR regulations, specific Airbnb license requirements might still exist or change. Always verify the latest short term rental regulations and Airbnb license requirements directly with local government authorities for Corbara to ensure full compliance before hosting.
(Source: AirROI data, 2026, based on 4% licensed listings)
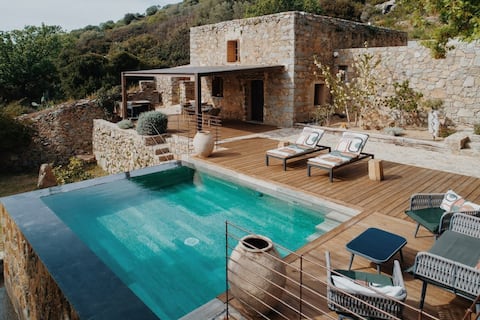
Top Performing Airbnb Properties in Corbara (2026)
Benchmark your potential! Explore examples of top-performing Airbnb properties in Corbarabased on Trailing Twelve Month (TTM) revenue. Analyze their characteristics, revenue, occupancy rate, and ADR to understand what drives success in this market.
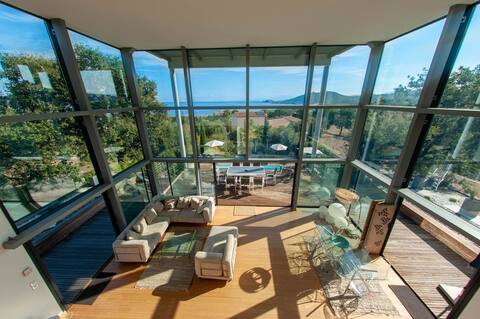
designer villa sea mountain view red island marine
Entire Place • 5 bedrooms

Villa with sea view, walking distance to the beach - Marine de Davia
Entire Place • 5 bedrooms

Modern villa with panoramic sea views.
Entire Place • 4 bedrooms

Luciola, sea view villa and sunset
Entire Place • 4 bedrooms
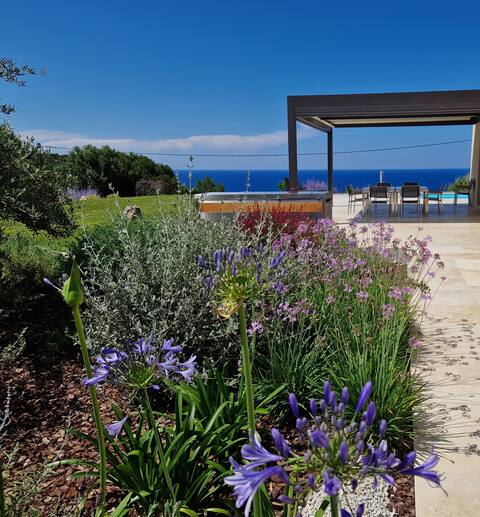
Charming villa with sea view and swimming pool
Entire Place • 5 bedrooms
Villa U Laziu
Entire Place • 1 bedroom
Note: Performance varies based on location, size, amenities, seasonality, and management quality. Data reflects the past 12 months.
Top Performing Airbnb Hosts in Corbara (2026)
Learn from the best! This table showcases top-performing Airbnb hosts in Corbara based on the number of properties managed and estimated total revenue over the past year. Analyze their scale and performance metrics.
| Host Name | Properties | Grossing Revenue | Stay Reviews | Avg Rating |
|---|---|---|---|---|
| Marie-Luce | 7 | $202,083 | 21 | 4.76/5.0 |
| Florian | 4 | $180,084 | 99 | 4.63/5.0 |
| Edouard | 4 | $138,677 | 158 | 4.98/5.0 |
| Stephane | 4 | $136,425 | 92 | 4.85/5.0 |
| Benedicte | 4 | $119,851 | 62 | 4.95/5.0 |
| Eddy | 2 | $115,769 | 41 | 4.97/5.0 |
| Martine | 1 | $110,995 | 48 | 4.96/5.0 |
| Virginie | 1 | $109,670 | 23 | 5.00/5.0 |
| Claire | 1 | $104,490 | 62 | 4.95/5.0 |
| Marie-Luce | 2 | $102,888 | 158 | 4.88/5.0 |
Analyzing the strategies of top hosts, such as their property selection, pricing, and guest communication, can offer valuable lessons for optimizing your own Airbnb operations in Corbara.
Dive Deeper: Advanced Corbara STR Market Data (2026)
Ready to unlock more insights? AirROI provides access to advanced metrics and comprehensive Airbnb data for Corbara. Explore detailed analytics beyond this report to refine your investment strategy, optimize pricing, and maximize your vacation rental profits.
Explore Advanced MetricsCorbara Short-Term Rental Market Composition (2026): Property & Room Types
Room Type Distribution
Property Type Distribution
Market Composition Insights for Corbara
- The Corbara Airbnb market composition is heavily skewed towards Entire Home/Apt listings, which make up 92.7% of the 179 active rentals. This indicates strong guest preference for privacy and space.
- Looking at the property type distribution in Corbara, House properties are the most common (60.9%), reflecting the local real estate landscape.
- Houses represent a significant 60.9% portion, catering likely to families or larger groups.
- The presence of 7.3% Hotel/Boutique listings indicates integration with traditional hospitality.
- Smaller segments like others (combined 1.7%) offer potential for unique stay experiences.
Corbara Airbnb Room Capacity Analysis (2026): Bedroom Distribution
Distribution of Listings by Number of Bedrooms
Room Capacity Insights for Corbara
- The dominant room capacity in Corbara is 1 bedroom listings, making up 26.3% of the market. This suggests a strong demand for properties suitable for couples or solo travelers.
- Together, 1 bedroom and 2 bedrooms properties represent 52.0% of the active Airbnb listings in Corbara, indicating a high concentration in these sizes.
- A significant 40.2% of listings offer 3+ bedrooms, catering to larger groups and families seeking more space in Corbara.
Corbara Vacation Rental Guest Capacity Trends (2026)
Distribution of Listings by Guest Capacity
Guest Capacity Insights for Corbara
- The most common guest capacity trend in Corbara vacation rentals is listings accommodating 4 guests (25.7%). This suggests the primary traveler segment is likely small families or groups.
- Properties designed for 4 guests and 8+ guests dominate the Corbara STR market, accounting for 49.2% of listings.
- 43.0% of properties accommodate 6+ guests, serving the market segment for larger families or group travel in Corbara.
- On average, properties in Corbara are equipped to host 4.8 guests.
Corbara Airbnb Booking Patterns (2026): Available vs. Booked Days
Available Days Distribution
Booked Days Distribution
Booking Pattern Insights for Corbara
- The most common availability pattern in Corbara falls within the 271-366 days range, representing 63.7% of listings. This suggests many properties have significant open periods on their calendars.
- Approximately 90.0% of listings show high availability (181+ days open annually), indicating potential for increased bookings or specific owner usage patterns.
- For booked days, the 31-90 days range is most frequent in Corbara (40.8%), reflecting common guest stay durations or potential owner blocking patterns.
- A notable 10.6% of properties secure long booking periods (181+ days booked per year), highlighting successful long-term rental strategies or significant owner usage.
Corbara Airbnb Minimum Stay Requirements Analysis
Distribution of Listings by Minimum Night Requirement
1 Night
9 listings
5% of total
2 Nights
5 listings
2.8% of total
3 Nights
6 listings
3.4% of total
4-6 Nights
64 listings
35.8% of total
7-29 Nights
29 listings
16.2% of total
30+ Nights
66 listings
36.9% of total
Key Insights
- The most prevalent minimum stay requirement in Corbara is 30+ Nights, adopted by 36.9% of listings. This highlights the market's preference for longer commitments.
- Very short stays (1-2 nights) are less common (7.8%), suggesting hosts prefer slightly longer bookings to optimize turnover.
- A significant segment (36.9%) caters to monthly stays (30+ nights) in Corbara, pointing to opportunities in the extended-stay market.
Recommendations
- Align with the market by considering a 30+ Nights minimum stay, as 36.9% of Corbara hosts use this setting.
- If feasible, allowing 1-night stays, especially midweek or during low season, could capture last-minute bookings, as only 5% currently do.
- Explore offering discounts for stays of 30+ nights to attract the 36.9% of the market seeking extended stays.
- Adjust minimum nights based on seasonality – potentially shorter during low season and longer during peak demand periods in Corbara.
Corbara Airbnb Cancellation Policy Trends Analysis (2026)
Limited
1 listings
0.6% of total
Non-refundable
1 listings
0.6% of total
Super Strict 30 Days
2 listings
1.1% of total
Super Strict 60 Days
1 listings
0.6% of total
Flexible
27 listings
15.2% of total
Moderate
15 listings
8.4% of total
Firm
103 listings
57.9% of total
Strict
28 listings
15.7% of total
Cancellation Policy Insights for Corbara
- The prevailing Airbnb cancellation policy trend in Corbara is Firm, used by 57.9% of listings.
- A majority (73.6%) of hosts in Corbara utilize Firm or Strict policies, indicating a market where hosts prioritize booking security.
Recommendations for Hosts
- Consider adopting a Firm policy to align with the 57.9% market standard in Corbara.
- Regularly review your cancellation policy against competitors and market demand shifts in Corbara.
Corbara STR Booking Lead Time Analysis (2026)
Average Booking Lead Time by Month
Booking Lead Time Insights for Corbara
- The overall average booking lead time for vacation rentals in Corbara is 90 days.
- Guests book furthest in advance for stays during August (average 132 days), likely coinciding with peak travel demand or local events.
- The shortest booking windows occur for stays in December (average 11 days), indicating more last-minute travel plans during this time.
- Seasonally, Summer (117 days avg.) sees the longest lead times, while Winter (20 days avg.) has the shortest, reflecting typical travel planning cycles.
Recommendations for Hosts
- Use the overall average lead time (90 days) as a baseline for your pricing and availability strategy in Corbara.
- For August stays, consider implementing length-of-stay discounts or slightly higher rates for bookings made less than 132 days out to capitalize on advance planning.
- During December, focus on last-minute booking availability and promotions, as guests book with very short notice (11 days avg.).
- Target marketing efforts for the Summer season well in advance (at least 117 days) to capture early planners.
- Monitor your own booking lead times against these Corbara averages to identify opportunities for dynamic pricing adjustments.
Popular & Essential Airbnb Amenities in Corbara (2026)
Amenity Prevalence
Amenity Insights for Corbara
- Popular amenities like Kitchen, Free parking on premises, Washer are common but not universal. Offering these can provide a competitive edge.
- Warning: Wifi is not universally provided but is considered essential globally. Ensure reliable Wifi is offered.
Recommendations for Hosts
- Consider adding popular differentiators like Kitchen or Free parking on premises to increase appeal.
- Highlight unique or less common amenities you offer (e.g., hot tub, dedicated workspace, EV charger) in your listing description and photos.
- Regularly check competitor amenities in Corbara to stay competitive.
Corbara Airbnb Guest Demographics & Profile Analysis (2026)
Guest Profile Summary for Corbara
- The typical guest profile for Airbnb in Corbara consists of a mix of domestic (60%) and international guests, often arriving from nearby Paris, typically belonging to the Post-2000s (Gen Z/Alpha) group (50%), primarily speaking English or French.
- Domestic travelers account for 59.5% of guests.
- Key international markets include France (59.5%) and Germany (14.9%).
- Top languages spoken are English (34.6%) followed by French (31.5%).
- A significant demographic segment is the Post-2000s (Gen Z/Alpha) group, representing 50% of guests.
Recommendations for Hosts
- Balance marketing efforts between domestic and international channels based on the guest mix.
- Tailor amenities and listing descriptions to appeal to the dominant Post-2000s (Gen Z/Alpha) demographic (e.g., highlight fast WiFi, smart home features, local guides).
- Highlight unique local experiences or amenities relevant to the primary guest profile.
- Consider seasonal promotions aligned with peak travel times for key origin markets.
Nearby Short-Term Rental Market Comparison
How does the Corbara Airbnb market stack up against its neighbors? Compare key performance metrics like average monthly revenue, ADR, and occupancy rates in surrounding areas to understand the broader regional STR landscape.
| Market | Active Properties | Monthly Revenue | Daily Rate | Avg. Occupancy |
|---|---|---|---|---|
| Saint-Jean-Cap-Ferrat | 114 | $3,894 | $465.00 | 44% |
| Porto Cervo | 195 | $3,256 | $555.32 | 40% |
| Monaco | 193 | $3,208 | $490.13 | 36% |
| Villefranche-sur-Mer | 494 | $3,095 | $295.76 | 50% |
| Tourrettes-sur-Loup | 168 | $3,021 | $399.67 | 44% |
| Èze | 167 | $2,961 | $366.26 | 44% |
| Cap-d'Ail | 208 | $2,898 | $353.36 | 42% |
| Falicon | 17 | $2,877 | $429.86 | 38% |
| Beausoleil | 654 | $2,820 | $281.81 | 45% |
| Saint-Paul-de-Vence | 158 | $2,762 | $361.67 | 41% |