Saint-Viâtre Airbnb Market Analysis 2026: Short Term Rental Data & Vacation Rental Statistics in Centre-Val de Loire, France
Is Airbnb profitable in Saint-Viâtre in 2026? Explore comprehensive Airbnb analytics for Saint-Viâtre, Centre-Val de Loire, France to uncover income potential. This 2026 STR market report for Saint-Viâtre, based on AirROI data from February 2025 to January 2026, reveals key trends in the niche market of 22 active listings.
Whether you're considering an Airbnb investment in Saint-Viâtre, optimizing your existing vacation rental, or exploring rental arbitrage opportunities, understanding the Saint-Viâtre Airbnb data is crucial. Leveraging the low regulation environment is key to maximizing your short term rental income potential. Let's dive into the specifics.
Key Saint-Viâtre Airbnb Performance Metrics Overview
Monthly Airbnb Revenue Variations & Income Potential in Saint-Viâtre (2026)
Understanding the monthly revenue variations for Airbnb listings in Saint-Viâtre is key to maximizing your short term rental income potential. Seasonality significantly impacts earnings. Our analysis, based on data from the past 12 months, shows that the peak revenue month for STRs in Saint-Viâtre is typically July, while November often presents the lowest earnings, highlighting opportunities for strategic pricing adjustments during shoulder and low seasons. Explore the typical Airbnb income in Saint-Viâtre across different performance tiers:
- Best-in-class properties (Top 10%) achieve $3,142+ monthly, often utilizing dynamic pricing and superior guest experiences.
- Strong performing properties (Top 25%) earn $1,754 or more, indicating effective management and desirable locations/amenities.
- Typical properties (Median) generate around $884 per month, representing the average market performance.
- Entry-level properties (Bottom 25%) see earnings around $482, often with potential for optimization.
Average Monthly Airbnb Earnings Trend in Saint-Viâtre
Saint-Viâtre Airbnb Occupancy Rate Trends (2026)
Maximize your bookings by understanding the Saint-Viâtre STR occupancy trends. Seasonal demand shifts significantly influence how often properties are booked. Typically, Julysees the highest demand (peak season occupancy), while January experiences the lowest (low season). Effective strategies, like adjusting minimum stays or offering promotions, can boost occupancy during slower periods. Here's how different property tiers perform in Saint-Viâtre:
- Best-in-class properties (Top 10%) achieve 57%+ occupancy, indicating high desirability and potentially optimized availability.
- Strong performing properties (Top 25%) maintain 40% or higher occupancy, suggesting good market fit and guest satisfaction.
- Typical properties (Median) have an occupancy rate around 25%.
- Entry-level properties (Bottom 25%) average 15% occupancy, potentially facing higher vacancy.
Average Monthly Occupancy Rate Trend in Saint-Viâtre
Average Daily Rate (ADR) Airbnb Trends in Saint-Viâtre (2026)
Effective short term rental pricing strategy in Saint-Viâtre involves understanding monthly ADR fluctuations. The Average Daily Rate (ADR) for Airbnb in Saint-Viâtre typically peaks in December and dips lowest during March. Leveraging Airbnb dynamic pricing tools or strategies based on this seasonality can significantly boost revenue. Here's a look at the typical nightly rates achieved:
- Best-in-class properties (Top 10%) command rates of $405+ per night, often due to premium features or locations.
- Strong performing properties (Top 25%) achieve nightly rates of $216 or more.
- Typical properties (Median) charge around $116 per night.
- Entry-level properties (Bottom 25%) earn around $86 per night.
Average Daily Rate (ADR) Trend by Month in Saint-Viâtre
Get Live Saint-Viâtre Market Intelligence 👇

Explore Real-time Analytics
Airbnb Seasonality Analysis & Trends in Saint-Viâtre (2026)
Peak Season (July, August, December)
- Revenue averages $2,247 per month
- Occupancy rates average 39.5%
- Daily rates average $188
Shoulder Season
- Revenue averages $1,161 per month
- Occupancy maintains around 30.1%
- Daily rates hold near $173
Low Season (January, April, November)
- Revenue drops to average $829 per month
- Occupancy decreases to average 18.7%
- Daily rates adjust to average $187
Seasonality Insights for Saint-Viâtre
- The Airbnb seasonality in Saint-Viâtre shows highly seasonal trends requiring careful strategy. While the sections above show seasonal averages, it's also insightful to look at the extremes:
- During the high season, the absolute peak month showcases Saint-Viâtre's highest earning potential, with monthly revenues capable of climbing to $2,922, occupancy reaching a high of 54.8%, and ADRs peaking at $204.
- Conversely, the slowest single month of the year, typically falling within the low season, marks the market's lowest point. In this month, revenue might dip to $699, occupancy could drop to 12.2%, and ADRs may adjust down to $159.
- Understanding both the seasonal averages and these monthly peaks and troughs in revenue, occupancy, and ADR is crucial for maximizing your Airbnb profit potential in Saint-Viâtre.
Seasonal Strategies for Maximizing Profit
- Peak Season: Maximize revenue through premium pricing and potentially longer minimum stays. Ensure high availability.
- Low Season: Offer competitive pricing, special promotions (e.g., extended stay discounts), and flexible cancellation policies. Target off-season travelers like remote workers or budget-conscious guests.
- Shoulder Seasons: Implement dynamic pricing that balances peak and low rates. Target weekend travelers or specific events. Offer slightly more flexible terms than peak season.
- Regularly analyze your own performance against these Saint-Viâtre seasonality benchmarks and adjust your pricing and availability strategy accordingly.
Best Areas for Airbnb Investment in Saint-Viâtre (2026)
Exploring the top neighborhoods for short-term rentals in Saint-Viâtre? This section highlights key areas, outlining why they are attractive for hosts and guests, along with notable local attractions. Consider these locations based on your target guest profile and investment strategy.
| Neighborhood / Area | Why Host Here? (Target Guests & Appeal) | Key Attractions & Landmarks |
|---|---|---|
| Saint-Viâtre Village | Charming rural village known for its tranquility and natural beauty. Ideal for guests looking to escape the hustle and bustle of city life and enjoy the French countryside. | Church of Saint-Viâtre, Gorges de la Loire, Local markets, Cultural festivals, Walking trails |
| Château de la Loire | Proximity to the famous Loire Valley châteaux, making it a perfect launchpad for tourists exploring the region's rich history and architecture. | Château de Chambord, Château de Cheverny, Château de Blois, Scenic vineyards tours, Cycling routes along the Loire |
| Sologne Nature Reserve | A unique natural reserve renowned for its rich biodiversity. Attracts nature lovers and outdoor enthusiasts looking to explore forests, lakes, and wildlife. | Nature walks, Birdwatching, Fishing spots, Local flora and fauna, Photography opportunities |
| Lamotte-Beuvron | Nearby town known for its equestrian culture and sports, appealing to visitors interested in horse riding and countryside adventures. | Horse riding schools, Equestrian events, Local handicraft shops, Nature parks, Outdoor sports facilities |
| Châtillon-sur-Loire | Quaint town along the Loire River known for its picturesque landscapes and tranquility, attracting visitors seeking a peaceful getaway. | Loire River cruises, Historic bridges, Local cafés, Walking and cycling paths, Market days |
| Romorantin-Lanthenay | Larger nearby town offering various amenities and cultural sites, making it a good base for those wanting more urban options while staying close to nature. | Museums, Local festivals, Shopping streets, Cultural events, Cafés and restaurants |
| Saint-Aignan | Home to the famous ZooParc de Beauval, one of the best zoos in France, attracts families and animal lovers. | ZooParc de Beauval, Château de Saint-Aignan, Local dining, Family-friendly activities, Wine tasting tours |
| Bourges | Historic city known for its stunning architecture and UNESCO-listed sites, perfect for guests wanting cultural experiences and historical exploration. | Cathedral of Bourges, Palais Jacques-Coeur, Historic district, Gardens of Archambault, Local art galleries |
Understanding Airbnb License Requirements & STR Laws in Saint-Viâtre (2026)
While Saint-Viâtre, Centre-Val de Loire, France currently shows low STR regulations, specific Airbnb license requirements might still exist or change. Always verify the latest short term rental regulations and Airbnb license requirements directly with local government authorities for Saint-Viâtre to ensure full compliance before hosting.
(Source: AirROI data, 2026, based on 5% licensed listings)
Top Performing Airbnb Properties in Saint-Viâtre (2026)
Benchmark your potential! Explore examples of top-performing Airbnb properties in Saint-Viâtrebased on Trailing Twelve Month (TTM) revenue. Analyze their characteristics, revenue, occupancy rate, and ADR to understand what drives success in this market.
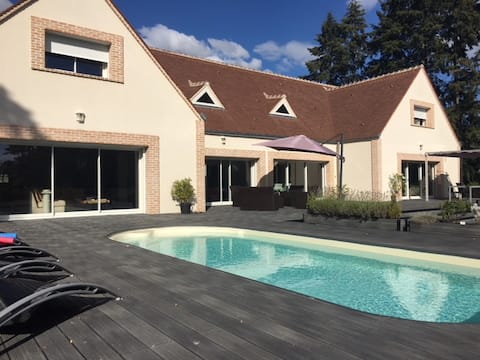
MAGICAL, SPACIOUS AND BRIGHT PLACE.
Entire Place • 5 bedrooms
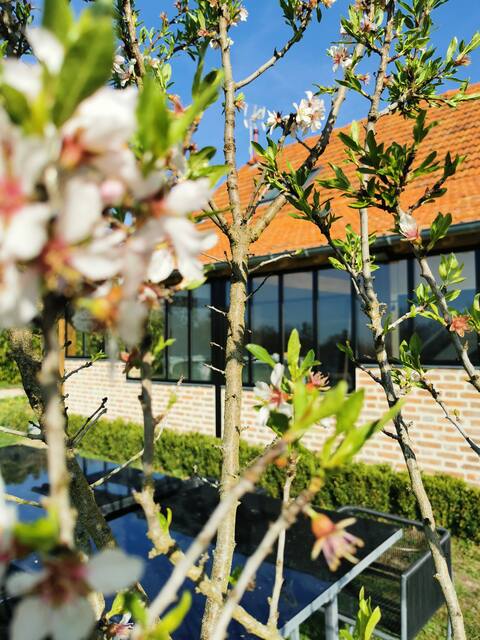
Le Pti'Fernin, Sologne Gîte
Entire Place • 4 bedrooms

Sologne des Étangs "The Camellia"
Entire Place • 2 bedrooms
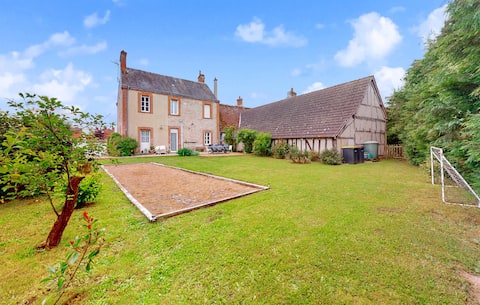
Le Margautier
Entire Place • 4 bedrooms
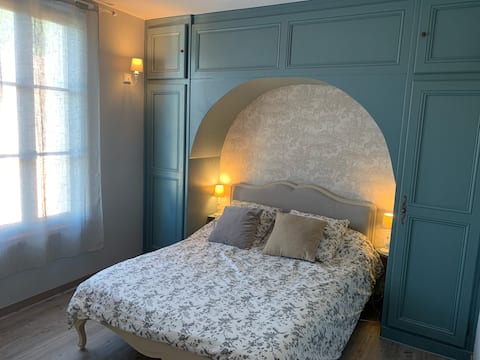
The Great 4P Trail with Breakfast and Pool
Private Room • 2 bedrooms

Sologne of the "Bontens" ponds
Entire Place • 1 bedroom
Note: Performance varies based on location, size, amenities, seasonality, and management quality. Data reflects the past 12 months.
Top Performing Airbnb Hosts in Saint-Viâtre (2026)
Learn from the best! This table showcases top-performing Airbnb hosts in Saint-Viâtre based on the number of properties managed and estimated total revenue over the past year. Analyze their scale and performance metrics.
| Host Name | Properties | Grossing Revenue | Stay Reviews | Avg Rating |
|---|---|---|---|---|
| Alain | 2 | $39,130 | 169 | 4.97/5.0 |
| Edith | 1 | $37,198 | 42 | 4.79/5.0 |
| Corinne | 4 | $36,684 | 103 | 4.96/5.0 |
| Thipphavanh | 1 | $25,859 | 25 | 5.00/5.0 |
| Novasol | 2 | $24,501 | 3 | Not Rated |
| Amélie | 1 | $15,650 | 5 | 5.00/5.0 |
| Mihai Octavian | 2 | $12,607 | 16 | 5.00/5.0 |
| Monique | 1 | $12,218 | 87 | 4.77/5.0 |
| Ayanne | 2 | $12,169 | 5 | 4.67/5.0 |
| Franck | 1 | $8,231 | 84 | 4.90/5.0 |
Analyzing the strategies of top hosts, such as their property selection, pricing, and guest communication, can offer valuable lessons for optimizing your own Airbnb operations in Saint-Viâtre.
Dive Deeper: Advanced Saint-Viâtre STR Market Data (2026)
Ready to unlock more insights? AirROI provides access to advanced metrics and comprehensive Airbnb data for Saint-Viâtre. Explore detailed analytics beyond this report to refine your investment strategy, optimize pricing, and maximize your vacation rental profits.
Explore Advanced MetricsSaint-Viâtre Short-Term Rental Market Composition (2026): Property & Room Types
Room Type Distribution
Property Type Distribution
Market Composition Insights for Saint-Viâtre
- The Saint-Viâtre Airbnb market composition is heavily skewed towards Entire Home/Apt listings, which make up 72.7% of the 22 active rentals. This indicates strong guest preference for privacy and space.
- Looking at the property type distribution in Saint-Viâtre, House properties are the most common (63.6%), reflecting the local real estate landscape.
- Houses represent a significant 63.6% portion, catering likely to families or larger groups.
- The presence of 22.7% Hotel/Boutique listings indicates integration with traditional hospitality.
- Smaller segments like outdoor/unique (combined 4.5%) offer potential for unique stay experiences.
Saint-Viâtre Airbnb Room Capacity Analysis (2026): Bedroom Distribution
Distribution of Listings by Number of Bedrooms
Room Capacity Insights for Saint-Viâtre
- The dominant room capacity in Saint-Viâtre is 1 bedroom listings, making up 36.4% of the market. This suggests a strong demand for properties suitable for couples or solo travelers.
- Together, 1 bedroom and 2 bedrooms properties represent 68.2% of the active Airbnb listings in Saint-Viâtre, indicating a high concentration in these sizes.
- A significant 27.2% of listings offer 3+ bedrooms, catering to larger groups and families seeking more space in Saint-Viâtre.
Saint-Viâtre Vacation Rental Guest Capacity Trends (2026)
Distribution of Listings by Guest Capacity
Guest Capacity Insights for Saint-Viâtre
- The most common guest capacity trend in Saint-Viâtre vacation rentals is listings accommodating 4 guests (40.9%). This suggests the primary traveler segment is likely small families or groups.
- Properties designed for 4 guests and 8+ guests dominate the Saint-Viâtre STR market, accounting for 59.1% of listings.
- 31.8% of properties accommodate 6+ guests, serving the market segment for larger families or group travel in Saint-Viâtre.
- On average, properties in Saint-Viâtre are equipped to host 4.1 guests.
Saint-Viâtre Airbnb Booking Patterns (2026): Available vs. Booked Days
Available Days Distribution
Booked Days Distribution
Booking Pattern Insights for Saint-Viâtre
- The most common availability pattern in Saint-Viâtre falls within the 271-366 days range, representing 68.2% of listings. This suggests many properties have significant open periods on their calendars.
- Approximately 95.5% of listings show high availability (181+ days open annually), indicating potential for increased bookings or specific owner usage patterns.
- For booked days, the 31-90 days range is most frequent in Saint-Viâtre (40.9%), reflecting common guest stay durations or potential owner blocking patterns.
- A notable 4.5% of properties secure long booking periods (181+ days booked per year), highlighting successful long-term rental strategies or significant owner usage.
Saint-Viâtre Airbnb Minimum Stay Requirements Analysis
Distribution of Listings by Minimum Night Requirement
1 Night
6 listings
27.3% of total
2 Nights
10 listings
45.5% of total
7-29 Nights
1 listings
4.5% of total
30+ Nights
5 listings
22.7% of total
Key Insights
- The most prevalent minimum stay requirement in Saint-Viâtre is 2 Nights, adopted by 45.5% of listings. This highlights the market's preference for shorter, flexible bookings.
- A strong majority (72.8%) of the Saint-Viâtre Airbnb data shows acceptance of very short stays (1-2 nights), indicating a dynamic, high-turnover market.
- A significant segment (22.7%) caters to monthly stays (30+ nights) in Saint-Viâtre, pointing to opportunities in the extended-stay market.
Recommendations
- Align with the market by considering a 2 Nights minimum stay, as 45.5% of Saint-Viâtre hosts use this setting.
- If feasible, allowing 1-night stays, especially midweek or during low season, could capture last-minute bookings, as only 27.3% currently do.
- Explore offering discounts for stays of 30+ nights to attract the 22.7% of the market seeking extended stays.
- Adjust minimum nights based on seasonality – potentially shorter during low season and longer during peak demand periods in Saint-Viâtre.
Saint-Viâtre Airbnb Cancellation Policy Trends Analysis (2026)
Super Strict 60 Days
2 listings
9.1% of total
Flexible
10 listings
45.5% of total
Moderate
5 listings
22.7% of total
Firm
3 listings
13.6% of total
Strict
2 listings
9.1% of total
Cancellation Policy Insights for Saint-Viâtre
- The prevailing Airbnb cancellation policy trend in Saint-Viâtre is Flexible, used by 45.5% of listings.
- There's a relatively balanced mix between guest-friendly (68.2%) and stricter (22.7%) policies, offering choices for different guest needs.
- Strict cancellation policies are quite rare (9.1%), potentially making listings with this policy less competitive unless justified by high demand or property type.
Recommendations for Hosts
- Consider adopting a Flexible policy to align with the 45.5% market standard in Saint-Viâtre.
- Using a Strict policy might deter some guests, as only 9.1% of listings use it. Evaluate if potential revenue protection outweighs possible lower booking rates.
- Regularly review your cancellation policy against competitors and market demand shifts in Saint-Viâtre.
Saint-Viâtre STR Booking Lead Time Analysis (2026)
Average Booking Lead Time by Month
Booking Lead Time Insights for Saint-Viâtre
- The overall average booking lead time for vacation rentals in Saint-Viâtre is 70 days.
- Guests book furthest in advance for stays during July (average 150 days), likely coinciding with peak travel demand or local events.
- The shortest booking windows occur for stays in February (average 34 days), indicating more last-minute travel plans during this time.
- Seasonally, Summer (98 days avg.) sees the longest lead times, while Winter (53 days avg.) has the shortest, reflecting typical travel planning cycles.
Recommendations for Hosts
- Use the overall average lead time (70 days) as a baseline for your pricing and availability strategy in Saint-Viâtre.
- For July stays, consider implementing length-of-stay discounts or slightly higher rates for bookings made less than 150 days out to capitalize on advance planning.
- Target marketing efforts for the Summer season well in advance (at least 98 days) to capture early planners.
- Monitor your own booking lead times against these Saint-Viâtre averages to identify opportunities for dynamic pricing adjustments.
Popular & Essential Airbnb Amenities in Saint-Viâtre (2026)
Amenity Prevalence
Amenity Insights for Saint-Viâtre
- Popular amenities like Heating, TV, Kitchen are common but not universal. Offering these can provide a competitive edge.
- Warning: Wifi is not universally provided but is considered essential globally. Ensure reliable Wifi is offered.
Recommendations for Hosts
- Consider adding popular differentiators like Heating or TV to increase appeal.
- Highlight unique or less common amenities you offer (e.g., hot tub, dedicated workspace, EV charger) in your listing description and photos.
- Regularly check competitor amenities in Saint-Viâtre to stay competitive.
Saint-Viâtre Airbnb Guest Demographics & Profile Analysis (2026)
Guest Profile Summary for Saint-Viâtre
- The typical guest profile for Airbnb in Saint-Viâtre consists of primarily domestic travelers (82%), often arriving from nearby Paris, typically belonging to the Post-2000s (Gen Z/Alpha) group (50%), primarily speaking French or English.
- Domestic travelers account for 81.8% of guests.
- Key international markets include France (81.8%) and Netherlands (7.6%).
- Top languages spoken are French (35.5%) followed by English (33.9%).
- A significant demographic segment is the Post-2000s (Gen Z/Alpha) group, representing 50% of guests.
Recommendations for Hosts
- Target domestic marketing efforts towards travelers from Paris and Lyon.
- Tailor amenities and listing descriptions to appeal to the dominant Post-2000s (Gen Z/Alpha) demographic (e.g., highlight fast WiFi, smart home features, local guides).
- Highlight unique local experiences or amenities relevant to the primary guest profile.
- Consider seasonal promotions aligned with peak travel times for key origin markets.
Nearby Short-Term Rental Market Comparison
How does the Saint-Viâtre Airbnb market stack up against its neighbors? Compare key performance metrics like average monthly revenue, ADR, and occupancy rates in surrounding areas to understand the broader regional STR landscape.
| Market | Active Properties | Monthly Revenue | Daily Rate | Avg. Occupancy |
|---|---|---|---|---|
| Égreville | 12 | $4,969 | $447.83 | 40% |
| La Couture-Boussey | 11 | $4,086 | $464.04 | 28% |
| Menetou-Râtel | 10 | $3,844 | $353.11 | 34% |
| Thilouze | 10 | $3,694 | $333.84 | 55% |
| Artannes-sur-Indre | 22 | $3,534 | $365.79 | 37% |
| Rugles | 11 | $3,164 | $308.65 | 32% |
| Achères-la-Forêt | 35 | $3,136 | $348.74 | 44% |
| Mesnils-sur-Iton | 24 | $3,099 | $348.65 | 41% |
| Paris | 39,295 | $3,085 | $257.47 | 52% |
| Charencey | 11 | $3,030 | $245.41 | 41% |