Plogonnec Airbnb Market Analysis 2026: Short Term Rental Data & Vacation Rental Statistics in Brittany, France
Is Airbnb profitable in Plogonnec in 2026? Explore comprehensive Airbnb analytics for Plogonnec, Brittany, France to uncover income potential. This 2026 STR market report for Plogonnec, based on AirROI data from February 2025 to January 2026, reveals key trends in the niche market of 20 active listings.
Whether you're considering an Airbnb investment in Plogonnec, optimizing your existing vacation rental, or exploring rental arbitrage opportunities, understanding the Plogonnec Airbnb data is crucial. Leveraging the low regulation environment is key to maximizing your short term rental income potential. Let's dive into the specifics.
Key Plogonnec Airbnb Performance Metrics Overview
Monthly Airbnb Revenue Variations & Income Potential in Plogonnec (2026)
Understanding the monthly revenue variations for Airbnb listings in Plogonnec is key to maximizing your short term rental income potential. Seasonality significantly impacts earnings. Our analysis, based on data from the past 12 months, shows that the peak revenue month for STRs in Plogonnec is typically August, while January often presents the lowest earnings, highlighting opportunities for strategic pricing adjustments during shoulder and low seasons. Explore the typical Airbnb income in Plogonnec across different performance tiers:
- Best-in-class properties (Top 10%) achieve $3,109+ monthly, often utilizing dynamic pricing and superior guest experiences.
- Strong performing properties (Top 25%) earn $2,114 or more, indicating effective management and desirable locations/amenities.
- Typical properties (Median) generate around $1,341 per month, representing the average market performance.
- Entry-level properties (Bottom 25%) see earnings around $936, often with potential for optimization.
Average Monthly Airbnb Earnings Trend in Plogonnec
Plogonnec Airbnb Occupancy Rate Trends (2026)
Maximize your bookings by understanding the Plogonnec STR occupancy trends. Seasonal demand shifts significantly influence how often properties are booked. Typically, Augustsees the highest demand (peak season occupancy), while January experiences the lowest (low season). Effective strategies, like adjusting minimum stays or offering promotions, can boost occupancy during slower periods. Here's how different property tiers perform in Plogonnec:
- Best-in-class properties (Top 10%) achieve 80%+ occupancy, indicating high desirability and potentially optimized availability.
- Strong performing properties (Top 25%) maintain 59% or higher occupancy, suggesting good market fit and guest satisfaction.
- Typical properties (Median) have an occupancy rate around 44%.
- Entry-level properties (Bottom 25%) average 30% occupancy, potentially facing higher vacancy.
Average Monthly Occupancy Rate Trend in Plogonnec
Average Daily Rate (ADR) Airbnb Trends in Plogonnec (2026)
Effective short term rental pricing strategy in Plogonnec involves understanding monthly ADR fluctuations. The Average Daily Rate (ADR) for Airbnb in Plogonnec typically peaks in July and dips lowest during February. Leveraging Airbnb dynamic pricing tools or strategies based on this seasonality can significantly boost revenue. Here's a look at the typical nightly rates achieved:
- Best-in-class properties (Top 10%) command rates of $177+ per night, often due to premium features or locations.
- Strong performing properties (Top 25%) achieve nightly rates of $123 or more.
- Typical properties (Median) charge around $100 per night.
- Entry-level properties (Bottom 25%) earn around $85 per night.
Average Daily Rate (ADR) Trend by Month in Plogonnec
Get Live Plogonnec Market Intelligence 👇
Explore Real-time Analytics
Airbnb Seasonality Analysis & Trends in Plogonnec (2026)
Peak Season (August, September, July)
- Revenue averages $2,155 per month
- Occupancy rates average 63.3%
- Daily rates average $127
Shoulder Season
- Revenue averages $1,660 per month
- Occupancy maintains around 46.9%
- Daily rates hold near $111
Low Season (January, June, December)
- Revenue drops to average $992 per month
- Occupancy decreases to average 26.7%
- Daily rates adjust to average $116
Seasonality Insights for Plogonnec
- The Airbnb seasonality in Plogonnec shows highly seasonal trends requiring careful strategy. While the sections above show seasonal averages, it's also insightful to look at the extremes:
- During the high season, the absolute peak month showcases Plogonnec's highest earning potential, with monthly revenues capable of climbing to $2,539, occupancy reaching a high of 71.6%, and ADRs peaking at $134.
- Conversely, the slowest single month of the year, typically falling within the low season, marks the market's lowest point. In this month, revenue might dip to $591, occupancy could drop to 15.3%, and ADRs may adjust down to $105.
- Understanding both the seasonal averages and these monthly peaks and troughs in revenue, occupancy, and ADR is crucial for maximizing your Airbnb profit potential in Plogonnec.
Seasonal Strategies for Maximizing Profit
- Peak Season: Maximize revenue through premium pricing and potentially longer minimum stays. Ensure high availability.
- Low Season: Offer competitive pricing, special promotions (e.g., extended stay discounts), and flexible cancellation policies. Target off-season travelers like remote workers or budget-conscious guests.
- Shoulder Seasons: Implement dynamic pricing that balances peak and low rates. Target weekend travelers or specific events. Offer slightly more flexible terms than peak season.
- Regularly analyze your own performance against these Plogonnec seasonality benchmarks and adjust your pricing and availability strategy accordingly.
Best Areas for Airbnb Investment in Plogonnec (2026)
Exploring the top neighborhoods for short-term rentals in Plogonnec? This section highlights key areas, outlining why they are attractive for hosts and guests, along with notable local attractions. Consider these locations based on your target guest profile and investment strategy.
| Neighborhood / Area | Why Host Here? (Target Guests & Appeal) | Key Attractions & Landmarks |
|---|---|---|
| Plogonnec Village Center | Charming village atmosphere with traditional Breton houses and a close-knit community feel. Ideal for visitors seeking an authentic regional experience. | Church of Saint-Trémeur, Historic village center, Local bakeries and shops, Markets selling fresh produce |
| Quimper | Close proximity to the regional capital with rich history and vibrant culture. Attracts visitors interested in local culture, art, and cuisine. | Quimper Cathedral, Musee des Beaux-Arts, Old Town Quimper, Local festivals, Traditional Breton restaurants |
| Locronan | Picturesque medieval town known for its historical architecture and cobbled streets. A UNESCO World Heritage site that attracts tourists year-round. | Locronan Church, Quimperle's historical significance, Artisan shops, Cultural festivals, Scenic landscapes |
| Douarnenez | Seaside town famous for its harbors and maritime history. Great for those who love the sea and outdoor activities. | Port Museum, Douarnenez beaches, Coastal hiking trails, Local seafood restaurants, Pointe du Raz nearby |
| Camaret-sur-Mer | Beautiful coastal town with stunning views and access to nature. Ideal for outdoor enthusiasts and beach lovers. | Sailing and water sports, Cap de la Chevre, Camaret beaches, National Marine Park, Local artist studios |
| Crozon Peninsula | Offers breathtaking natural beauty and outdoor adventure options. Great for attracting eco-tourism and adventure seekers. | Hiking trails, Scenic cliffs, Beaches, Marine wildlife watching, Water sports activities |
| Brest | Major city nearby with a large student population and business hub. Suitable for urban Airbnb rentals catering to business travelers and students. | Brest Castle, Oceanopolis, University of Western Brittany, Local markets, Cultural events |
| Benodet | Popular seaside resort known for its beautiful beaches and family-friendly atmosphere. Attractive to tourists seeking a relaxing getaway. | Benodet beach, Marina, Casino, Odet River cruises, Local restaurants |
Understanding Airbnb License Requirements & STR Laws in Plogonnec (2026)
While Plogonnec, Brittany, France currently shows low STR regulations, specific Airbnb license requirements might still exist or change. Always verify the latest short term rental regulations and Airbnb license requirements directly with local government authorities for Plogonnec to ensure full compliance before hosting.
(Source: AirROI data, 2026, based on 5% licensed listings)
Top Performing Airbnb Properties in Plogonnec (2026)
Benchmark your potential! Explore examples of top-performing Airbnb properties in Plogonnecbased on Trailing Twelve Month (TTM) revenue. Analyze their characteristics, revenue, occupancy rate, and ADR to understand what drives success in this market.

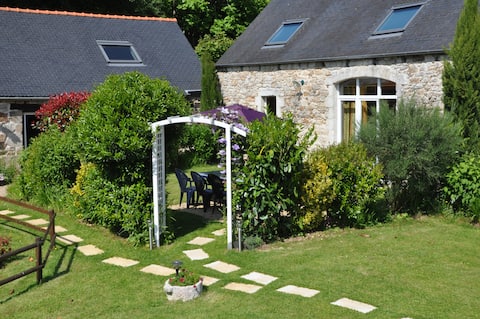
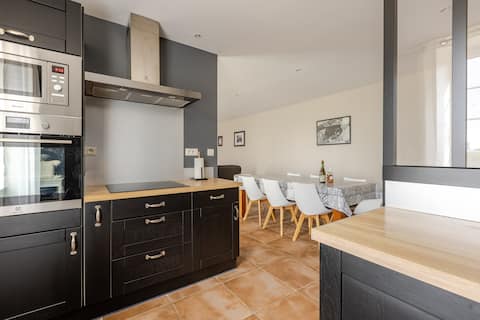
House in Brittany.
Entire Place • 2 bedrooms
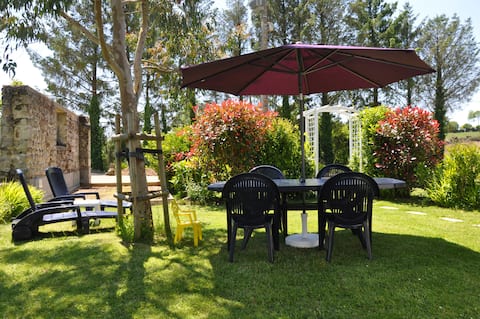
Breizh Evasion 4/6 pers 3-star gîte
Entire Place • 3 bedrooms
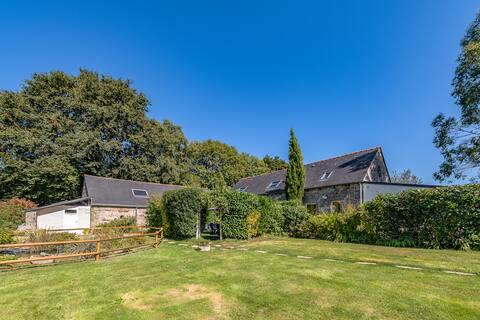
Set of 3 cottages in the heart of a renovated farmhouse
Entire Place • 6 bedrooms
Breizh Évasion 2/4 pers 3-star rated gîte
Entire Place • 3 bedrooms
House in the countryside, 8 km from the beach
Entire Place • 4 bedrooms
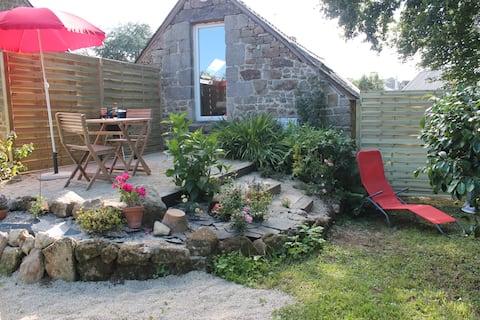
Breizh Evasion 2-person cocooning cottage, 4-star rating
Entire Place • 1 bedroom
Note: Performance varies based on location, size, amenities, seasonality, and management quality. Data reflects the past 12 months.
Top Performing Airbnb Hosts in Plogonnec (2026)
Learn from the best! This table showcases top-performing Airbnb hosts in Plogonnec based on the number of properties managed and estimated total revenue over the past year. Analyze their scale and performance metrics.
| Host Name | Properties | Grossing Revenue | Stay Reviews | Avg Rating |
|---|---|---|---|---|
| David Et Cécile | 4 | $81,029 | 307 | 4.87/5.0 |
| Marianne | 1 | $32,529 | 73 | 5.00/5.0 |
| Mathilde | 2 | $22,723 | 12 | 5.00/5.0 |
| Marie | 1 | $18,856 | 75 | 4.95/5.0 |
| Christèle Et Xavier | 1 | $12,689 | 95 | 5.00/5.0 |
| Tetyana | 1 | $9,035 | 2 | Not Rated |
| Marie & Bruno | 1 | $8,937 | 33 | 4.82/5.0 |
| Frederique | 1 | $7,309 | 77 | 4.70/5.0 |
| Stéphane | 1 | $5,584 | 59 | 4.66/5.0 |
| Brigitte | 1 | $4,965 | 46 | 4.87/5.0 |
Analyzing the strategies of top hosts, such as their property selection, pricing, and guest communication, can offer valuable lessons for optimizing your own Airbnb operations in Plogonnec.
Dive Deeper: Advanced Plogonnec STR Market Data (2026)
Ready to unlock more insights? AirROI provides access to advanced metrics and comprehensive Airbnb data for Plogonnec. Explore detailed analytics beyond this report to refine your investment strategy, optimize pricing, and maximize your vacation rental profits.
Explore Advanced MetricsPlogonnec Short-Term Rental Market Composition (2026): Property & Room Types
Room Type Distribution
Property Type Distribution
Market Composition Insights for Plogonnec
- The Plogonnec Airbnb market composition is heavily skewed towards Entire Home/Apt listings, which make up 100% of the 20 active rentals. This indicates strong guest preference for privacy and space.
- Looking at the property type distribution in Plogonnec, House properties are the most common (65%), reflecting the local real estate landscape.
- Houses represent a significant 65% portion, catering likely to families or larger groups.
Plogonnec Airbnb Room Capacity Analysis (2026): Bedroom Distribution
Distribution of Listings by Number of Bedrooms
Room Capacity Insights for Plogonnec
- The dominant room capacity in Plogonnec is 3 bedrooms listings, making up 30% of the market. This suggests a strong demand for properties suitable for families or small groups.
- Together, 3 bedrooms and 1 bedroom properties represent 55.0% of the active Airbnb listings in Plogonnec, indicating a high concentration in these sizes.
- A significant 50.0% of listings offer 3+ bedrooms, catering to larger groups and families seeking more space in Plogonnec.
Plogonnec Vacation Rental Guest Capacity Trends (2026)
Distribution of Listings by Guest Capacity
Guest Capacity Insights for Plogonnec
- The most common guest capacity trend in Plogonnec vacation rentals is listings accommodating 2 guests (30%). This suggests the primary traveler segment is likely couples or solo travelers.
- Properties designed for 2 guests and 6 guests dominate the Plogonnec STR market, accounting for 55.0% of listings.
- 45.0% of properties accommodate 6+ guests, serving the market segment for larger families or group travel in Plogonnec.
- On average, properties in Plogonnec are equipped to host 4.7 guests.
Plogonnec Airbnb Booking Patterns (2026): Available vs. Booked Days
Available Days Distribution
Booked Days Distribution
Booking Pattern Insights for Plogonnec
- The most common availability pattern in Plogonnec falls within the 271-366 days range, representing 50% of listings. This suggests many properties have significant open periods on their calendars.
- Approximately 80.0% of listings show high availability (181+ days open annually), indicating potential for increased bookings or specific owner usage patterns.
- For booked days, the 91-180 days range is most frequent in Plogonnec (30%), reflecting common guest stay durations or potential owner blocking patterns.
- A notable 20.0% of properties secure long booking periods (181+ days booked per year), highlighting successful long-term rental strategies or significant owner usage.
Plogonnec Airbnb Minimum Stay Requirements Analysis
Distribution of Listings by Minimum Night Requirement
1 Night
2 listings
10% of total
2 Nights
2 listings
10% of total
3 Nights
1 listings
5% of total
4-6 Nights
4 listings
20% of total
30+ Nights
11 listings
55% of total
Key Insights
- The most prevalent minimum stay requirement in Plogonnec is 30+ Nights, adopted by 55% of listings. This highlights the market's preference for longer commitments.
- A significant segment (55%) caters to monthly stays (30+ nights) in Plogonnec, pointing to opportunities in the extended-stay market.
Recommendations
- Align with the market by considering a 30+ Nights minimum stay, as 55% of Plogonnec hosts use this setting.
- If feasible, allowing 1-night stays, especially midweek or during low season, could capture last-minute bookings, as only 10% currently do.
- Explore offering discounts for stays of 30+ nights to attract the 55% of the market seeking extended stays.
- Adjust minimum nights based on seasonality – potentially shorter during low season and longer during peak demand periods in Plogonnec.
Plogonnec Airbnb Cancellation Policy Trends Analysis (2026)
Flexible
3 listings
15% of total
Moderate
8 listings
40% of total
Firm
8 listings
40% of total
Strict
1 listings
5% of total
Cancellation Policy Insights for Plogonnec
- The prevailing Airbnb cancellation policy trend in Plogonnec is Moderate, used by 40% of listings.
- There's a relatively balanced mix between guest-friendly (55.0%) and stricter (45.0%) policies, offering choices for different guest needs.
- Strict cancellation policies are quite rare (5%), potentially making listings with this policy less competitive unless justified by high demand or property type.
Recommendations for Hosts
- Consider adopting a Moderate policy to align with the 40% market standard in Plogonnec.
- Using a Strict policy might deter some guests, as only 5% of listings use it. Evaluate if potential revenue protection outweighs possible lower booking rates.
- Regularly review your cancellation policy against competitors and market demand shifts in Plogonnec.
Plogonnec STR Booking Lead Time Analysis (2026)
Average Booking Lead Time by Month
Booking Lead Time Insights for Plogonnec
- The overall average booking lead time for vacation rentals in Plogonnec is 78 days.
- Guests book furthest in advance for stays during August (average 114 days), likely coinciding with peak travel demand or local events.
- The shortest booking windows occur for stays in November (average 19 days), indicating more last-minute travel plans during this time.
- Seasonally, Summer (93 days avg.) sees the longest lead times, while Winter (32 days avg.) has the shortest, reflecting typical travel planning cycles.
Recommendations for Hosts
- Use the overall average lead time (78 days) as a baseline for your pricing and availability strategy in Plogonnec.
- For August stays, consider implementing length-of-stay discounts or slightly higher rates for bookings made less than 114 days out to capitalize on advance planning.
- Target marketing efforts for the Summer season well in advance (at least 93 days) to capture early planners.
- Monitor your own booking lead times against these Plogonnec averages to identify opportunities for dynamic pricing adjustments.
Popular & Essential Airbnb Amenities in Plogonnec (2026)
Amenity Prevalence
Amenity Insights for Plogonnec
- Essential amenities in Plogonnec that guests expect include: Kitchen, Refrigerator, Coffee maker, Free parking on premises, TV, Heating, Wifi. Lacking these (any) could significantly impact bookings.
- Popular amenities like Washer, Hangers, Microwave are common but not universal. Offering these can provide a competitive edge.
Recommendations for Hosts
- Ensure your listing includes all essential amenities for Plogonnec: Kitchen, Refrigerator, Coffee maker, Free parking on premises, TV, Heating, Wifi.
- Prioritize adding missing essentials: Free parking on premises, TV, Heating, Wifi.
- Consider adding popular differentiators like Washer or Hangers to increase appeal.
- Highlight unique or less common amenities you offer (e.g., hot tub, dedicated workspace, EV charger) in your listing description and photos.
- Regularly check competitor amenities in Plogonnec to stay competitive.
Plogonnec Airbnb Guest Demographics & Profile Analysis (2026)
Guest Profile Summary for Plogonnec
- The typical guest profile for Airbnb in Plogonnec consists of primarily domestic travelers (82%), often arriving from nearby Paris, typically belonging to the Post-2000s (Gen Z/Alpha) group (50%), primarily speaking French or English.
- Domestic travelers account for 81.6% of guests.
- Key international markets include France (81.6%) and Germany (4.6%).
- Top languages spoken are French (37.8%) followed by English (35.6%).
- A significant demographic segment is the Post-2000s (Gen Z/Alpha) group, representing 50% of guests.
Recommendations for Hosts
- Target domestic marketing efforts towards travelers from Paris and England.
- Tailor amenities and listing descriptions to appeal to the dominant Post-2000s (Gen Z/Alpha) demographic (e.g., highlight fast WiFi, smart home features, local guides).
- Highlight unique local experiences or amenities relevant to the primary guest profile.
- Consider seasonal promotions aligned with peak travel times for key origin markets.
Nearby Short-Term Rental Market Comparison
How does the Plogonnec Airbnb market stack up against its neighbors? Compare key performance metrics like average monthly revenue, ADR, and occupancy rates in surrounding areas to understand the broader regional STR landscape.
| Market | Active Properties | Monthly Revenue | Daily Rate | Avg. Occupancy |
|---|---|---|---|---|
| Lanmodez | 18 | $2,492 | $234.53 | 40% |
| Ushant | 74 | $2,441 | $161.99 | 58% |
| Île-de-Bréhat | 49 | $2,373 | $230.16 | 45% |
| Île-Molène | 11 | $2,158 | $123.01 | 67% |
| Guern | 12 | $1,803 | $117.23 | 42% |
| Sainte-Brigitte | 10 | $1,801 | $178.03 | 34% |
| Plouider | 27 | $1,701 | $197.12 | 37% |
| Languidic | 40 | $1,691 | $167.69 | 41% |
| Brélès | 13 | $1,665 | $204.49 | 36% |
| Tréogat | 13 | $1,624 | $202.46 | 42% |