Lannion Airbnb Market Analysis 2026: Short Term Rental Data & Vacation Rental Statistics in Brittany, France
Is Airbnb profitable in Lannion in 2026? Explore comprehensive Airbnb analytics for Lannion, Brittany, France to uncover income potential. This 2026 STR market report for Lannion, based on AirROI data from February 2025 to January 2026, reveals key trends in the market of 257 active listings.
Whether you're considering an Airbnb investment in Lannion, optimizing your existing vacation rental, or exploring rental arbitrage opportunities, understanding the Lannion Airbnb data is crucial. Leveraging the low regulation environment is key to maximizing your short term rental income potential. Let's dive into the specifics.
Key Lannion Airbnb Performance Metrics Overview
Monthly Airbnb Revenue Variations & Income Potential in Lannion (2026)
Understanding the monthly revenue variations for Airbnb listings in Lannion is key to maximizing your short term rental income potential. Seasonality significantly impacts earnings. Our analysis, based on data from the past 12 months, shows that the peak revenue month for STRs in Lannion is typically August, while January often presents the lowest earnings, highlighting opportunities for strategic pricing adjustments during shoulder and low seasons. Explore the typical Airbnb income in Lannion across different performance tiers:
- Best-in-class properties (Top 10%) achieve $2,046+ monthly, often utilizing dynamic pricing and superior guest experiences.
- Strong performing properties (Top 25%) earn $1,454 or more, indicating effective management and desirable locations/amenities.
- Typical properties (Median) generate around $952 per month, representing the average market performance.
- Entry-level properties (Bottom 25%) see earnings around $530, often with potential for optimization.
Average Monthly Airbnb Earnings Trend in Lannion
Lannion Airbnb Occupancy Rate Trends (2026)
Maximize your bookings by understanding the Lannion STR occupancy trends. Seasonal demand shifts significantly influence how often properties are booked. Typically, Augustsees the highest demand (peak season occupancy), while January experiences the lowest (low season). Effective strategies, like adjusting minimum stays or offering promotions, can boost occupancy during slower periods. Here's how different property tiers perform in Lannion:
- Best-in-class properties (Top 10%) achieve 78%+ occupancy, indicating high desirability and potentially optimized availability.
- Strong performing properties (Top 25%) maintain 59% or higher occupancy, suggesting good market fit and guest satisfaction.
- Typical properties (Median) have an occupancy rate around 38%.
- Entry-level properties (Bottom 25%) average 19% occupancy, potentially facing higher vacancy.
Average Monthly Occupancy Rate Trend in Lannion
Average Daily Rate (ADR) Airbnb Trends in Lannion (2026)
Effective short term rental pricing strategy in Lannion involves understanding monthly ADR fluctuations. The Average Daily Rate (ADR) for Airbnb in Lannion typically peaks in August and dips lowest during March. Leveraging Airbnb dynamic pricing tools or strategies based on this seasonality can significantly boost revenue. Here's a look at the typical nightly rates achieved:
- Best-in-class properties (Top 10%) command rates of $174+ per night, often due to premium features or locations.
- Strong performing properties (Top 25%) achieve nightly rates of $114 or more.
- Typical properties (Median) charge around $83 per night.
- Entry-level properties (Bottom 25%) earn around $66 per night.
Average Daily Rate (ADR) Trend by Month in Lannion
Get Live Lannion Market Intelligence 👇

Explore Real-time Analytics
Airbnb Seasonality Analysis & Trends in Lannion (2026)
Peak Season (August, July, September)
- Revenue averages $1,692 per month
- Occupancy rates average 56.6%
- Daily rates average $108
Shoulder Season
- Revenue averages $999 per month
- Occupancy maintains around 37.1%
- Daily rates hold near $103
Low Season (January, February, March)
- Revenue drops to average $733 per month
- Occupancy decreases to average 32.6%
- Daily rates adjust to average $99
Seasonality Insights for Lannion
- The Airbnb seasonality in Lannion shows highly seasonal trends requiring careful strategy. While the sections above show seasonal averages, it's also insightful to look at the extremes:
- During the high season, the absolute peak month showcases Lannion's highest earning potential, with monthly revenues capable of climbing to $2,097, occupancy reaching a high of 67.1%, and ADRs peaking at $108.
- Conversely, the slowest single month of the year, typically falling within the low season, marks the market's lowest point. In this month, revenue might dip to $634, occupancy could drop to 26.2%, and ADRs may adjust down to $95.
- Understanding both the seasonal averages and these monthly peaks and troughs in revenue, occupancy, and ADR is crucial for maximizing your Airbnb profit potential in Lannion.
Seasonal Strategies for Maximizing Profit
- Peak Season: Maximize revenue through premium pricing and potentially longer minimum stays. Ensure high availability.
- Low Season: Offer competitive pricing, special promotions (e.g., extended stay discounts), and flexible cancellation policies. Target off-season travelers like remote workers or budget-conscious guests.
- Shoulder Seasons: Implement dynamic pricing that balances peak and low rates. Target weekend travelers or specific events. Offer slightly more flexible terms than peak season.
- Regularly analyze your own performance against these Lannion seasonality benchmarks and adjust your pricing and availability strategy accordingly.
Best Areas for Airbnb Investment in Lannion (2026)
Exploring the top neighborhoods for short-term rentals in Lannion? This section highlights key areas, outlining why they are attractive for hosts and guests, along with notable local attractions. Consider these locations based on your target guest profile and investment strategy.
| Neighborhood / Area | Why Host Here? (Target Guests & Appeal) | Key Attractions & Landmarks |
|---|---|---|
| Centre-ville de Lannion | The heart of Lannion, filled with charming streets, cafes, and shops. A prime spot for tourists wanting to explore the local culture and enjoy artisanal cuisine. | Saint-Jean Church, Lannion town center, Local markets, Les rues piétonnes, Scenic views of the Léguer River |
| Trégastel | Beautiful coastal town known for its pink granite coast and stunning beaches. Ideal for travelers looking for relaxing seaside vacations and water sports. | Trégastel Beach, Aquarium of Trégastel, Sentiers des Douaniers trails, Ploumanac'h, Bird watching at Île d'Augul |
| Perros-Guirec | Nearby seaside resort town famous for its picturesque beaches and hiking trails. Attracts visitors for both relaxation and outdoor activities. | Plage de Trestraou, Sentier des Douaniers, Eglise de Perros-Guirec, Access to Île de Bréhat, Local seafood restaurants |
| Plouaret | A charming town located inland, known for its historic buildings and local character. A quieter alternative for guests wanting to avoid tourist crowds while still being close to Lannion. | Château de Kergrist, Église de Plouaret, Local market, Walking trails in the area, Nearby forests |
| Kerlouan | Known for its beautiful beaches and natural landscapes, ideal for eco-tourists and those looking for adventure in nature. | Plage de Kerlouan, Pointe de Roudou, Coastal pathways, Local villages, Lighthouses |
| Beg Leguer | A scenic area along the river Léguer, providing opportunities for outdoor activities such as hiking and fishing. | Walking paths along the river, Natural scenery, Bird-watching spots, Rural countryside, Nearby picnic areas |
| L'aber Wrac'h | Picturesque river estuary known for its stunning views and tranquility, appealing for artists and nature lovers. | Estuary views, Kayaking opportunities, Local boat trips, Historic sites, Quiet beaches |
| Plestin-les-Grèves | A coastal commune known for its beautiful coastline, perfect for families and water sports enthusiasts. | Beaches, Grève de Trestel, Water sports facilities, Camping sites, Local restaurants |
Understanding Airbnb License Requirements & STR Laws in Lannion (2026)
While Lannion, Brittany, France currently shows low STR regulations, specific Airbnb license requirements might still exist or change. Always verify the latest short term rental regulations and Airbnb license requirements directly with local government authorities for Lannion to ensure full compliance before hosting.
(Source: AirROI data, 2026, based on 7% licensed listings)
Top Performing Airbnb Properties in Lannion (2026)
Benchmark your potential! Explore examples of top-performing Airbnb properties in Lannionbased on Trailing Twelve Month (TTM) revenue. Analyze their characteristics, revenue, occupancy rate, and ADR to understand what drives success in this market.

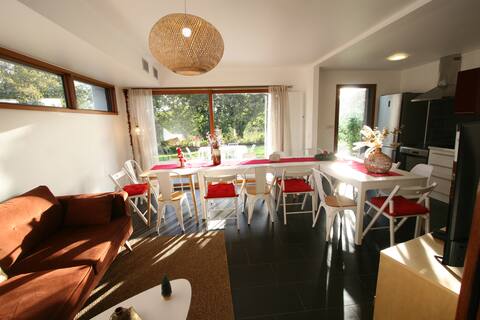
Architect-Designed House, 7 Bedrooms, 2 – 16 p, Lannion
Entire Place • 7 bedrooms

House with sea view
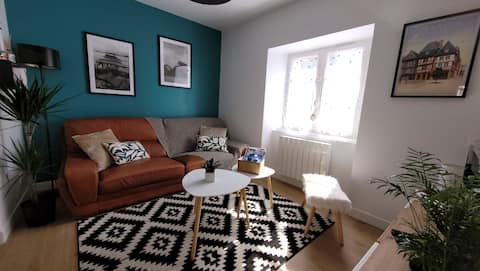
Entire Place • 2 bedrooms

Maison Lannion coeur de ville
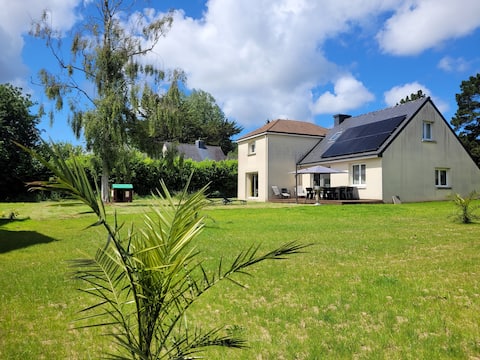
Entire Place • 7 bedrooms
Pink Granite Coast, House, Lannion, 5 bedrooms, 12 people
Entire Place • 5 bedrooms
"Ty Kerzh" house on the pink granite coast
Entire Place • 2 bedrooms
Kernay, large family house for 10 people
Entire Place • 4 bedrooms
Note: Performance varies based on location, size, amenities, seasonality, and management quality. Data reflects the past 12 months.
Top Performing Airbnb Hosts in Lannion (2026)
Learn from the best! This table showcases top-performing Airbnb hosts in Lannion based on the number of properties managed and estimated total revenue over the past year. Analyze their scale and performance metrics.
| Host Name | Properties | Grossing Revenue | Stay Reviews | Avg Rating |
|---|---|---|---|---|
| Vincent | 10 | $144,711 | 1007 | 4.74/5.0 |
| Nathalie Et Rob | 3 | $75,614 | 48 | 4.85/5.0 |
| Nicolas | 7 | $68,310 | 926 | 4.80/5.0 |
| Gabrielle | 8 | $64,372 | 205 | 4.66/5.0 |
| Tonn'Ô Loisirs | 4 | $59,780 | 228 | 4.78/5.0 |
| Résidence | 5 | $47,518 | 165 | 4.58/5.0 |
| Valérie | 4 | $37,682 | 642 | 4.85/5.0 |
| Sabrina Et Sylvain | 3 | $34,792 | 101 | 4.98/5.0 |
| Jeannick | 3 | $28,860 | 194 | 4.78/5.0 |
| Sandrine | 2 | $28,666 | 321 | 4.96/5.0 |
Analyzing the strategies of top hosts, such as their property selection, pricing, and guest communication, can offer valuable lessons for optimizing your own Airbnb operations in Lannion.
Dive Deeper: Advanced Lannion STR Market Data (2026)
Ready to unlock more insights? AirROI provides access to advanced metrics and comprehensive Airbnb data for Lannion. Explore detailed analytics beyond this report to refine your investment strategy, optimize pricing, and maximize your vacation rental profits.
Explore Advanced MetricsLannion Short-Term Rental Market Composition (2026): Property & Room Types
Room Type Distribution
Property Type Distribution
Market Composition Insights for Lannion
- The Lannion Airbnb market composition is heavily skewed towards Entire Home/Apt listings, which make up 89.1% of the 257 active rentals. This indicates strong guest preference for privacy and space.
- Looking at the property type distribution in Lannion, House properties are the most common (48.6%), reflecting the local real estate landscape.
- Houses represent a significant 48.6% portion, catering likely to families or larger groups.
- Smaller segments like hotel/boutique, others, outdoor/unique (combined 6.7%) offer potential for unique stay experiences.
Lannion Airbnb Room Capacity Analysis (2026): Bedroom Distribution
Distribution of Listings by Number of Bedrooms
Room Capacity Insights for Lannion
- The dominant room capacity in Lannion is 1 bedroom listings, making up 41.6% of the market. This suggests a strong demand for properties suitable for couples or solo travelers.
- Together, 1 bedroom and 2 bedrooms properties represent 61.1% of the active Airbnb listings in Lannion, indicating a high concentration in these sizes.
- A significant 20.7% of listings offer 3+ bedrooms, catering to larger groups and families seeking more space in Lannion.
Lannion Vacation Rental Guest Capacity Trends (2026)
Distribution of Listings by Guest Capacity
Guest Capacity Insights for Lannion
- The most common guest capacity trend in Lannion vacation rentals is listings accommodating 2 guests (35.8%). This suggests the primary traveler segment is likely couples or solo travelers.
- Properties designed for 2 guests and 4 guests dominate the Lannion STR market, accounting for 60.3% of listings.
- 21.4% of properties accommodate 6+ guests, serving the market segment for larger families or group travel in Lannion.
- On average, properties in Lannion are equipped to host 3.5 guests.
Lannion Airbnb Booking Patterns (2026): Available vs. Booked Days
Available Days Distribution
Booked Days Distribution
Booking Pattern Insights for Lannion
- The most common availability pattern in Lannion falls within the 271-366 days range, representing 59.5% of listings. This suggests many properties have significant open periods on their calendars.
- Approximately 88.7% of listings show high availability (181+ days open annually), indicating potential for increased bookings or specific owner usage patterns.
- For booked days, the 31-90 days range is most frequent in Lannion (40.5%), reflecting common guest stay durations or potential owner blocking patterns.
- A notable 13.2% of properties secure long booking periods (181+ days booked per year), highlighting successful long-term rental strategies or significant owner usage.
Lannion Airbnb Minimum Stay Requirements Analysis
Distribution of Listings by Minimum Night Requirement
1 Night
52 listings
20.2% of total
2 Nights
24 listings
9.3% of total
3 Nights
18 listings
7% of total
4-6 Nights
34 listings
13.2% of total
7-29 Nights
14 listings
5.4% of total
30+ Nights
115 listings
44.7% of total
Key Insights
- The most prevalent minimum stay requirement in Lannion is 30+ Nights, adopted by 44.7% of listings. This highlights the market's preference for longer commitments.
- A significant segment (44.7%) caters to monthly stays (30+ nights) in Lannion, pointing to opportunities in the extended-stay market.
Recommendations
- Align with the market by considering a 30+ Nights minimum stay, as 44.7% of Lannion hosts use this setting.
- If feasible, allowing 1-night stays, especially midweek or during low season, could capture last-minute bookings, as only 20.2% currently do.
- Explore offering discounts for stays of 30+ nights to attract the 44.7% of the market seeking extended stays.
- Adjust minimum nights based on seasonality – potentially shorter during low season and longer during peak demand periods in Lannion.
Lannion Airbnb Cancellation Policy Trends Analysis (2026)
Super Strict 30 Days
1 listings
0.4% of total
Super Strict 60 Days
1 listings
0.4% of total
Limited
2 listings
0.8% of total
Flexible
84 listings
32.7% of total
Moderate
76 listings
29.6% of total
Firm
71 listings
27.6% of total
Strict
22 listings
8.6% of total
Cancellation Policy Insights for Lannion
- The prevailing Airbnb cancellation policy trend in Lannion is Flexible, used by 32.7% of listings.
- There's a relatively balanced mix between guest-friendly (62.3%) and stricter (36.2%) policies, offering choices for different guest needs.
- Strict cancellation policies are quite rare (8.6%), potentially making listings with this policy less competitive unless justified by high demand or property type.
Recommendations for Hosts
- Consider adopting a Flexible policy to align with the 32.7% market standard in Lannion.
- Using a Strict policy might deter some guests, as only 8.6% of listings use it. Evaluate if potential revenue protection outweighs possible lower booking rates.
- Regularly review your cancellation policy against competitors and market demand shifts in Lannion.
Lannion STR Booking Lead Time Analysis (2026)
Average Booking Lead Time by Month
Booking Lead Time Insights for Lannion
- The overall average booking lead time for vacation rentals in Lannion is 55 days.
- Guests book furthest in advance for stays during August (average 78 days), likely coinciding with peak travel demand or local events.
- The shortest booking windows occur for stays in January (average 29 days), indicating more last-minute travel plans during this time.
- Seasonally, Summer (63 days avg.) sees the longest lead times, while Winter (32 days avg.) has the shortest, reflecting typical travel planning cycles.
Recommendations for Hosts
- Use the overall average lead time (55 days) as a baseline for your pricing and availability strategy in Lannion.
- For August stays, consider implementing length-of-stay discounts or slightly higher rates for bookings made less than 78 days out to capitalize on advance planning.
- Target marketing efforts for the Summer season well in advance (at least 63 days) to capture early planners.
- Monitor your own booking lead times against these Lannion averages to identify opportunities for dynamic pricing adjustments.
Popular & Essential Airbnb Amenities in Lannion (2026)
Amenity Prevalence
Amenity Insights for Lannion
- Popular amenities like Kitchen, Wifi, Hot water are common but not universal. Offering these can provide a competitive edge.
- Warning: Wifi is not universally provided but is considered essential globally. Ensure reliable Wifi is offered.
Recommendations for Hosts
- Consider adding popular differentiators like Kitchen or Wifi to increase appeal.
- Highlight unique or less common amenities you offer (e.g., hot tub, dedicated workspace, EV charger) in your listing description and photos.
- Regularly check competitor amenities in Lannion to stay competitive.
Lannion Airbnb Guest Demographics & Profile Analysis (2026)
Guest Profile Summary for Lannion
- The typical guest profile for Airbnb in Lannion consists of primarily domestic travelers (87%), often arriving from nearby Paris, typically belonging to the Post-2000s (Gen Z/Alpha) group (50%), primarily speaking French or English.
- Domestic travelers account for 86.6% of guests.
- Key international markets include France (86.6%) and Germany (3.3%).
- Top languages spoken are French (44.7%) followed by English (33.1%).
- A significant demographic segment is the Post-2000s (Gen Z/Alpha) group, representing 50% of guests.
Recommendations for Hosts
- Target domestic marketing efforts towards travelers from Paris and Rennes.
- Tailor amenities and listing descriptions to appeal to the dominant Post-2000s (Gen Z/Alpha) demographic (e.g., highlight fast WiFi, smart home features, local guides).
- Highlight unique local experiences or amenities relevant to the primary guest profile.
- Consider seasonal promotions aligned with peak travel times for key origin markets.
Nearby Short-Term Rental Market Comparison
How does the Lannion Airbnb market stack up against its neighbors? Compare key performance metrics like average monthly revenue, ADR, and occupancy rates in surrounding areas to understand the broader regional STR landscape.
| Market | Active Properties | Monthly Revenue | Daily Rate | Avg. Occupancy |
|---|---|---|---|---|
| St Martin | 13 | $4,259 | $494.81 | 46% |
| Donges | 12 | $3,715 | $297.19 | 43% |
| Vale | 12 | $3,196 | $236.67 | 55% |
| St Clement | 17 | $2,929 | $242.25 | 57% |
| St Helier | 61 | $2,757 | $256.82 | 56% |
| St Ouen | 14 | $2,690 | $441.20 | 43% |
| Grouville | 18 | $2,659 | $198.18 | 55% |
| Castel | 15 | $2,562 | $203.72 | 59% |
| St Martin | 15 | $2,505 | $231.10 | 50% |
| Lanmodez | 18 | $2,492 | $234.53 | 40% |