Tonnerre Airbnb Market Analysis 2026: Short Term Rental Data & Vacation Rental Statistics in Bourgogne – Franche-Comté, France
Is Airbnb profitable in Tonnerre in 2026? Explore comprehensive Airbnb analytics for Tonnerre, Bourgogne – Franche-Comté, France to uncover income potential. This 2026 STR market report for Tonnerre, based on AirROI data from February 2025 to January 2026, reveals key trends in the niche market of 32 active listings.
Whether you're considering an Airbnb investment in Tonnerre, optimizing your existing vacation rental, or exploring rental arbitrage opportunities, understanding the Tonnerre Airbnb data is crucial. Leveraging the low regulation environment is key to maximizing your short term rental income potential. Let's dive into the specifics.
Key Tonnerre Airbnb Performance Metrics Overview
Monthly Airbnb Revenue Variations & Income Potential in Tonnerre (2026)
Understanding the monthly revenue variations for Airbnb listings in Tonnerre is key to maximizing your short term rental income potential. Seasonality significantly impacts earnings. Our analysis, based on data from the past 12 months, shows that the peak revenue month for STRs in Tonnerre is typically August, while January often presents the lowest earnings, highlighting opportunities for strategic pricing adjustments during shoulder and low seasons. Explore the typical Airbnb income in Tonnerre across different performance tiers:
- Best-in-class properties (Top 10%) achieve $2,255+ monthly, often utilizing dynamic pricing and superior guest experiences.
- Strong performing properties (Top 25%) earn $1,442 or more, indicating effective management and desirable locations/amenities.
- Typical properties (Median) generate around $901 per month, representing the average market performance.
- Entry-level properties (Bottom 25%) see earnings around $501, often with potential for optimization.
Average Monthly Airbnb Earnings Trend in Tonnerre
Tonnerre Airbnb Occupancy Rate Trends (2026)
Maximize your bookings by understanding the Tonnerre STR occupancy trends. Seasonal demand shifts significantly influence how often properties are booked. Typically, Marchsees the highest demand (peak season occupancy), while January experiences the lowest (low season). Effective strategies, like adjusting minimum stays or offering promotions, can boost occupancy during slower periods. Here's how different property tiers perform in Tonnerre:
- Best-in-class properties (Top 10%) achieve 70%+ occupancy, indicating high desirability and potentially optimized availability.
- Strong performing properties (Top 25%) maintain 56% or higher occupancy, suggesting good market fit and guest satisfaction.
- Typical properties (Median) have an occupancy rate around 37%.
- Entry-level properties (Bottom 25%) average 21% occupancy, potentially facing higher vacancy.
Average Monthly Occupancy Rate Trend in Tonnerre
Average Daily Rate (ADR) Airbnb Trends in Tonnerre (2026)
Effective short term rental pricing strategy in Tonnerre involves understanding monthly ADR fluctuations. The Average Daily Rate (ADR) for Airbnb in Tonnerre typically peaks in September and dips lowest during March. Leveraging Airbnb dynamic pricing tools or strategies based on this seasonality can significantly boost revenue. Here's a look at the typical nightly rates achieved:
- Best-in-class properties (Top 10%) command rates of $133+ per night, often due to premium features or locations.
- Strong performing properties (Top 25%) achieve nightly rates of $107 or more.
- Typical properties (Median) charge around $83 per night.
- Entry-level properties (Bottom 25%) earn around $65 per night.
Average Daily Rate (ADR) Trend by Month in Tonnerre
Get Live Tonnerre Market Intelligence 👇

Explore Real-time Analytics
Airbnb Seasonality Analysis & Trends in Tonnerre (2026)
Peak Season (August, October, July)
- Revenue averages $1,438 per month
- Occupancy rates average 42.9%
- Daily rates average $102
Shoulder Season
- Revenue averages $1,167 per month
- Occupancy maintains around 38.2%
- Daily rates hold near $100
Low Season (January, February, April)
- Revenue drops to average $891 per month
- Occupancy decreases to average 37.5%
- Daily rates adjust to average $95
Seasonality Insights for Tonnerre
- The Airbnb seasonality in Tonnerre shows moderate seasonality with distinct peak and low periods. While the sections above show seasonal averages, it's also insightful to look at the extremes:
- During the high season, the absolute peak month showcases Tonnerre's highest earning potential, with monthly revenues capable of climbing to $1,548, occupancy reaching a high of 50.0%, and ADRs peaking at $109.
- Conversely, the slowest single month of the year, typically falling within the low season, marks the market's lowest point. In this month, revenue might dip to $755, occupancy could drop to 28.5%, and ADRs may adjust down to $90.
- Understanding both the seasonal averages and these monthly peaks and troughs in revenue, occupancy, and ADR is crucial for maximizing your Airbnb profit potential in Tonnerre.
Seasonal Strategies for Maximizing Profit
- Peak Season: Maximize revenue through premium pricing and potentially longer minimum stays. Ensure high availability.
- Low Season: Offer competitive pricing, special promotions (e.g., extended stay discounts), and flexible cancellation policies. Target off-season travelers like remote workers or budget-conscious guests.
- Shoulder Seasons: Implement dynamic pricing that balances peak and low rates. Target weekend travelers or specific events. Offer slightly more flexible terms than peak season.
- Regularly analyze your own performance against these Tonnerre seasonality benchmarks and adjust your pricing and availability strategy accordingly.
Best Areas for Airbnb Investment in Tonnerre (2026)
Exploring the top neighborhoods for short-term rentals in Tonnerre? This section highlights key areas, outlining why they are attractive for hosts and guests, along with notable local attractions. Consider these locations based on your target guest profile and investment strategy.
| Neighborhood / Area | Why Host Here? (Target Guests & Appeal) | Key Attractions & Landmarks |
|---|---|---|
| Historic Center of Tonnerre | The historic center boasts charming cobblestone streets and medieval buildings, making it appealing for tourists interested in history and culture. | Tonnerre's Town Hall, Saint-Jean Church, Fossil Museum, Musee de la Vigne et du Vin, Hôtel Dieu |
| Basilique de Tonnerre | This stunning basilica is a key historical landmark and a must-see for visitors, attracting those interested in architecture and history. | Basilique de Tonnerre, Gardens around the basilica, Parks and walking areas nearby |
| Chateau de Tonnerre | This beautiful castle offers insights into the region's history and architecture, making it attractive for tourists and history enthusiasts. | Chateau de Tonnerre, Surrounding gardens, Historical exhibitions |
| Canal de Bourgogne | The scenic canal provides opportunities for boating, cycling, and walking, appealing to nature lovers and outdoor enthusiasts. | Canal walks, Bicycle paths along the canal, Scenic picnic spots |
| Local Wine Country | Tonnerre is located near celebrated vineyards and wine production areas, which attract wine enthusiasts looking for tastings and tours. | Vincent Dureuil's vineyard, Wine tasting tours, Local wine festivals |
| Nearby Nature Parks | Surrounding nature parks offer hiking and natural beauty, appealing to tourists looking to explore the outdoors. | Parc Naturel Régional de la Forêt d'Orient, Hiking trails, Wildlife observation |
| Cafes and Restaurants by the River | The riverside area is lined with charming cafes and restaurants, perfect for tourists looking for a leisurely meal with scenic views. | Riverside dining, Local cuisine, Outdoor seating areas |
| Art and Culture Events | Tonnerre hosts various art and cultural events throughout the year, drawing in those interested in local culture and activities. | Annual festivals, Art exhibitions, Music events |
Understanding Airbnb License Requirements & STR Laws in Tonnerre (2026)
While Tonnerre, Bourgogne – Franche-Comté, France currently shows low STR regulations, specific Airbnb license requirements might still exist or change. Always verify the latest short term rental regulations and Airbnb license requirements directly with local government authorities for Tonnerre to ensure full compliance before hosting.
(Source: AirROI data, 2026, based on 6% licensed listings)
Top Performing Airbnb Properties in Tonnerre (2026)
Benchmark your potential! Explore examples of top-performing Airbnb properties in Tonnerrebased on Trailing Twelve Month (TTM) revenue. Analyze their characteristics, revenue, occupancy rate, and ADR to understand what drives success in this market.

The Maison du Haut
Entire Place • 6 bedrooms

Charmant Appartement Cosy
Entire Place • 3 bedrooms
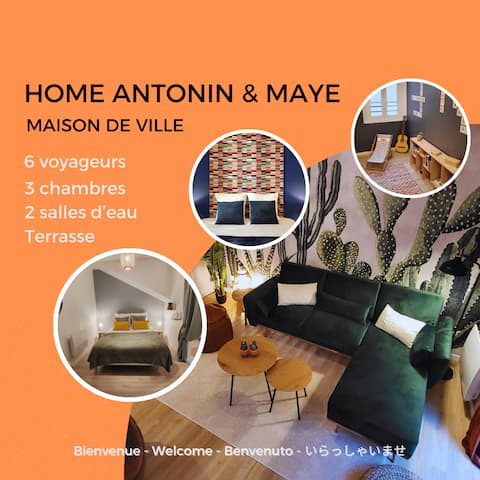
Home Antonin & Maye
Entire Place • 3 bedrooms

Chez Alba - terrace and bike storage
Entire Place • N/A

La Source • Cozy countryside escape
Private Room • N/A

Maison du Moulin
Entire Place • 3 bedrooms
Note: Performance varies based on location, size, amenities, seasonality, and management quality. Data reflects the past 12 months.
Top Performing Airbnb Hosts in Tonnerre (2026)
Learn from the best! This table showcases top-performing Airbnb hosts in Tonnerre based on the number of properties managed and estimated total revenue over the past year. Analyze their scale and performance metrics.
| Host Name | Properties | Grossing Revenue | Stay Reviews | Avg Rating |
|---|---|---|---|---|
| Annabel | 1 | $48,415 | 7 | 5.00/5.0 |
| Florent | 2 | $33,432 | 204 | 4.92/5.0 |
| Antonin | 2 | $32,219 | 96 | 4.87/5.0 |
| Johan | 2 | $24,294 | 3 | Not Rated |
| Marie Maud | 1 | $23,956 | 19 | 4.84/5.0 |
| Steve | 2 | $22,231 | 93 | 4.63/5.0 |
| Ives | 1 | $13,329 | 49 | 4.71/5.0 |
| Stéphanie Et Sébastien | 1 | $12,518 | 35 | 4.63/5.0 |
| Yoann | 1 | $12,042 | 15 | 4.80/5.0 |
| Morgane | 1 | $12,030 | 132 | 4.65/5.0 |
Analyzing the strategies of top hosts, such as their property selection, pricing, and guest communication, can offer valuable lessons for optimizing your own Airbnb operations in Tonnerre.
Dive Deeper: Advanced Tonnerre STR Market Data (2026)
Ready to unlock more insights? AirROI provides access to advanced metrics and comprehensive Airbnb data for Tonnerre. Explore detailed analytics beyond this report to refine your investment strategy, optimize pricing, and maximize your vacation rental profits.
Explore Advanced MetricsTonnerre Short-Term Rental Market Composition (2026): Property & Room Types
Room Type Distribution
Property Type Distribution
Market Composition Insights for Tonnerre
- The Tonnerre Airbnb market composition is heavily skewed towards Entire Home/Apt listings, which make up 81.3% of the 32 active rentals. This indicates strong guest preference for privacy and space.
- Looking at the property type distribution in Tonnerre, Apartment/Condo properties are the most common (56.3%), reflecting the local real estate landscape.
- Houses represent a significant 31.3% portion, catering likely to families or larger groups.
- The presence of 12.5% Hotel/Boutique listings indicates integration with traditional hospitality.
Tonnerre Airbnb Room Capacity Analysis (2026): Bedroom Distribution
Distribution of Listings by Number of Bedrooms
Room Capacity Insights for Tonnerre
- The dominant room capacity in Tonnerre is 1 bedroom listings, making up 34.4% of the market. This suggests a strong demand for properties suitable for couples or solo travelers.
- Together, 1 bedroom and 3 bedrooms properties represent 59.4% of the active Airbnb listings in Tonnerre, indicating a high concentration in these sizes.
- A significant 31.2% of listings offer 3+ bedrooms, catering to larger groups and families seeking more space in Tonnerre.
Tonnerre Vacation Rental Guest Capacity Trends (2026)
Distribution of Listings by Guest Capacity
Guest Capacity Insights for Tonnerre
- The most common guest capacity trend in Tonnerre vacation rentals is listings accommodating 2 guests (28.1%). This suggests the primary traveler segment is likely couples or solo travelers.
- Properties designed for 2 guests and 6 guests dominate the Tonnerre STR market, accounting for 53.1% of listings.
- 37.5% of properties accommodate 6+ guests, serving the market segment for larger families or group travel in Tonnerre.
- On average, properties in Tonnerre are equipped to host 3.6 guests.
Tonnerre Airbnb Booking Patterns (2026): Available vs. Booked Days
Available Days Distribution
Booked Days Distribution
Booking Pattern Insights for Tonnerre
- The most common availability pattern in Tonnerre falls within the 271-366 days range, representing 56.3% of listings. This suggests many properties have significant open periods on their calendars.
- Approximately 84.4% of listings show high availability (181+ days open annually), indicating potential for increased bookings or specific owner usage patterns.
- For booked days, the 31-90 days range is most frequent in Tonnerre (31.3%), reflecting common guest stay durations or potential owner blocking patterns.
- A notable 18.8% of properties secure long booking periods (181+ days booked per year), highlighting successful long-term rental strategies or significant owner usage.
Tonnerre Airbnb Minimum Stay Requirements Analysis
Distribution of Listings by Minimum Night Requirement
1 Night
20 listings
62.5% of total
2 Nights
6 listings
18.8% of total
3 Nights
1 listings
3.1% of total
30+ Nights
5 listings
15.6% of total
Key Insights
- The most prevalent minimum stay requirement in Tonnerre is 1 Night, adopted by 62.5% of listings. This highlights the market's preference for shorter, flexible bookings.
- A strong majority (81.3%) of the Tonnerre Airbnb data shows acceptance of very short stays (1-2 nights), indicating a dynamic, high-turnover market.
- A significant segment (15.6%) caters to monthly stays (30+ nights) in Tonnerre, pointing to opportunities in the extended-stay market.
Recommendations
- Align with the market by considering a 1 Night minimum stay, as 62.5% of Tonnerre hosts use this setting.
- Explore offering discounts for stays of 30+ nights to attract the 15.6% of the market seeking extended stays.
- Adjust minimum nights based on seasonality – potentially shorter during low season and longer during peak demand periods in Tonnerre.
Tonnerre Airbnb Cancellation Policy Trends Analysis (2026)
Flexible
13 listings
40.6% of total
Moderate
12 listings
37.5% of total
Firm
6 listings
18.8% of total
Strict
1 listings
3.1% of total
Cancellation Policy Insights for Tonnerre
- The prevailing Airbnb cancellation policy trend in Tonnerre is Flexible, used by 40.6% of listings.
- The market strongly favors guest-friendly terms, with 78.1% of listings offering Flexible or Moderate policies. This suggests guests in Tonnerre may expect booking flexibility.
- Strict cancellation policies are quite rare (3.1%), potentially making listings with this policy less competitive unless justified by high demand or property type.
Recommendations for Hosts
- Consider adopting a Flexible policy to align with the 40.6% market standard in Tonnerre.
- Using a Strict policy might deter some guests, as only 3.1% of listings use it. Evaluate if potential revenue protection outweighs possible lower booking rates.
- Regularly review your cancellation policy against competitors and market demand shifts in Tonnerre.
Tonnerre STR Booking Lead Time Analysis (2026)
Average Booking Lead Time by Month
Booking Lead Time Insights for Tonnerre
- The overall average booking lead time for vacation rentals in Tonnerre is 53 days.
- Guests book furthest in advance for stays during October (average 67 days), likely coinciding with peak travel demand or local events.
- The shortest booking windows occur for stays in March (average 19 days), indicating more last-minute travel plans during this time.
- Seasonally, Summer (54 days avg.) sees the longest lead times, while Winter (35 days avg.) has the shortest, reflecting typical travel planning cycles.
Recommendations for Hosts
- Use the overall average lead time (53 days) as a baseline for your pricing and availability strategy in Tonnerre.
- For October stays, consider implementing length-of-stay discounts or slightly higher rates for bookings made less than 67 days out to capitalize on advance planning.
- Target marketing efforts for the Summer season well in advance (at least 54 days) to capture early planners.
- Monitor your own booking lead times against these Tonnerre averages to identify opportunities for dynamic pricing adjustments.
Popular & Essential Airbnb Amenities in Tonnerre (2026)
Amenity Prevalence
Amenity Insights for Tonnerre
- Essential amenities in Tonnerre that guests expect include: Wifi. Lacking these (this) could significantly impact bookings.
- Popular amenities like Kitchen, Heating, Free parking on premises are common but not universal. Offering these can provide a competitive edge.
Recommendations for Hosts
- Ensure your listing includes all essential amenities for Tonnerre: Wifi.
- Prioritize adding missing essentials: Wifi.
- Consider adding popular differentiators like Kitchen or Heating to increase appeal.
- Highlight unique or less common amenities you offer (e.g., hot tub, dedicated workspace, EV charger) in your listing description and photos.
- Regularly check competitor amenities in Tonnerre to stay competitive.
Tonnerre Airbnb Guest Demographics & Profile Analysis (2026)
Guest Profile Summary for Tonnerre
- The typical guest profile for Airbnb in Tonnerre consists of primarily domestic travelers (79%), often arriving from nearby Paris, typically belonging to the Post-2000s (Gen Z/Alpha) group (50%), primarily speaking French or English.
- Domestic travelers account for 79.2% of guests.
- Key international markets include France (79.2%) and Belgium (5.5%).
- Top languages spoken are French (46.1%) followed by English (33.2%).
- A significant demographic segment is the Post-2000s (Gen Z/Alpha) group, representing 50% of guests.
Recommendations for Hosts
- Target domestic marketing efforts towards travelers from Paris and Versailles.
- Tailor amenities and listing descriptions to appeal to the dominant Post-2000s (Gen Z/Alpha) demographic (e.g., highlight fast WiFi, smart home features, local guides).
- Highlight unique local experiences or amenities relevant to the primary guest profile.
- Consider seasonal promotions aligned with peak travel times for key origin markets.
Nearby Short-Term Rental Market Comparison
How does the Tonnerre Airbnb market stack up against its neighbors? Compare key performance metrics like average monthly revenue, ADR, and occupancy rates in surrounding areas to understand the broader regional STR landscape.
| Market | Active Properties | Monthly Revenue | Daily Rate | Avg. Occupancy |
|---|---|---|---|---|
| Épinac | 18 | $8,488 | $539.65 | 36% |
| Égreville | 12 | $4,969 | $447.83 | 40% |
| Menetou-Râtel | 10 | $3,844 | $353.11 | 34% |
| Saint-Trivier-sur-Moignans | 10 | $3,748 | $311.34 | 37% |
| Achères-la-Forêt | 35 | $3,136 | $348.74 | 44% |
| Paris | 39,295 | $3,085 | $257.47 | 52% |
| Bligny-lès-Beaune | 23 | $3,066 | $279.17 | 43% |
| Saint-Augustin | 17 | $2,985 | $313.19 | 35% |
| Juliénas | 17 | $2,882 | $244.93 | 43% |
| Puligny-Montrachet | 16 | $2,859 | $368.33 | 35% |