Le Breuil Airbnb Market Analysis 2026: Short Term Rental Data & Vacation Rental Statistics in Bourgogne – Franche-Comté, France
Is Airbnb profitable in Le Breuil in 2026? Explore comprehensive Airbnb analytics for Le Breuil, Bourgogne – Franche-Comté, France to uncover income potential. This 2026 STR market report for Le Breuil, based on AirROI data from February 2025 to January 2026, reveals key trends in the niche market of 21 active listings.
Whether you're considering an Airbnb investment in Le Breuil, optimizing your existing vacation rental, or exploring rental arbitrage opportunities, understanding the Le Breuil Airbnb data is crucial. Leveraging the low regulation environment is key to maximizing your short term rental income potential. Let's dive into the specifics.
Key Le Breuil Airbnb Performance Metrics Overview
Monthly Airbnb Revenue Variations & Income Potential in Le Breuil (2026)
Understanding the monthly revenue variations for Airbnb listings in Le Breuil is key to maximizing your short term rental income potential. Seasonality significantly impacts earnings. Our analysis, based on data from the past 12 months, shows that the peak revenue month for STRs in Le Breuil is typically August, while January often presents the lowest earnings, highlighting opportunities for strategic pricing adjustments during shoulder and low seasons. Explore the typical Airbnb income in Le Breuil across different performance tiers:
- Best-in-class properties (Top 10%) achieve $3,278+ monthly, often utilizing dynamic pricing and superior guest experiences.
- Strong performing properties (Top 25%) earn $1,321 or more, indicating effective management and desirable locations/amenities.
- Typical properties (Median) generate around $645 per month, representing the average market performance.
- Entry-level properties (Bottom 25%) see earnings around $356, often with potential for optimization.
Average Monthly Airbnb Earnings Trend in Le Breuil
Le Breuil Airbnb Occupancy Rate Trends (2026)
Maximize your bookings by understanding the Le Breuil STR occupancy trends. Seasonal demand shifts significantly influence how often properties are booked. Typically, Julysees the highest demand (peak season occupancy), while January experiences the lowest (low season). Effective strategies, like adjusting minimum stays or offering promotions, can boost occupancy during slower periods. Here's how different property tiers perform in Le Breuil:
- Best-in-class properties (Top 10%) achieve 60%+ occupancy, indicating high desirability and potentially optimized availability.
- Strong performing properties (Top 25%) maintain 44% or higher occupancy, suggesting good market fit and guest satisfaction.
- Typical properties (Median) have an occupancy rate around 24%.
- Entry-level properties (Bottom 25%) average 14% occupancy, potentially facing higher vacancy.
Average Monthly Occupancy Rate Trend in Le Breuil
Average Daily Rate (ADR) Airbnb Trends in Le Breuil (2026)
Effective short term rental pricing strategy in Le Breuil involves understanding monthly ADR fluctuations. The Average Daily Rate (ADR) for Airbnb in Le Breuil typically peaks in October and dips lowest during April. Leveraging Airbnb dynamic pricing tools or strategies based on this seasonality can significantly boost revenue. Here's a look at the typical nightly rates achieved:
- Best-in-class properties (Top 10%) command rates of $207+ per night, often due to premium features or locations.
- Strong performing properties (Top 25%) achieve nightly rates of $127 or more.
- Typical properties (Median) charge around $68 per night.
- Entry-level properties (Bottom 25%) earn around $54 per night.
Average Daily Rate (ADR) Trend by Month in Le Breuil
Get Live Le Breuil Market Intelligence 👇

Explore Real-time Analytics
Airbnb Seasonality Analysis & Trends in Le Breuil (2026)
Peak Season (August, July, November)
- Revenue averages $2,056 per month
- Occupancy rates average 45.6%
- Daily rates average $113
Shoulder Season
- Revenue averages $1,121 per month
- Occupancy maintains around 28.1%
- Daily rates hold near $111
Low Season (January, February, September)
- Revenue drops to average $689 per month
- Occupancy decreases to average 25.6%
- Daily rates adjust to average $112
Seasonality Insights for Le Breuil
- The Airbnb seasonality in Le Breuil shows highly seasonal trends requiring careful strategy. While the sections above show seasonal averages, it's also insightful to look at the extremes:
- During the high season, the absolute peak month showcases Le Breuil's highest earning potential, with monthly revenues capable of climbing to $2,590, occupancy reaching a high of 55.4%, and ADRs peaking at $133.
- Conversely, the slowest single month of the year, typically falling within the low season, marks the market's lowest point. In this month, revenue might dip to $485, occupancy could drop to 10.3%, and ADRs may adjust down to $100.
- Understanding both the seasonal averages and these monthly peaks and troughs in revenue, occupancy, and ADR is crucial for maximizing your Airbnb profit potential in Le Breuil.
Seasonal Strategies for Maximizing Profit
- Peak Season: Maximize revenue through premium pricing and potentially longer minimum stays. Ensure high availability.
- Low Season: Offer competitive pricing, special promotions (e.g., extended stay discounts), and flexible cancellation policies. Target off-season travelers like remote workers or budget-conscious guests.
- Shoulder Seasons: Implement dynamic pricing that balances peak and low rates. Target weekend travelers or specific events. Offer slightly more flexible terms than peak season.
- Regularly analyze your own performance against these Le Breuil seasonality benchmarks and adjust your pricing and availability strategy accordingly.
Best Areas for Airbnb Investment in Le Breuil (2026)
Exploring the top neighborhoods for short-term rentals in Le Breuil? This section highlights key areas, outlining why they are attractive for hosts and guests, along with notable local attractions. Consider these locations based on your target guest profile and investment strategy.
| Neighborhood / Area | Why Host Here? (Target Guests & Appeal) | Key Attractions & Landmarks |
|---|---|---|
| Château de Chailly | A beautiful historic castle offering a serene setting and perfect for tourists looking for a unique stay. The golf course and fine dining attract visitors seeking relaxation and luxury. | Château de Chailly, Chateau de Cormatin, Burgundy Wine Route |
| Semur-en-Auxois | A picturesque medieval town known for its well-preserved architecture and charming streets. Ideal for history lovers and those interested in authentic French culture. | Old Town, Château de Semur-en-Auxois, Tour de défense, Eglise Notre-Dame |
| Montbard | Gateway to the Burgundy region with access to the historic Abbey of Fontenay. Great location for those wanting to explore Burgundy's rich heritage. | Abbaye de Fontenay, Musee de Montbard, Musée de la Renaisssance |
| Beaune | The wine capital of Burgundy, famous for its Hospices and vineyards. Attracts wine enthusiasts and food lovers from around the world. | Hospices de Beaune, Burgundy Wine Museum, Les Grands Jours de Bourgogne |
| Autun | An ancient town with Roman ruins and a rich history, perfect for tourists interested in archaeology and history. | Temple of Janus, Théâtre Romain, Autun Cathedral |
| Lac de Panthier | A scenic lake area ideal for outdoor enthusiasts and those looking for a tranquil getaway. Popular for fishing and boating activities. | Outdoor activities, Picnic areas, Lakeside trails |
| Parc Naturel Régional du Morvan | A natural park offering beautiful landscapes and outdoor activities, perfect for nature lovers and hikers. | Hiking trails, Lakes and rivers, Wildlife watching |
| Noyers-sur-Serein | A charming village known for its medieval streets and traditional French architecture, perfect for a quiet getaway. | Historic town center, Belfry of Noyers, Eglise Saint-Jean |
Understanding Airbnb License Requirements & STR Laws in Le Breuil (2026)
While Le Breuil, Bourgogne – Franche-Comté, France currently shows low STR regulations, specific Airbnb license requirements might still exist or change. Always verify the latest short term rental regulations and Airbnb license requirements directly with local government authorities for Le Breuil to ensure full compliance before hosting.
(Source: AirROI data, 2026, based on 5% licensed listings)
Top Performing Airbnb Properties in Le Breuil (2026)
Benchmark your potential! Explore examples of top-performing Airbnb properties in Le Breuilbased on Trailing Twelve Month (TTM) revenue. Analyze their characteristics, revenue, occupancy rate, and ADR to understand what drives success in this market.
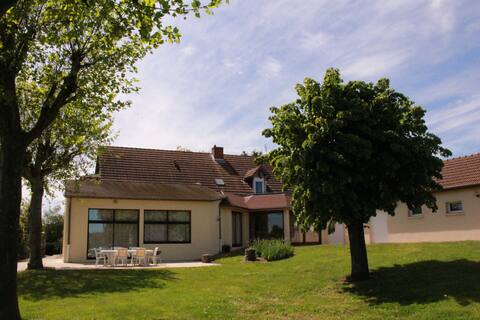
Montvaltin lodges, large bourgeois house
Entire Place • 5 bedrooms
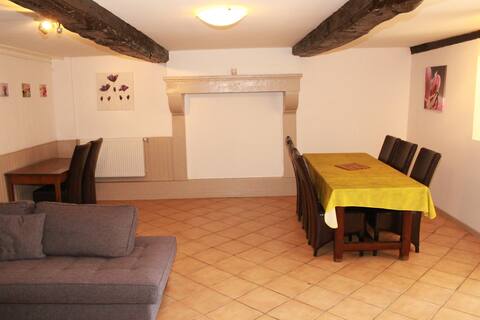
Gîtes de Montvaltin, ground floor apartment
Entire Place • 3 bedrooms
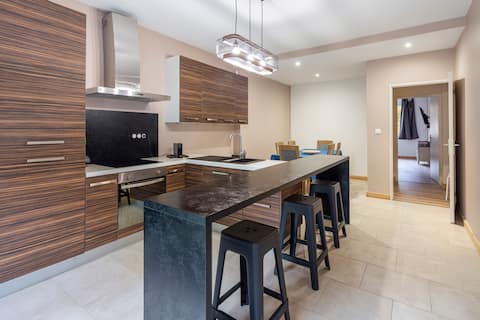
Cottage with pool in Burgundy-Le Creusot
Entire Place • 4 bedrooms
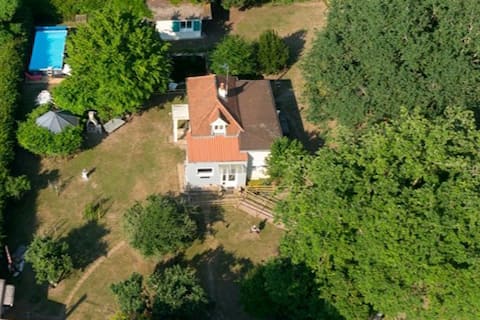
Charming house and pool, in large property
Entire Place • 1 bedroom
Big studio Garden view
Entire Place • 1 bedroom
Petit studio wet room
Entire Place • 1 bedroom
Note: Performance varies based on location, size, amenities, seasonality, and management quality. Data reflects the past 12 months.
Top Performing Airbnb Hosts in Le Breuil (2026)
Learn from the best! This table showcases top-performing Airbnb hosts in Le Breuil based on the number of properties managed and estimated total revenue over the past year. Analyze their scale and performance metrics.
| Host Name | Properties | Grossing Revenue | Stay Reviews | Avg Rating |
|---|---|---|---|---|
| Bénédicte | 8 | $101,005 | 187 | 4.56/5.0 |
| Cindy | 6 | $27,682 | 41 | 3.90/5.0 |
| Ludovic | 1 | $11,245 | 103 | 4.83/5.0 |
| Mélanie | 1 | $5,044 | 14 | 4.93/5.0 |
| Alain | 1 | $2,967 | 127 | 4.94/5.0 |
| Michael | 1 | $1,943 | 21 | 4.76/5.0 |
| Pat | 1 | $1,542 | 88 | 4.94/5.0 |
| Christian | 1 | $1,323 | 47 | 4.85/5.0 |
| Corine | 1 | $532 | 7 | 5.00/5.0 |
Analyzing the strategies of top hosts, such as their property selection, pricing, and guest communication, can offer valuable lessons for optimizing your own Airbnb operations in Le Breuil.
Dive Deeper: Advanced Le Breuil STR Market Data (2026)
Ready to unlock more insights? AirROI provides access to advanced metrics and comprehensive Airbnb data for Le Breuil. Explore detailed analytics beyond this report to refine your investment strategy, optimize pricing, and maximize your vacation rental profits.
Explore Advanced MetricsLe Breuil Short-Term Rental Market Composition (2026): Property & Room Types
Room Type Distribution
Property Type Distribution
Market Composition Insights for Le Breuil
- The Le Breuil Airbnb market composition is heavily skewed towards Entire Home/Apt listings, which make up 81% of the 21 active rentals. This indicates strong guest preference for privacy and space.
- Looking at the property type distribution in Le Breuil, Apartment/Condo properties are the most common (57.1%), reflecting the local real estate landscape.
- Houses represent a significant 33.3% portion, catering likely to families or larger groups.
- Smaller segments like outdoor/unique, hotel/boutique (combined 9.6%) offer potential for unique stay experiences.
Le Breuil Airbnb Room Capacity Analysis (2026): Bedroom Distribution
Distribution of Listings by Number of Bedrooms
Room Capacity Insights for Le Breuil
- The dominant room capacity in Le Breuil is 1 bedroom listings, making up 38.1% of the market. This suggests a strong demand for properties suitable for couples or solo travelers.
- Together, 1 bedroom and 2 bedrooms properties represent 61.9% of the active Airbnb listings in Le Breuil, indicating a high concentration in these sizes.
- A significant 28.6% of listings offer 3+ bedrooms, catering to larger groups and families seeking more space in Le Breuil.
Le Breuil Vacation Rental Guest Capacity Trends (2026)
Distribution of Listings by Guest Capacity
Guest Capacity Insights for Le Breuil
- The most common guest capacity trend in Le Breuil vacation rentals is listings accommodating 4 guests (28.6%). This suggests the primary traveler segment is likely small families or groups.
- Properties designed for 4 guests and 8+ guests dominate the Le Breuil STR market, accounting for 42.9% of listings.
- 33.3% of properties accommodate 6+ guests, serving the market segment for larger families or group travel in Le Breuil.
- On average, properties in Le Breuil are equipped to host 4.3 guests.
Le Breuil Airbnb Booking Patterns (2026): Available vs. Booked Days
Available Days Distribution
Booked Days Distribution
Booking Pattern Insights for Le Breuil
- The most common availability pattern in Le Breuil falls within the 271-366 days range, representing 71.4% of listings. This suggests many properties have significant open periods on their calendars.
- Approximately 95.2% of listings show high availability (181+ days open annually), indicating potential for increased bookings or specific owner usage patterns.
- For booked days, the 1-30 days range is most frequent in Le Breuil (52.4%), reflecting common guest stay durations or potential owner blocking patterns.
- A notable 4.8% of properties secure long booking periods (181+ days booked per year), highlighting successful long-term rental strategies or significant owner usage.
Le Breuil Airbnb Minimum Stay Requirements Analysis
Distribution of Listings by Minimum Night Requirement
1 Night
14 listings
66.7% of total
2 Nights
3 listings
14.3% of total
3 Nights
1 listings
4.8% of total
30+ Nights
3 listings
14.3% of total
Key Insights
- The most prevalent minimum stay requirement in Le Breuil is 1 Night, adopted by 66.7% of listings. This highlights the market's preference for shorter, flexible bookings.
- A strong majority (81.0%) of the Le Breuil Airbnb data shows acceptance of very short stays (1-2 nights), indicating a dynamic, high-turnover market.
- A significant segment (14.3%) caters to monthly stays (30+ nights) in Le Breuil, pointing to opportunities in the extended-stay market.
Recommendations
- Align with the market by considering a 1 Night minimum stay, as 66.7% of Le Breuil hosts use this setting.
- Explore offering discounts for stays of 30+ nights to attract the 14.3% of the market seeking extended stays.
- Adjust minimum nights based on seasonality – potentially shorter during low season and longer during peak demand periods in Le Breuil.
Le Breuil Airbnb Cancellation Policy Trends Analysis (2026)
Limited
1 listings
4.8% of total
Flexible
5 listings
23.8% of total
Moderate
4 listings
19% of total
Firm
4 listings
19% of total
Strict
7 listings
33.3% of total
Cancellation Policy Insights for Le Breuil
- The prevailing Airbnb cancellation policy trend in Le Breuil is Strict, used by 33.3% of listings.
- A majority (52.3%) of hosts in Le Breuil utilize Firm or Strict policies, indicating a market where hosts prioritize booking security.
Recommendations for Hosts
- Consider adopting a Strict policy to align with the 33.3% market standard in Le Breuil.
- With 33.3% using Strict terms, this is a viable option in Le Breuil, particularly for high-value properties or during peak demand periods.
- Regularly review your cancellation policy against competitors and market demand shifts in Le Breuil.
Le Breuil STR Booking Lead Time Analysis (2026)
Average Booking Lead Time by Month
Booking Lead Time Insights for Le Breuil
- The overall average booking lead time for vacation rentals in Le Breuil is 68 days.
- Guests book furthest in advance for stays during December (average 128 days), likely coinciding with peak travel demand or local events.
- The shortest booking windows occur for stays in March (average 13 days), indicating more last-minute travel plans during this time.
- Seasonally, Fall (94 days avg.) sees the longest lead times, while Spring (59 days avg.) has the shortest, reflecting typical travel planning cycles.
Recommendations for Hosts
- Use the overall average lead time (68 days) as a baseline for your pricing and availability strategy in Le Breuil.
- For December stays, consider implementing length-of-stay discounts or slightly higher rates for bookings made less than 128 days out to capitalize on advance planning.
- During March, focus on last-minute booking availability and promotions, as guests book with very short notice (13 days avg.).
- Target marketing efforts for the Fall season well in advance (at least 94 days) to capture early planners.
- Monitor your own booking lead times against these Le Breuil averages to identify opportunities for dynamic pricing adjustments.
Popular & Essential Airbnb Amenities in Le Breuil (2026)
Amenity Prevalence
No amenities with partial availability (less than 100%) were found to display in the chart. All essential amenities might be present in all listings. Check insights below.
Amenity Insights for Le Breuil
- Essential amenities in Le Breuil that guests expect include: Coffee maker, Bed linens, Microwave, Refrigerator, TV, Hangers, Cooking basics, Dishes and silverware, Heating, Kitchen. Lacking these (any) could significantly impact bookings.
Recommendations for Hosts
- Ensure your listing includes all essential amenities for Le Breuil: Coffee maker, Bed linens, Microwave, Refrigerator, TV, Hangers, Cooking basics, Dishes and silverware, Heating, Kitchen.
- Highlight unique or less common amenities you offer (e.g., hot tub, dedicated workspace, EV charger) in your listing description and photos.
- Regularly check competitor amenities in Le Breuil to stay competitive.
Le Breuil Airbnb Guest Demographics & Profile Analysis (2026)
Guest Profile Summary for Le Breuil
- The typical guest profile for Airbnb in Le Breuil consists of primarily domestic travelers (89%), often arriving from nearby Le Creusot, typically belonging to the Post-2000s (Gen Z/Alpha) group (50%), primarily speaking French or English.
- Domestic travelers account for 88.9% of guests.
- Key international markets include France (88.9%) and Germany (5.6%).
- Top languages spoken are French (50%) followed by English (31.6%).
- A significant demographic segment is the Post-2000s (Gen Z/Alpha) group, representing 50% of guests.
Recommendations for Hosts
- Target domestic marketing efforts towards travelers from Le Creusot and Lyon.
- Tailor amenities and listing descriptions to appeal to the dominant Post-2000s (Gen Z/Alpha) demographic (e.g., highlight fast WiFi, smart home features, local guides).
- Highlight unique local experiences or amenities relevant to the primary guest profile.
- Consider seasonal promotions aligned with peak travel times for key origin markets.
Nearby Short-Term Rental Market Comparison
How does the Le Breuil Airbnb market stack up against its neighbors? Compare key performance metrics like average monthly revenue, ADR, and occupancy rates in surrounding areas to understand the broader regional STR landscape.
| Market | Active Properties | Monthly Revenue | Daily Rate | Avg. Occupancy |
|---|---|---|---|---|
| Épinac | 18 | $8,488 | $539.65 | 36% |
| Saint-Trivier-sur-Moignans | 10 | $3,748 | $311.34 | 37% |
| Bourdeau | 13 | $3,327 | $260.60 | 50% |
| Bligny-lès-Beaune | 23 | $3,066 | $279.17 | 43% |
| Juliénas | 17 | $2,882 | $244.93 | 43% |
| Puligny-Montrachet | 16 | $2,859 | $368.33 | 35% |
| Romanèche-Thorins | 13 | $2,790 | $292.42 | 38% |
| Rully | 21 | $2,775 | $211.98 | 39% |
| Anneyron | 11 | $2,670 | $253.37 | 44% |
| Saint-Romain | 17 | $2,647 | $326.60 | 36% |